Charting the Economy
Timely economic data curated by research staff at the Federal Reserve Bank of Kansas City. Click the link button in the chart title to copy and share.
Disclaimer
The views expressed are those of the authors and do not necessarily reflect the positions of the Federal Reserve Bank of Kansas City or the Federal Reserve System.
Employment in AI-Intensive Sectors Is Growing More Slowly
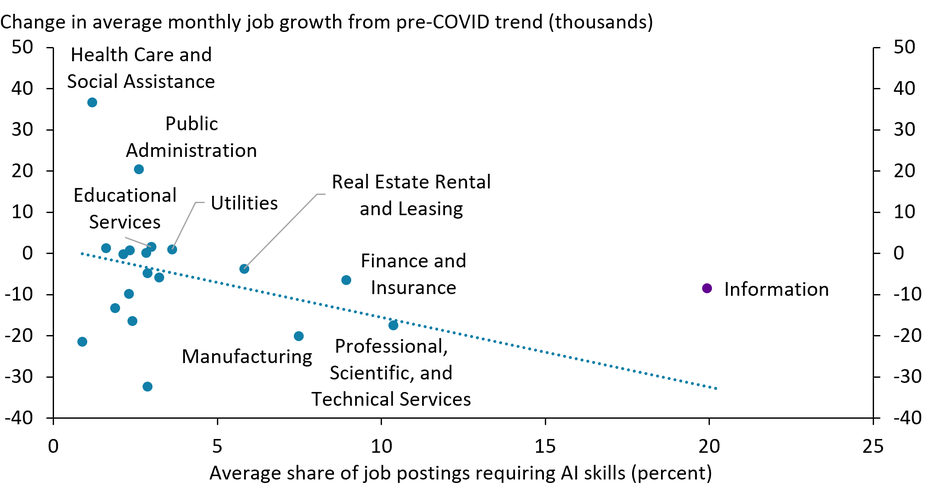
Notes: Each dot represents one industry at the two-digit North American Industry Classification System (NAICS) level. The horizontal axis shows the average monthly share of job postings requiring AI skills between January and May 2026. The vertical axis shows the change in average monthly job growth between November 2022 and May 2026, measured against the pre-COVID trend (January 2010–December 2019), in thousands. The fitted line shows the correlation between the two measures across industries, excluding NAICS sector 51 (Information), shown in purple.
Sources: U.S. Bureau of Labor Statistics and Lightcast.
Since November 2022, sectors with a larger share of job postings requiring AI skills (horizontal axis) have generally seen slower job growth relative to their pre-COVID trend (vertical axis). This pattern offers tentative evidence that AI may be displacing workers in some sectors while augmenting them in others. The correlation is only suggestive, however, as other factors including post-pandemic demand shifts and sector-specific cycles could also be driving the differences in job growth. The information sector (purple dot) is the notable outlier in the chart due to its high share of AI-related jobs and its relatively small size, but job losses have also been significant in this sector since November 2022.
Natural Amenities Account for Nearly One-Third of Housing Affordability Differences Across Counties
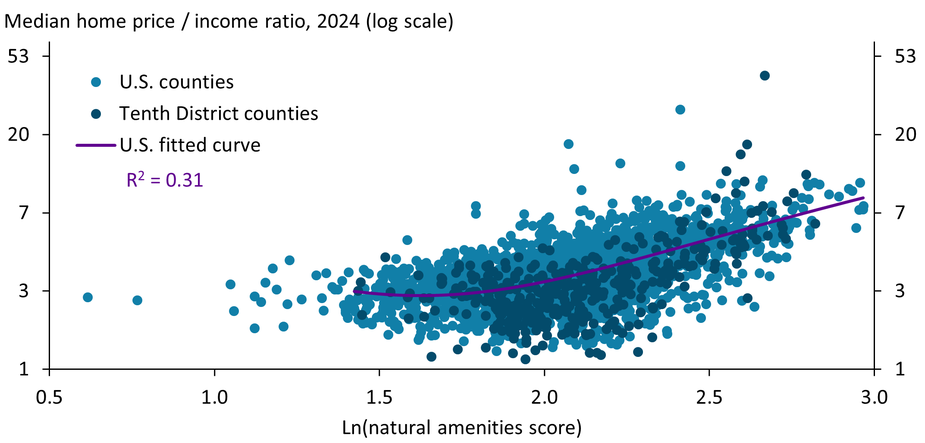
Notes: The vertical axis is on a logarithmic scale and shows the average monthly median home value for a county divided by the county median household income in 2024. The horizontal axis shows the natural logarithm of the USDA’s natural amenities score, after adding 8.25 to avoid negative values. The chart plots 3,045 U.S. counties, 412 of which are in the Tenth Federal Reserve District. The plotted curve excludes the bottom 1 percent of natural amenities scores for clarity, but the regression was estimated using all counties.
Sources: U.S. Department of Agriculture (USDA), Zillow, U.S. Census Bureau, and authors’ calculations.
In the United States, homes in counties with greater natural amenities were less affordable, on average, in 2024. The light blue dots and fitted curve in the chart show that counties with higher natural amenities scores typically had higher median home values relative to household income. Overall, natural amenities accounted for 31 percent of variation in home affordability across U.S. counties. The Tenth Federal Reserve District (dark blue dots) had some counties with particularly high home value-to-income ratios, all located in scenic areas of Colorado and Wyoming.
Higher Initial Well Output in the Permian Basin Has Not Slowed Oil Production Declines
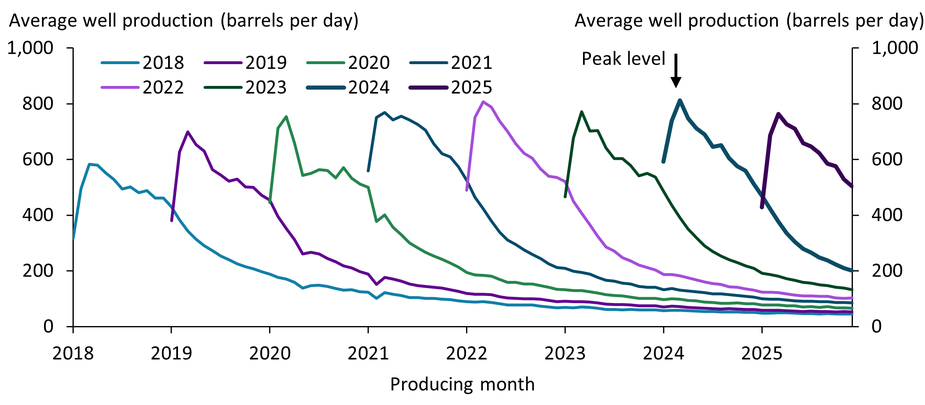
Note: The chart shows average monthly well production from first production date for all producing wells in the Delaware sub-basin of the Permian from January 2018 through December 2025.
Source: Enverus.
The Permian Basin in western Texas and southeastern New Mexico has been a major driver of U.S. crude oil, helping lift total U.S. production to near record highs of about 13.6 million barrels per day on average throughout 2025. Whether this output can be sustained will depend on drilling intensity, inventory quality, and oil prices. The chart shows rising peak average well production through 2024, with initial output often reaching 700–800 barrels per day. However, production declines sharply in the first year—by around 50–70 percent—suggesting technology has lifted peaks more than flattened decline rates. Recent production data hint at plateauing gains, as peak output resembles prior highs and production tails converge.
Investors See Greater Downside Risk Around the Path of Interest Rates
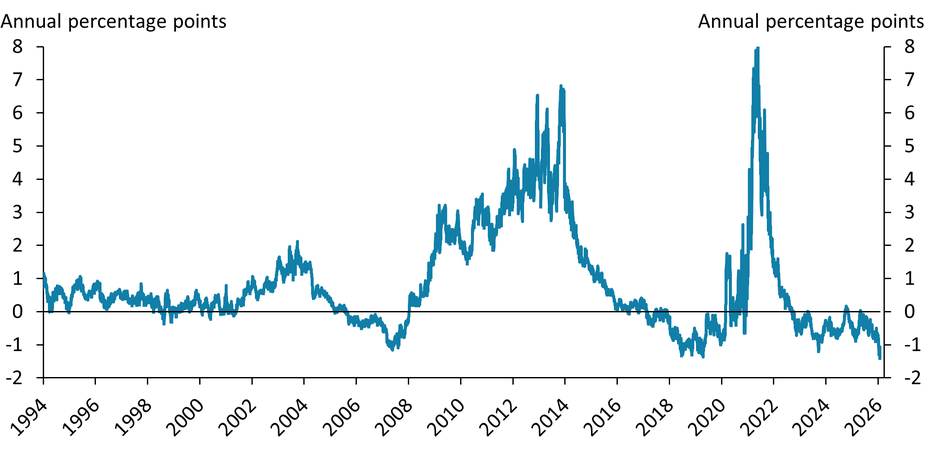
Source: Federal Reserve Bank of Kansas City.
The Kansas City Fed’s Measure of Policy Rate Skew (KC PRS) is a daily measure of how financial markets perceive the balance of risks to short-term U.S. interest rates one year in the future. Prior analysis shows the KC PRS can indicate whether future short-term interest rates are likely to be higher or lower than forecasters predicted in real time. Over the past year, the KC PRS has reached historically low levels, indicating that investors see greater downside risk around the path of interest rates. See the Economic Bulletin, "How Do Financial Markets Perceive the Balance of Risks to the Policy Rate?" by Bundick, Doh, and Smith (2024) for more information and analysis.
Current Labor Market Conditions May Be Supporting Productivity Gains
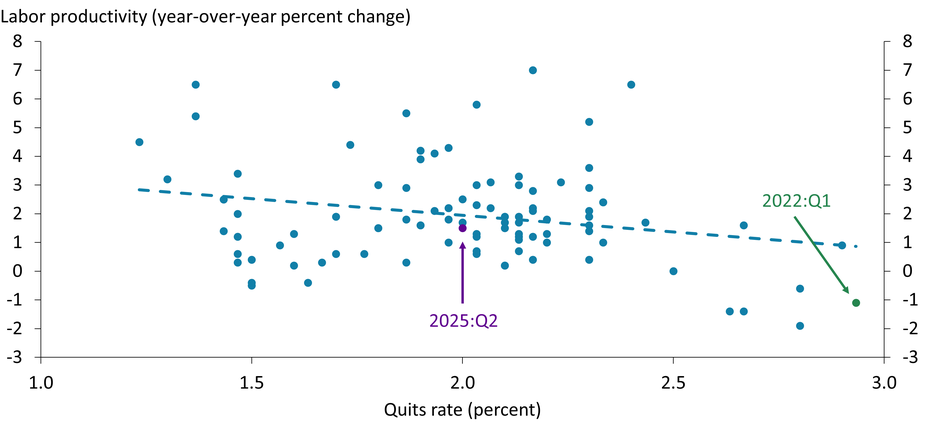
Notes: Labor productivity is defined as output per hour worked. The monthly quits rate is averaged to a quarterly frequency to match the labor productivity data. The sample spans from 2001:Q1 to 2025:Q2. The dashed line indicates the ordinary least squares regression fit.
Sources: U.S. Bureau of Labor Statistics (Haver Analytics) and authors’ calculations.
In the short run, labor productivity tends to decline as the share of workers quitting their jobs increases; as quits rise, firms may intensify hiring and training activities, which are costly and disrupt production. The first quarter of 2022 (green dot) marked the peak of the “Great Resignation,” when quits reached historic highs and labor productivity fell. The most recent data (2025:Q2, purple dot), indicates a moderate quits rate and positive productivity growth, suggesting that current labor market conditions may be supporting productivity gains and that labor market-related inflationary pressures may be easing.
Alternative Version of KC Fed LMCI Accurately Predicted Unemployment Rate and Payroll Growth in September
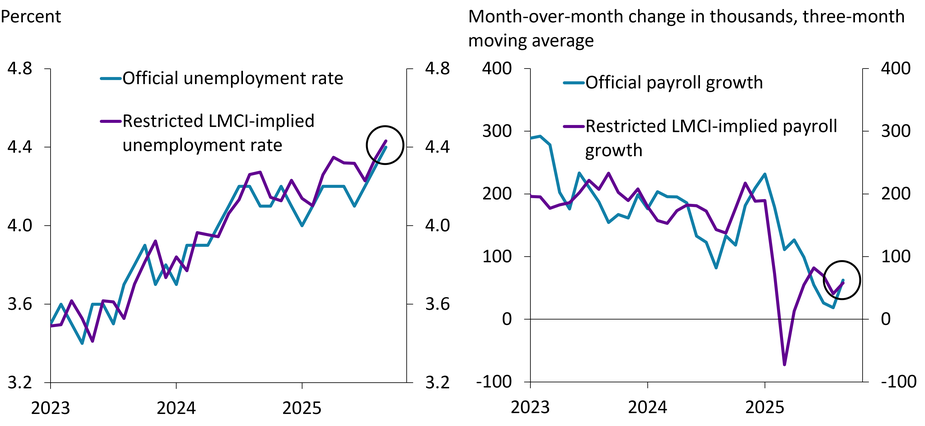
Sources: Federal Reserve Bank of Kansas City; Mustre-del-Río, Oliyide, and Pollard (2025); and U.S. Bureau of Labor Statistics (Haver Analytics).
In a recent Economic Bulletin, we constructed a version of the Kansas City Fed Labor Market Conditions Indicators (LMCI) that excluded government data delayed by the shutdown. We used the restricted LMCI to estimate the unemployment rate and payroll growth in September. The recent release of the official September labor report shows that the restricted LMCI correctly forecast a September unemployment rate of 4.4 percent and average monthly payroll gains of around 60,000 between July and September (circled areas), suggesting that the restricted LMCI can help estimate labor market conditions when standard data are unavailable.
Home Prices Have Stabilized as Inventories Near Decade Highs

Notes: Inventories (from Redfin) reflect the total number of active home listings on the last day of the month, including newly constructed homes available for purchase. Prices (Zillow) are the measure of the typical home value in a given region, reflecting the typical value for homes in the 35th to 65th percentile range. For both series, the Tenth District lines take the average for states in the region, which includes Colorado, Kansas, Missouri, Nebraska, New Mexico, and Oklahoma. Wyoming is excluded as it is not reported by Redfin.
Sources: Redfin.com, Zillow, Haver Analytics, and author’s calculations.
Inventories of homes for sale fell markedly during the pandemic across the United States after several years of slight decline. In the Tenth Federal Reserve District, inventories neared 2016 levels this year. As home inventories increased (blue lines), home prices stabilized (purple lines), though prices have yet to fall on average. Some studies from industry groups (such as Realtor.com and others) note that home sellers may be delisting properties rather than accepting lower prices, perhaps limiting the increase in inventories and partially explaining stability in home prices.
Import Duty Collections Are Concentrated in the Heavy and Technology-Oriented Manufacturing Industry
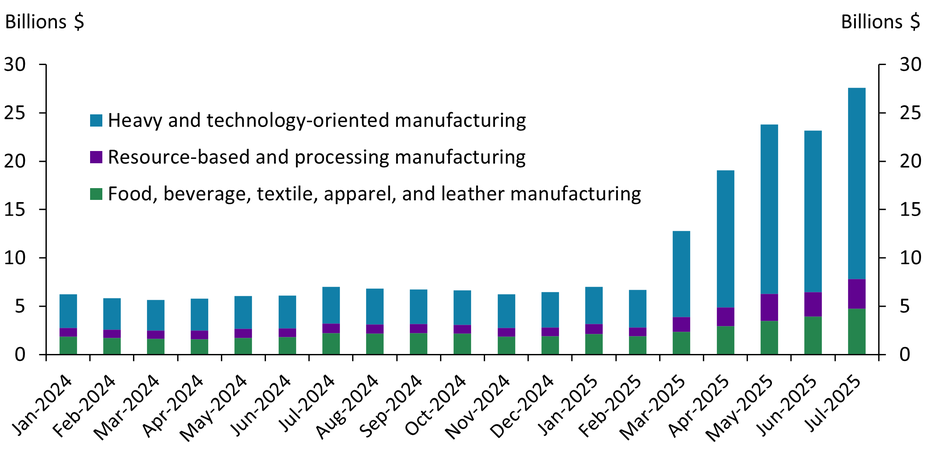
Sources: U.S. Census Bureau and author’s calculations.
Notes: The “resource-based and processing manufacturing” sector corresponds to the North American Industry Classification System (NAICS) code 32, “food, beverage, textile, apparel, and leather manufacturing” corresponds to NAICS 31, and “heavy and technology-oriented manufacturing” corresponds to NAICS 33.
The bulk of recent import duties were collected from U.S. businesses in the heavy and technology-oriented manufacturing industry, which produces electronic equipment, transportation equipment, and metal machinery, among other goods. Heavy and technology-oriented manufacturing businesses (blue bars) paid almost $20 billion of the $28 billion total import duties paid by U.S. manufacturing businesses in July and accounted for roughly 75 percent of the growth in import duties collected from all manufacturing businesses over the last year. Collections of duties from other types of manufacturing also increased substantially this year, but to a lesser extent.
Earnings Gains from Inter-State Mobility Are Largest for Younger and More Educated Individuals
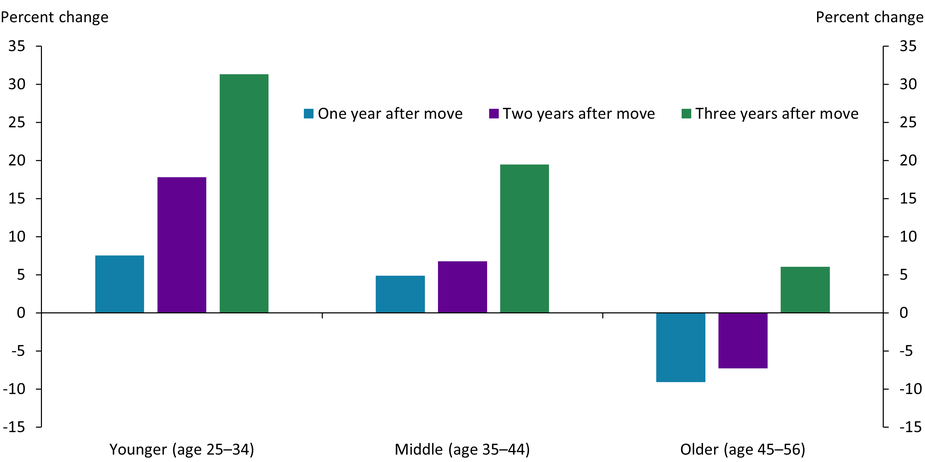
Notes: Each bar represents excess earnings growth from moving versus staying by age and years since interstate move. More specifically, each bar represents how individuals’ earnings increase in the years following an interstate move relative to their pre-move earnings and to similar aged individuals who stay. All calculations are for college-educated males age 25–56 using data from the Survey of Income and Program Participation 1996 Panel, which spans from 1996 to 1999.
Sources: Glover and Mustre-del-Río (2024), Survey of Income and Program Participation 1996 Panel, U.S. Census Bureau, and authors’ calculations.
When younger college graduates (age 25–34) move to a different state, they see greater earnings increases than older graduates who move. Not only do younger graduates’ earnings increase more in the first year after moving (blue bar), they continue increasing three years post-move (green bar). The aging of the U.S. population has weighed on migration in recent years. However, in “Inter-State Labor Mobility and the U.S. Economy,” presented at the 2025 Jackson Hole Economic Symposium, Linda Tesar and co-authors find the U.S. population has also gotten more educated, boosting migration and offsetting the influence of aging.
Continued Increases in the Selling Price Index from the Kansas City Fed’s Services Survey Suggest Some Upside Risk to Inflation
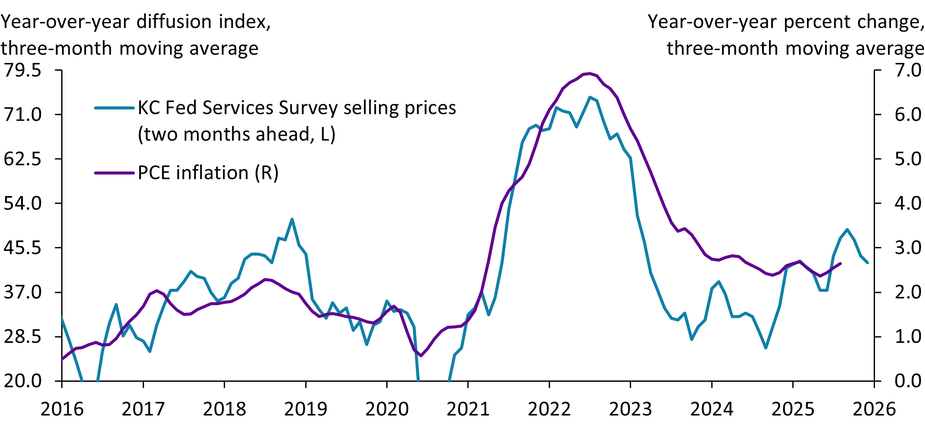
Notes: The selling prices diffusion index shows the net percentage of firms reporting increased selling prices from a year ago. The index is shifted forward two months in the chart to align with PCE inflation. The selling prices index data go through October 2025 (shown as December 2025 in the chart) and the PCE inflation data go through August 2025.
Sources: Federal Reserve Bank of Kansas City and U.S. Bureau of Economic Analysis. Both sources accessed via Haver Analytics.
The Kansas City Fed’s Services Survey releases data on selling prices every month, four to five weeks prior to the release of inflation data based on the price index for Personal Consumption Expenditures (PCE). These survey data may thus provide an early signal for potential shifts in inflation. Indeed, the chart shows that the selling price index from the Services Survey (blue line) closely tracks PCE inflation (purple line) with a two-month lead. The selling prices index has moved up sharply since April, peaking in July 2025. Although the selling price index has cooled somewhat in recent months, the increase through July could indicate that PCE inflation may increase further before moderating.
An Aging Population Raises Asset Demand, Which Helps Explain Lower Real Interest Rates

Notes: The share of the U.S. population age 65 and older is shown annually. Historical data are from the United Nations World Population Prospects (UN WPP). Projections use the UN WPP 2024 medium variant and are shown as a dashed line. The 10-year real interest rate is the Federal Reserve Bank of Cleveland’s model-based estimate (monthly), which combines financial market data and survey information, averaged to a calendar-year frequency.
Sources: United Nations Department of Economic and Social Affairs and Federal Reserve Bank of Cleveland (Haver Analytics).
The share of Americans age 65 and older has risen and is projected to increase further. Older households tend to hold more wealth, pushing up the demand for assets across the entire economy. A paper by Auclert, Malmberg, Rognlie, and Straub, presented at the Kansas City Fed’s 2025 Jackson Hole Economic Symposium, shows that higher asset demand relative to supply lowers the market-clearing real rate. The chart shows the rise in older population (blue line) alongside a decline in long-term real yields since the 1980s (purple line). Demographics help explain why real rates fell, and an aging population may keep real rates subdued.
Federal Funds Rate Was Lower Than Prescribed by the Taylor Rule During Post-Pandemic Inflation Surge; New Research Argues This Was Appropriate Policy

Notes: The Taylor rule rate is calculated as the nominal natural rate (estimated by authors) plus a weighted sum of the inflation gap (core PCE minus 2 percent) and the unemployment gap (unemployment rate minus the Congressional Budget Office’s noncyclical rate). Weights are from Taylor (External Link1993) with an Okun’s Law coefficient of 2.
Sources: U.S. Bureau of Economic Analysis, U.S. Bureau of Labor Statistics, U.S. Congressional Budget Office, and authors’ calculations.
As inflation surged following the COVID-19 pandemic, the federal funds rate (blue line) remained below the rate prescribed by the Taylor rule (purple line), which tracks the natural rate of interest while attempting to keep inflation at 2 percent and labor markets at full employment. In “Beyond the Taylor Rule,” presented at the Kansas City Fed’s 2025 Jackson Hole Economic Symposium, Emi Nakamura, Venance Riblier, and Jón Steinsson argue this accommodative stance of policy was appropriate in the face of an inflationary shock since Fed credibility kept inflation expectations well anchored.
Growing Difference Between Women’s Ideal Versus Actual Number of Children Highlights Mismatch Associated with Declining Fertility Rates

Notes: The average number of children reflects survey responses from women age 40+ on the number of children they had. Survey participants were also asked, “What do you think is the ideal number of children for a family to have?” The curves displayed in the chart are generated using local polynomial regressions to provide a smoothed representation of the underlying data trends.
Source: General Social Survey (NORC, University of Chicago).
The average number of children per woman age 40+ has declined from nearly 3.0 children in the 1970s to about 2.2 in 2024, according to the data from the General Social Survey (blue line). Over the same period, surveyed women’s “ideal number of children for a family” declined more moderately, stabilizing at around 2.5 children since the late 1990s (purple line). A paper presented by Claudia Goldin at the Kansas City Fed’s 2025 Jackson Hole Economic Policy Symposium may help explain why realized fertility rates have fallen below what women on average view as an ideal number for a typical family. As women gain more autonomy and economic opportunities, they may delay or forgo having children altogether, with these fertility decisions likely shaped by the degree of societal support for women in their caregiving roles.
Continued Weakness in Employment Indexes from the Kansas City Fed’s Manufacturing Survey Could Portend Additional Job Losses in the Manufacturing Sector
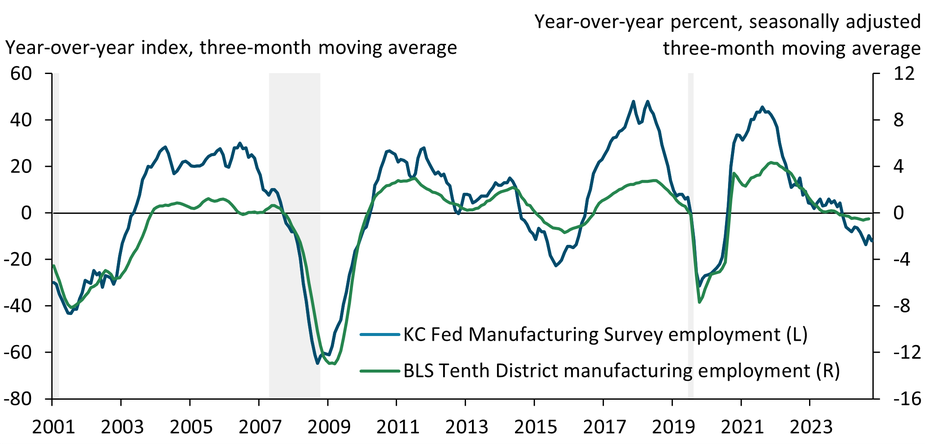
Notes: The employment index from the Kansas City Fed’s Manufacturing Survey reflects respondents’ assessment of employment levels compared with one year ago. Manufacturing employment for the Tenth Federal Reserve District (Colorado, Kansas, Nebraska, Oklahoma, Wyoming, and parts of Missouri and New Mexico) is calculated using state-level data from the U.S. Bureau of Labor Statistics (BLS). Gray shading depicts National Bureau of Economic Research (NBER)-defined recessions.
Sources: Federal Reserve Bank of Kansas City, BLS, and NBER (all accessed via Haver Analytics).
Official economic data are frequently released with a lag, making monitoring economic activity in real time a challenge. Survey data from the Kansas City Fed can help bridge this gap in data. Monthly measures of employment activity from our manufacturing survey are released more than three weeks prior to official state-level employment data from the U.S. Bureau of Labor Statistics. These series correlate closely, suggesting survey data may provide insight into the direction of employment. Recent weakening in survey employment indicators (blue line) may portend a further decline in Tenth District manufacturing employment (green line) in coming months.
The views expressed are those of the authors and do not necessarily reflect the positions of the Federal Reserve Bank of Kansas City or the Federal Reserve System.
Ownership of Treasuries Has Shifted from Price-Insensitive Investors to Price-Sensitive Investors, Putting Upward Pressure on Yields
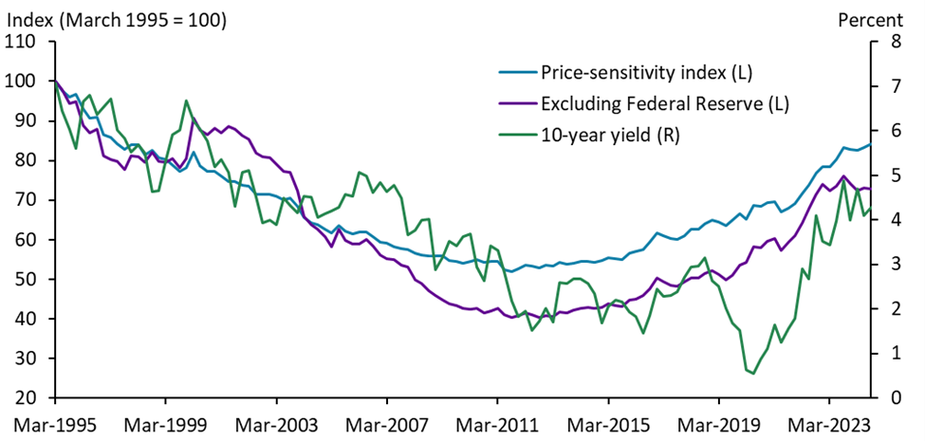
Notes: Chart plots an index summarizing the changing price sensitivity of Treasury investor demand with and without the Federal Reserve. The sensitivity index comprises the inverse sum of sector-level demand elasticity estimates from Krishnamurthy and Vissing-Jorgensen (2007) weighted by Treasury market share.
Sources: U.S. Department of the Treasury (Haver Analytics), Treasury International Capital (TIC) System (Board of Governors of the Federal Reserve), Board of Governors of the Federal Reserve System (Haver Analytics), Krishnamurthy and Vissing-Jorgensen (2007), and author’s calculations.
The share of Treasuries owned by price-insensitive investors, including the Federal Reserve and foreign governments, grew from 1995 through 2011, reducing overall price sensitivity (blue and purple lines) and putting downward pressure on yields (green line). Recently, the Treasury market has shifted to more price-sensitive investors such as pension funds, insurance funds, and banks, increasing aggregate price sensitivity. With a more price-sensitive investor base, the same supply of Treasuries requires higher yields for investors to absorb them.
Number of Job Cuts Announced in April Was Much Lower than March, but More Cuts Were Due to Market and Economic Conditions
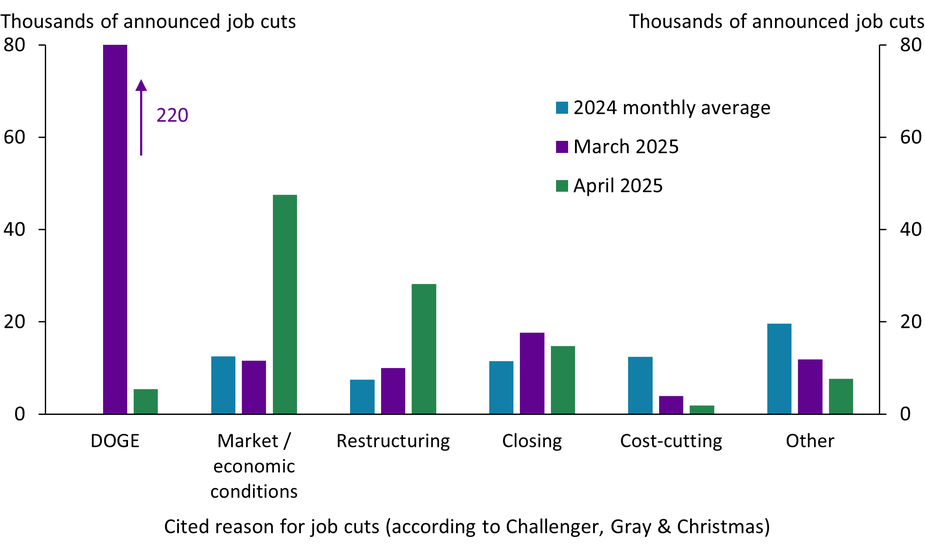
Notes: Challenger, Gray & Christmas assign each layoff announcement to a category. This year they created two “DOGE” categories defined as job cuts attributed to “DOGE actions” and “DOGE downstream impact.”
Source: Challenger, Gray & Christmas, Inc.
According to Challenger, Gray & Christmas, an estimated 80 percent of the 275,240 job cuts announced in the United States in March 2025 were due to Department of Government Efficiency (DOGE) actions (first purple bar), including layoffs in the federal government sector. Job cuts due to other reasons were in line with 2024 monthly averages (blue bars). In April 2025, announced job cuts were much lower at 105,441 (sum of green bars) but still well above the 2024 monthly average of 63,447 (sum of blue bars). Employers reported market/economic conditions and restructuring as the main causes of April job cuts, suggesting some firms are pulling back in the face of uncertainty.
U.S. Dollar Depreciation Amid Rising Treasury Yields Is Uncommon but Not Unprecedented
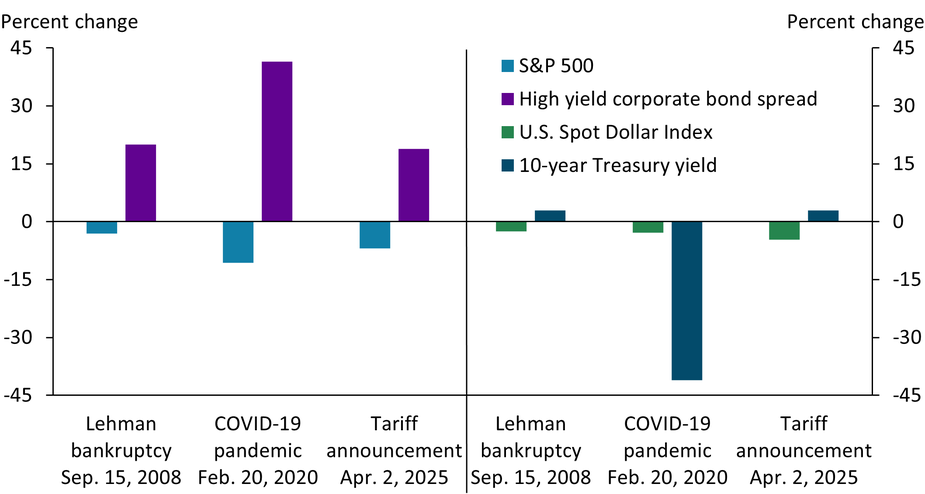
Notes: Bars reflect the percent change 10 days from event date. The External Linkhigh yield spread denotes the difference between the constructed index on high yield (below investment grade) bonds and the spot Treasury curve. The U.S. Spot Dollar Index is described External Linkhere.
Sources: Board of Governors of the Federal Reserve System (Haver Analytics), Intercontinental Exchange (Haver Analytics), Ice Data Indices, LLC (Federal Reserve Bank of St. Louis, FRED), and Standard and Poor’s (Haver Analytics).
In the days following the April 2 tariff announcement, equity and debt valuations (light blue and purple bars, respectively) saw disruptions rivaling the onset of the 2020 pandemic and the 2008 financial crisis. The U.S. dollar (green bar) depreciated amid rising Treasury yields (navy bar), deviating from a historically positive relationship, whereby higher Treasury yields attracted global investors and strengthened the dollar. Many market watchers expressed concern around the “safe haven” status of U.S. Treasury securities, but while this relationship between the dollar and Treasury securities is indeed atypical, such deviations were also observed in the days following the 2008 Lehman bankruptcy.
Agricultural Exports to China, Mexico, and Canada Are Important for U.S. Farm Sector Revenues
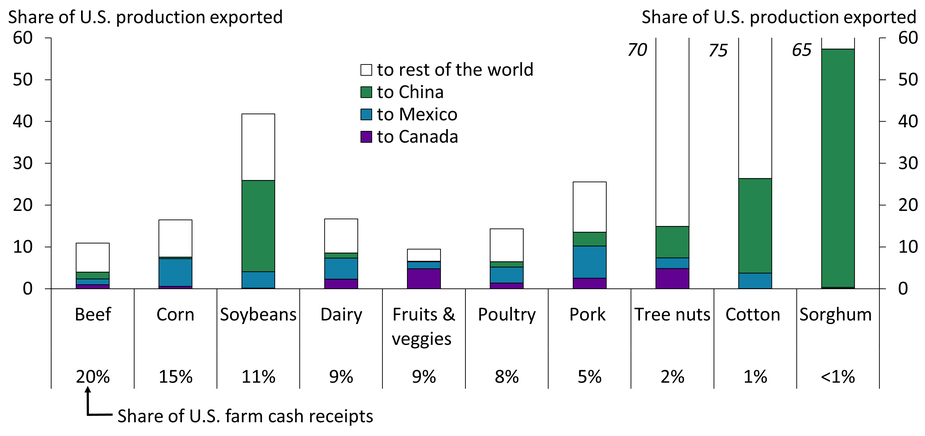
Note: Cash receipts for cattle and hogs are used to represent beef and pork.
Sources: USDA and author’s calculations.
China, Mexico, and Canada are primary destinations for many U.S. agricultural exports. Exports to China (green bars) account for about 20 percent of U.S. soybean production as well as about 55 percent of sorghum, 20 percent of cotton, and 8 percent of tree nut production. Exports to Mexico (blue bars) account for 5–7 percent of corn, dairy, and pork production, and exports to Canada (purple bars) account for about 5 percent of tree nut and fruit and vegetable production. Agricultural exports to Canada, China, and Mexico collectively account for roughly 10 percent of U.S. farm cash receipts.
Differences in Inflation Rates Across Federal Reserve Districts Have Narrowed in Recent Years, But Remain Notable

Notes: Map shows district year-over-year CPI inflation rates for January 2025 and June 2022. We compute the implied consumer price index (CPI) annual inflation rates for each Federal Reserve district using a population-weighted average of regional CPIs from the U.S. Bureau of Labor Statistics.
Sources: U.S. Bureau of Labor Statistics and U.S. Census Bureau (both accessed via Haver Analytics); authors’ calculations.
The 12 districts of the Federal Reserve have experienced different annual inflation rates over the past year. Northeastern districts had the highest inflation in January 2025 (dark purple), while western and southern districts had the lowest (dark blue). District-level inflation ranged from 4 percent for the Boston Fed (District 1A) to 2.1 percent for the Dallas Fed (District 11K), a 1.9 percentage point difference. However, differences across districts were more substantial when inflation peaked in mid-2022, with a 2.9 percentage point difference between the highest (Dallas) and lowest (New York) districts.
Smaller Urban Areas Continue to Gain Population at the Expense of the Largest Urban Areas
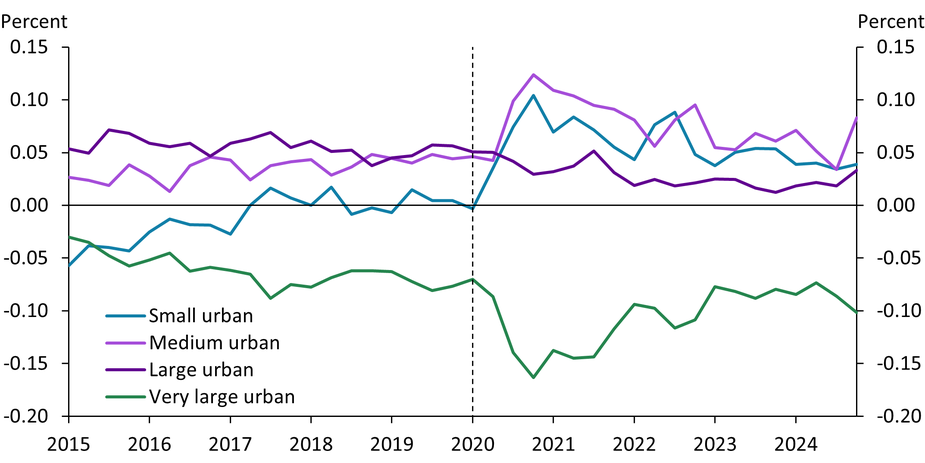
Notes: Chart shows the quarter-to-quarter net (in-out) migration rates between urban areas of various sizes. Dashed vertical line represents 2020:Q1, when a national emergency was declared in response to the pandemic.
Source: Federal Reserve Bank of New York Consumer Credit Panel/Equifax.
Domestic migration between U.S. urban areas was greatly disrupted by the COVID-19 pandemic. Using high-frequency credit bureau data from Equifax, we show that between 2020 and 2021, very large urban areas (over 4 million people) experienced large declines in net migration rates (green line). Over the same period, the greatest increases in net domestic migration rates occurred in small (12,000–220,000 people) and medium-sized (220,000–1 million people) urban areas. As of late 2024, small urban areas continue to experience the largest increase compared with pre-pandemic levels (blue line). To learn more, see Brown and Tousey (2021).
Labor Productivity Gains Reflect Innovation-Driven Growth
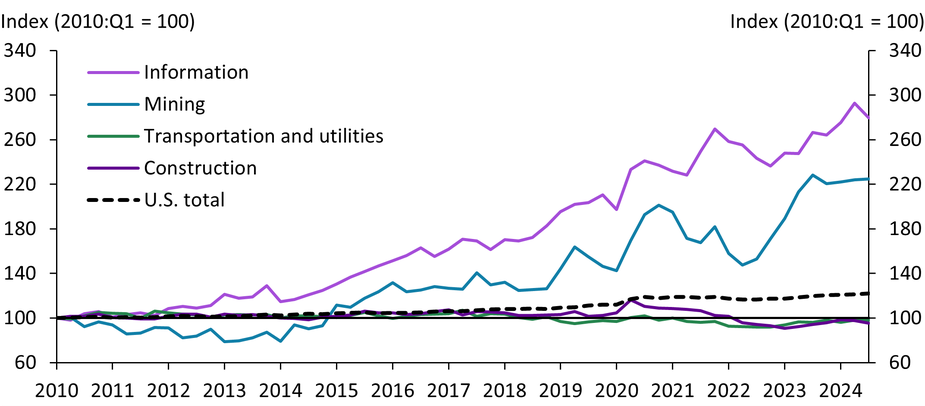
Notes: Labor productivity measures output per hour worked. The U.S. total refers to the nonfarm business sector.
Sources: U.S. Bureau of Labor Statistics and U.S. Bureau of Economic Analysis (both accessed through Haver Analytics); authors’ calculations.
U.S. labor productivity has been a key driver of robust economic growth in recent years (Çakır Melek and Gallin 2024). Although total productivity has steadily improved (dashed line), productivity gains have varied significantly across sectors. Transportation and utilities (green line) and construction (dark purple line) have lagged the aggregate economy. In contrast, the information sector (light purple line) and mining sector (blue line)—particularly oil and gas extraction—have shown exceptional productivity growth, highlighting the economy’s potential for continued strength. The information sector fosters innovation and technology adoption across industries, while advances in oil and gas reflect the efficiency gains of tech-driven production.
After Banking Turmoil in 2023, Uninsured Deposits Moved Rapidly Out of Banks with Volatile Deposit Turnover
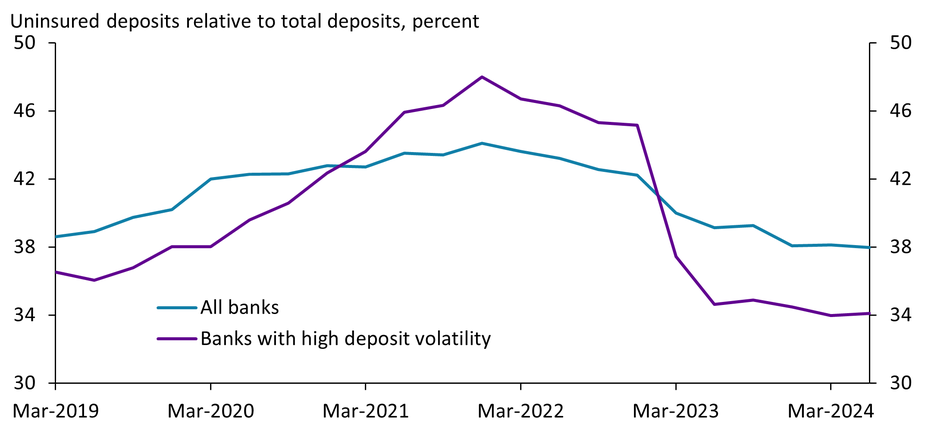
Notes: Banks with high deposit volatility are defined as having the deposit coefficient of variation above the 90th percentile. The deposit coefficient of variation is evaluated on total deposits for each bank over the period 2011:Q1 to 2024:Q2.
Sources: Federal Financial Institutions Examination Council and authors’ calculations.
Uninsured deposits increased as a percentage of total deposits for all banks from 2019 to 2021 (blue line), then declined gradually following monetary policy tightening in 2022 and more rapidly after the banking turmoil in 2023. Uninsured deposit shares at banks with high deposit volatility have followed a similar pattern (purple line), but both the magnitude of the earlier increase and of the recent decline were more heightened. These trends suggest that banks with a volatile deposit base may occasionally build up higher shares of uninsured deposits, but these flow out briskly in times of stress.
Strong Economic Data over the Last FOMC Intermeeting Period Suggest the Longer-Run Neutral Interest Rate May Be Higher
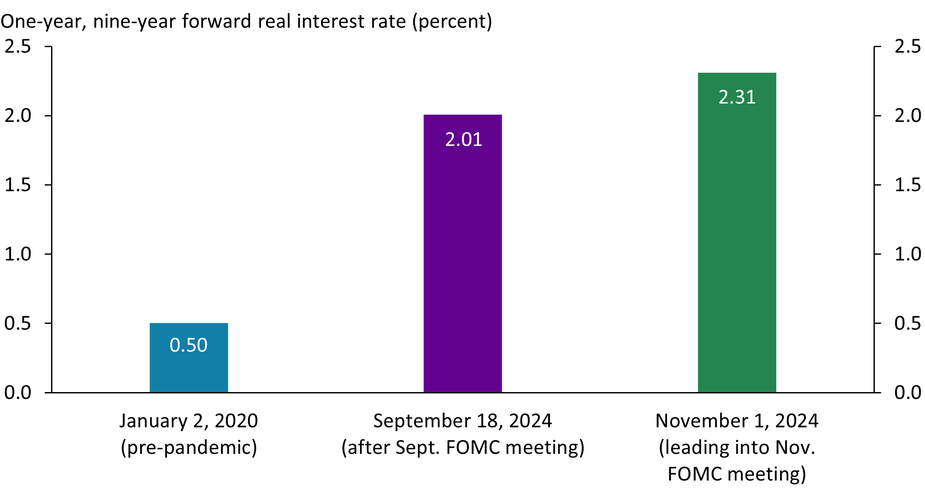
Notes: The one-year, nine-year forward measure is derived from the real Treasury (TIPS) yield curve by subtracting the average interest rate over the next nine years from the average interest rate over the next 10 years. The one-year, nine-year forward measure can be interpreted as the average real interest rate expected to prevail over the year starting nine years in the future.
Source: Board of Governors of the Federal Reserve System (Haver Analytics).
Before the pandemic, market expectations for real interest rates nine years in the future were only 0.5 percent (blue bar). Over the last two years, however, economic conditions remained strong even as the federal funds rate increased over 500 basis points, suggesting that the longer-run neutral interest rate, and, in turn, far-forward market expectations, may have moved higher. Indeed, in September 2024, market expectations for real interest rates were 2.0 percent (purple bar). More recently, spending and private employment data came in strong between the September and November FOMC meetings, leading market participants to further revise up their expectations for far-forward real interest rates (green bar).
Rent Trends for New Tenants Suggest Rent Inflation Will Continue to Decline
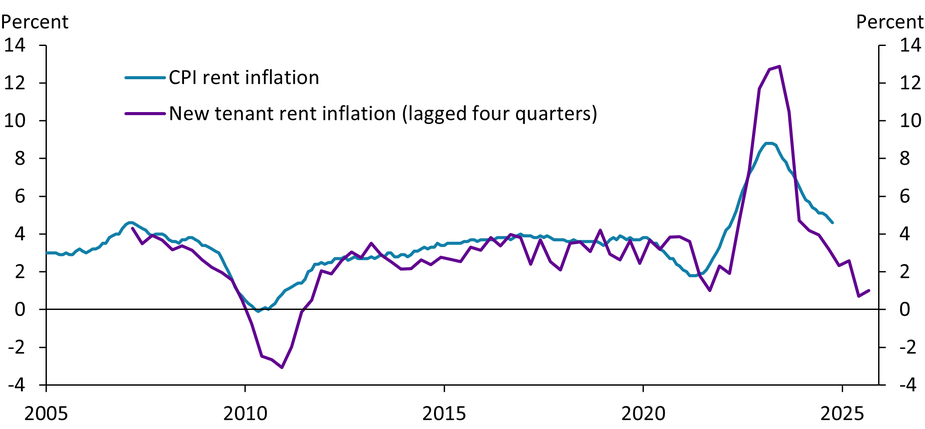
Notes: “CPI rent inflation” captures the year-over-year percent change in the consumer price index (CPI) for Rent of Primary Residence. “New tenant rent inflation” captures the year-over-year percent change in the U.S. Bureau of Labor Statistics (BLS) New Tenant Rent Index.
Source: BLS (Haver Analytics).
Although rent inflation as measured by the consumer price index (CPI) for rent has been declining since its early 2023 peak (blue line), it remains above its pre-pandemic pace. The new tenant rent index from the Bureau of Labor Statistics (BLS), which tracks rent growth exclusively for new leases, provides a more timely view of rental market conditions and offers insights into the future trajectory of rent inflation. Recent declines in new tenant rent inflation (purple line) suggest that overall rent inflation as measured in the CPI should continue to ease in the coming months, helping to further reduce overall inflation.
Nonofficial Data Also Suggest the Labor Market Remains Healthy

Notes: The level of activity (blue line) is taken from the Kansas City Fed’s Labor Market Conditions Indicators (LMCI) and is based on data from 24 labor market variables. Of these 24 variables, 16 are official (for example, the unemployment rate), while eight are nonofficial (for example, the percentage of firms planning to increase employment as reported by the National Federation of Independent Business). Thus, the level of activity excluding official data (purple line) only uses information from the latter group.
Sources: Federal Reserve Bank of Kansas City and author’s calculations.
The unique economic circumstances following the pandemic have raised questions over the accuracy of official statistics and their utility in assessing the health of the labor market. For example, the survey used to calculate payroll growth may not fully capture the post-pandemic rise in new establishments given the lag between a firm’s birth and when it is surveyed. This chart shows that after excluding all official data from the Kansas City Fed’s Labor Market Conditions Indicators (LMCI), the level of activity (purple line), a broad measure of current conditions, still remains above historical norms—suggesting a healthy labor market.
Growth in Farmland Values Has Slowed Amid Higher Interest and Lower Capitalization Rates
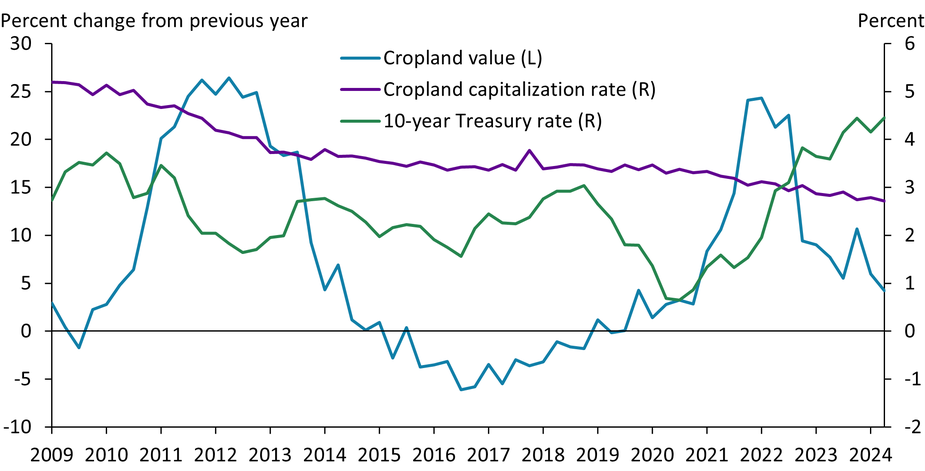
Notes: Percent changes in cropland values (nonirrigated) are calculated using responses from banks reporting in both the past and the current quarters. The capitalization rate is the ratio of cash rents for nonirrigated cropland divided by values for nonirrigated cropland. Capitalization rates approximate the annual rate of return a buyer or investor expects to receive on farm real estate; lower capitalization rates imply, from an investment perspective, that landowners are receiving lower returns on capital invested in farmland. The 10-year Treasury rate is one example of a risk-free rate of return on a longer-term investment.
Sources: Federal Reserve Bank of Kansas City, Board of Governors of the Federal Reserve System (FRED), and author’s calculations.
Farmland values have continued to grow despite higher interest rates and lower crop prices, but the rate of growth has declined (blue line) and may continue to fall. Over the past two years, risk-free rates of return (green line) have increased with interest rates and outpaced capitalization rates, or returns on farmland (purple line). This trend is a reversal from 2020, when capitalization rates were higher than returns on other investments and supported strong growth in cropland values in 2021 and 2022. The growing divergence between returns on farmland and other investments has contributed to reduced growth in farmland values.
Recent Employment Gains in Healthcare and Social Assistance Reflect Slowing Turnover
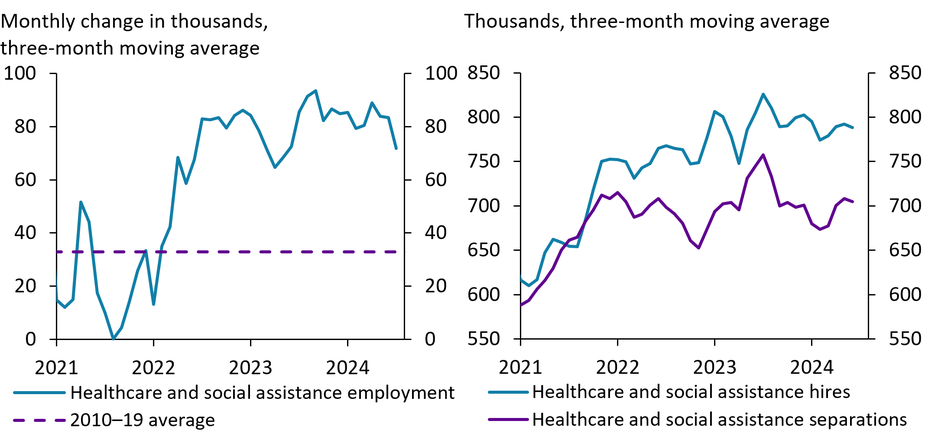
Source: U.S. Bureau of Labor Statistics (Haver Analytics).
Employment growth in the healthcare and social assistance sector accelerated rapidly in 2022 (left panel, blue line) and has been at about twice its pre-pandemic level (dashed purple line) for the last year. However, decomposing these employment gains into hires (right panel, blue line) and separations (purple line) shows that both peaked in mid-2023 and have since come down. Employment growth has remained strong because of fewer separations—with fewer people leaving their jobs, less hiring is needed to maintain growth. Slowing turnover could indicate easing labor market tightness, which could reduce wage pressures for the sector.
Monetary Policies in Advanced Economies Have Diverged, but the Spread Is Not Expected to Grow
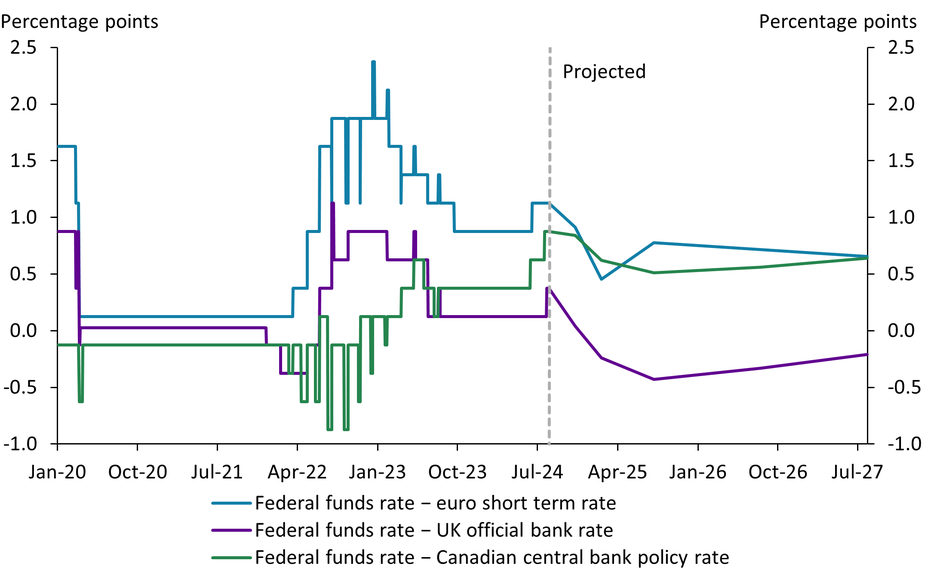
Notes: This chart depicts the rate differential between the federal funds rate and the euro short-term rate (light blue), the UK official bank rate (purple) and the Canadian central bank policy rate (green). After July 2024, these rate differentials are projected forward using futures contracts.
Sources: Bank for International Settlements (Haver Analytics), Board of Governors of the Federal Reserve System, Bank of Canada, Bank of England, European Central Bank (Bloomberg), and authors’ calculations.
The varying pace at which central banks in advanced economies are expected to end their post-pandemic tightening cycles has engendered discussion of monetary policy divergence, which may have implications for global capital allocation. However, market-based forecasts of future policy rates suggest that the current interest rate differential is expected to remain largely stable over the next two years.
Recent Slowdown in Immigrant Labor Market Integration Indicates Shifting Labor Market Dynamics
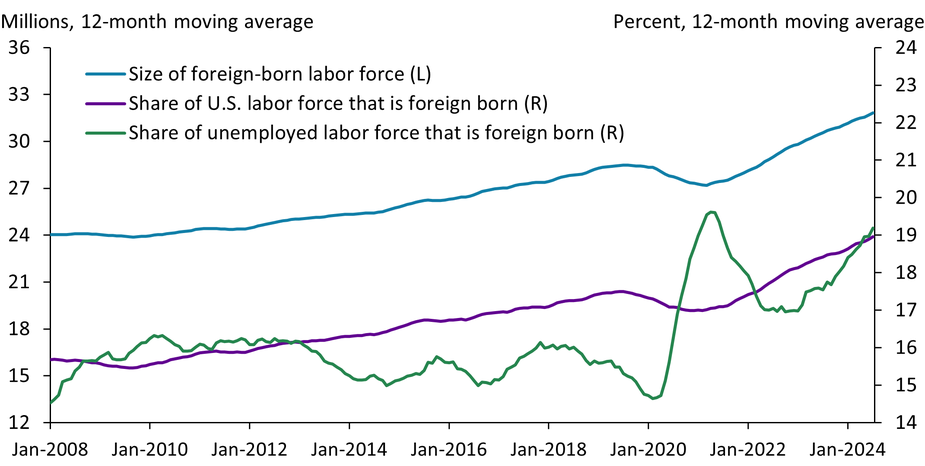
Sources: U.S. Bureau of Labor Statistics (Haver Analytics) and author’s calculations.
The post-pandemic immigration surge has rapidly increased the number of foreign-born individuals in the U.S. labor force (blue line), with foreign-born workers now making up about 19 percent of the labor force (purple line). Since 2007, the share of unemployed U.S. workers who are foreign born (green line) was mostly lower than foreign-born workers’ share in the labor force, indicating that new immigrants had been successfully absorbed into the labor market. The only exceptions to this pattern were after the global financial crisis and during the pandemic. Recently, the share of unemployed workers who are foreign born exceeded the foreign-born share of the labor force. This shift suggests the market’s capacity to absorb new immigrants may have diminished compared with the pandemic recovery period.
Wage Growth Is Cooling, but How Much Depends on the Measure
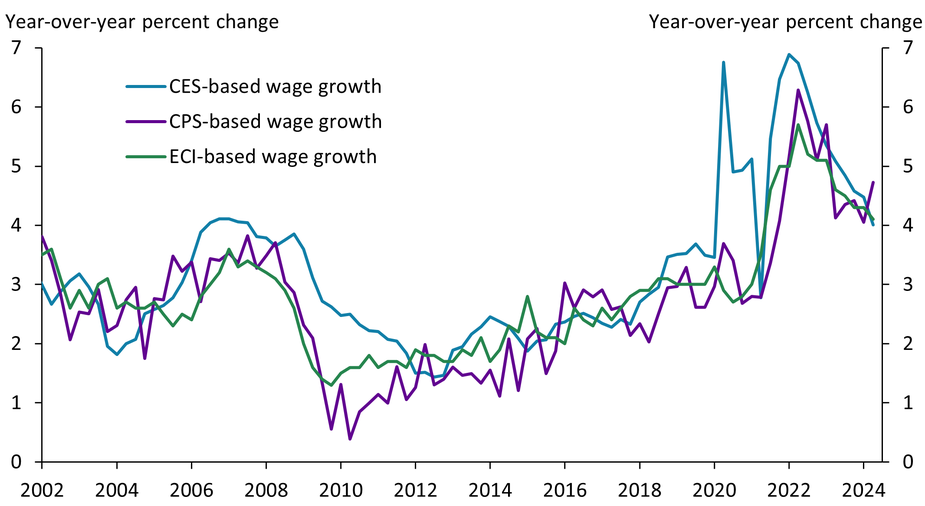
Notes: Current Employment Statistics (CES) wage growth is based on average hourly earnings (AHE) for production and nonsupervisory employees as reported in the establishment survey. Current Population Survey (CPS) wage growth is the trimmed mean (excluding the bottom 20th and top 25th percentile) change in wages reported by individuals in the household survey, similar to the Atlanta Fed Wage Growth Tracker. Employment Cost Index (ECI) wage growth is based on wages and salaries for private-industry workers from the National Compensation Survey. All measures are quarterly and reflect the percent change compared with the same quarter a year ago.
Sources: U.S. Bureau of Labor Statistics, U.S. Census Bureau, and authors’ calculations.
Several measures indicate wage growth is easing. The often-cited CES measure, which is based on firm payrolls, has fallen by nearly 3 percentage points from its recent peak (blue line). This decline is over a percentage point more than the declines in the CPS measure (purple line), which adjusts for worker composition, and the ECI measure (green line), which accounts for both industry and occupation shifts over time. Differences across these measures suggest that ignoring changes in the composition of workers and industries may overstate how much wage growth has cooled and how quickly it returns to pre-pandemic levels.
Fed’s Treasury Portfolio Is Weighted Toward Long-Maturity Assets
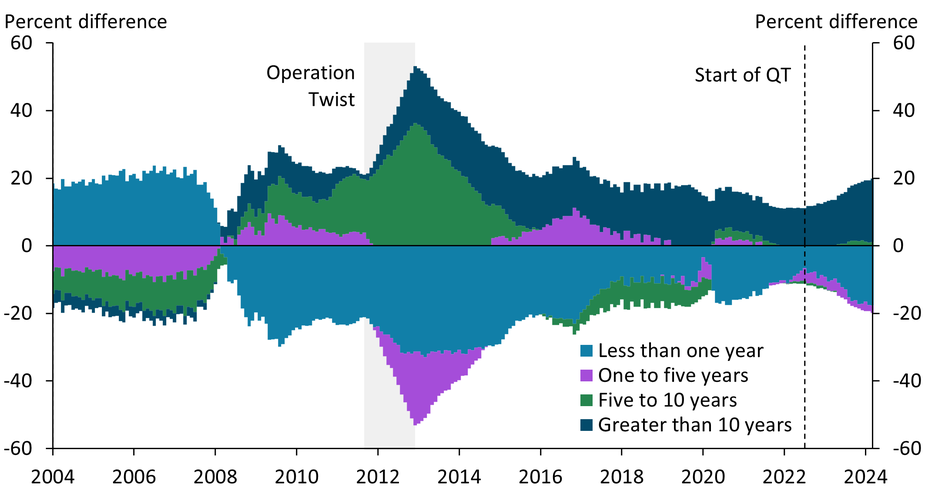
Note: Chart shows shares of Treasury securities held in the Federal Reserve’s SOMA portfolio by remaining maturity relative to those held by the private sector (outside the government and central bank).
Sources: U.S. Treasury and Federal Reserve Bank of New York (both accessed via Haver Analytics); authors’ calculations.
After the global financial crisis, large-scale asset purchases and the maturity extension program (Operation Twist) transformed the Federal Reserve’s Treasury portfolio, increasing its share of long-maturity Treasury securities relative to those held privately. Since June 2022, the Federal Reserve has conducted quantitative tightening (QT) to shrink its balance sheet by allowing Treasury securities to run off as they mature. Because only soon-to-mature assets are running off the Fed’s balance sheet, the Fed holds a portfolio that remains overweight in long-maturity assets relative to private Treasury holdings (dark blue and green areas) and underweight in short-maturity assets (light blue area).
Prices for Starter Homes Have Outpaced Larger Homes Since 2022
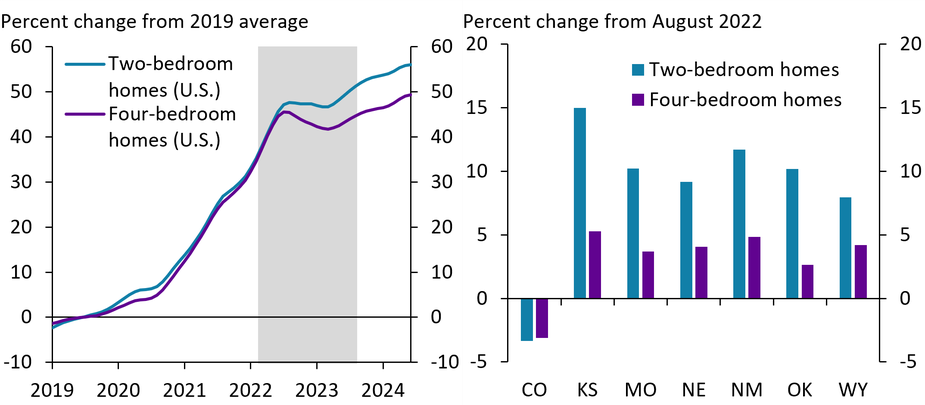
Notes: Gray bar on left chart indicates period in which the FOMC was increasing the federal funds rate. Right chart shows the change from August 2022 to June 2024.
Source: Zillow (Haver Analytics).
Throughout the pandemic, home prices for two-bedroom starter homes (blue line) and larger, four-bedroom homes (purple line) increased in tandem and at a rapid pace, rising approximately 33 percent between 2019 and 2022 nationally (left chart). After the FOMC began increasing interest rates in March 2022 (gray shading), the pace of home price gains slowed, and starter home prices began to outpace prices of larger homes. In the Tenth Federal Reserve District, the increase in starter home prices (blue bars) was especially apparent in all states except Colorado—increasing by an average of nearly 11 percent since August 2022 compared with an average increase of just 4 percent for larger homes.
Path of the Recent Inflation Surge in the United States Is Similar to Historical Path in Several Advanced Economies, but Wage Growth Has Been More Elevated
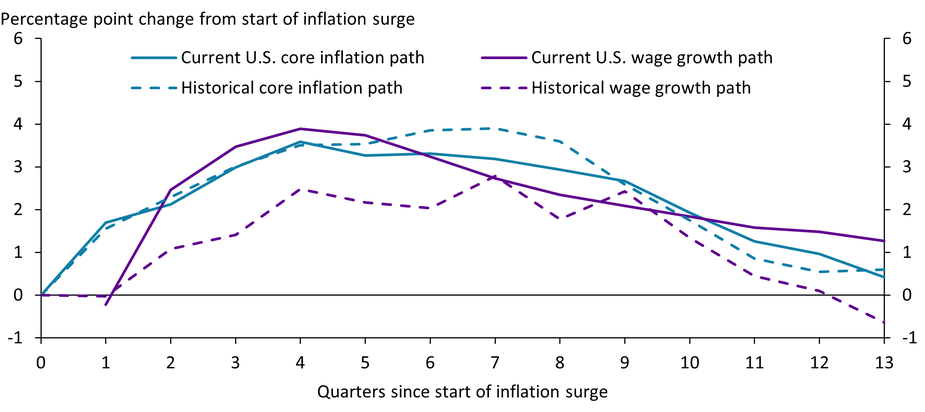
Notes: The solid lines indicate the current path of core PCE inflation and average hourly earnings growth in the United States. The dashed lines show average inflation and wage growth during historic inflation surges across 10 advanced economies. Quarter 0 indicates the start of an inflation surge. The dates for the historic inflation cycles are obtained from Blanco, Ottonello, and Ranosova (External Link2022). Included countries: Austria, Canada, Israel, Italy, Japan, the Netherlands, Slovakia, Sweden, United Kingdom, and United States. The current cycle starts in 2021:Q1.
Sources: International Monetary Fund; Blanco, Ottonello, and Ranosova (External Link2022); Organisation for Economic Co-operation and Development; U.S. Bureau of Economic Analysis (Haver Analytics); U.S. Bureau of Labor Statistics (Haver Analytics); and authors’ calculations.
The path for core inflation during the recent inflation surge in the United States is remarkably similar to the average historical path across 10 advanced economies including the United States (blue lines). However, the current path for wage growth is more elevated than the historical path due to outsized imbalances in the U.S. labor market over the past two years (purple lines). Historically, wage growth tends to accelerate during inflation surges but eventually eases as inflation subsides. This time, U.S. wage growth is more elevated, which suggests that it might take some time before wage growth reaches levels seen prior to the pandemic.
Tenth District Labor Markets Still Historically Tight as U.S. Labor Market Returns to Balance
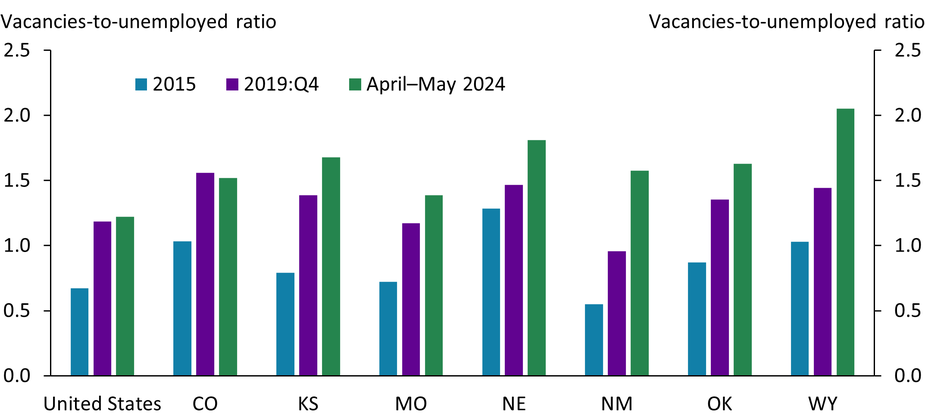
Sources: U.S. Bureau of Labor Statistics (Haver Analytics) and author’s calculations.
Labor market tightness, as measured by the ratio of job vacancies to the number of unemployed (or V/U ratio), is nearing pre-pandemic levels for the United States as a whole (green and purple bars on left side of chart). However, with the exception of Colorado, employers in Tenth District states (those states included in the chart) may still encounter difficulty hiring as V/U ratios remain elevated. In addition, V/U ratios in 2019 exceeded ratios from earlier in the previous expansion (blue bars), suggesting that even at pre-pandemic levels, labor markets may remain tight.
Historical Data Highlight the Relatively Modest Pace of Recent Unemployment Rate Increases
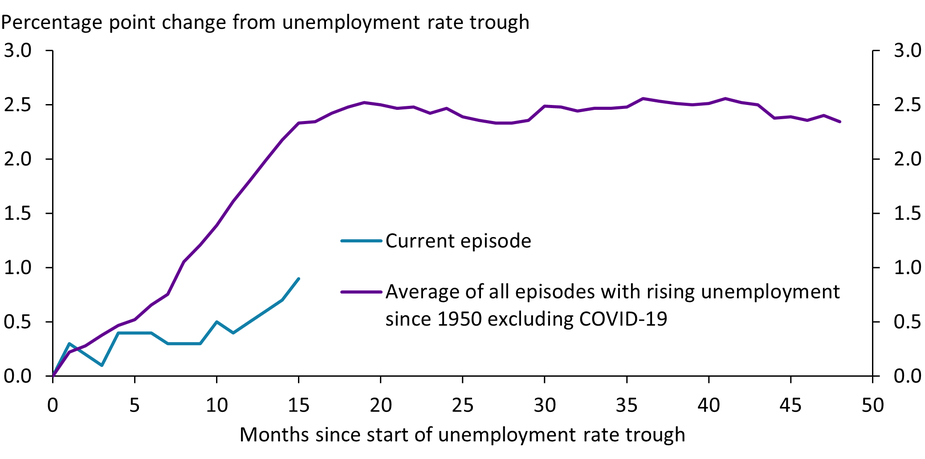
Notes: To define an episode of rising unemployment, we first identify periods where the unemployment rate rose at least 0.5 percentage points over a 12-month period. We then set the start of the episode as the low point, or trough, before this rise.
Sources: U.S. Bureau of Labor Statistics (Haver Analytics) and authors’ calculations.
Over the last 15 months, the unemployment rate has risen 0.9 percentage points (blue line), from a trough of 3.4 percent in April 2023 to 4.3 percent in July 2024. For comparison, we plot the average path of historical episodes of increasing unemployment rates using data since 1950 (purple line). Historically, the unemployment rate first gradually increases before suddenly picking up. Thereafter, it remains elevated. Despite a 0.2 percentage point increase in July 2024, the unemployment rate has so far increased by considerably less than previous episodes amid a strong labor market and resilient consumer demand.
Farm Loan Demand Is Likely to Grow in Response to Lower Liquidity and Higher Operating Expenses
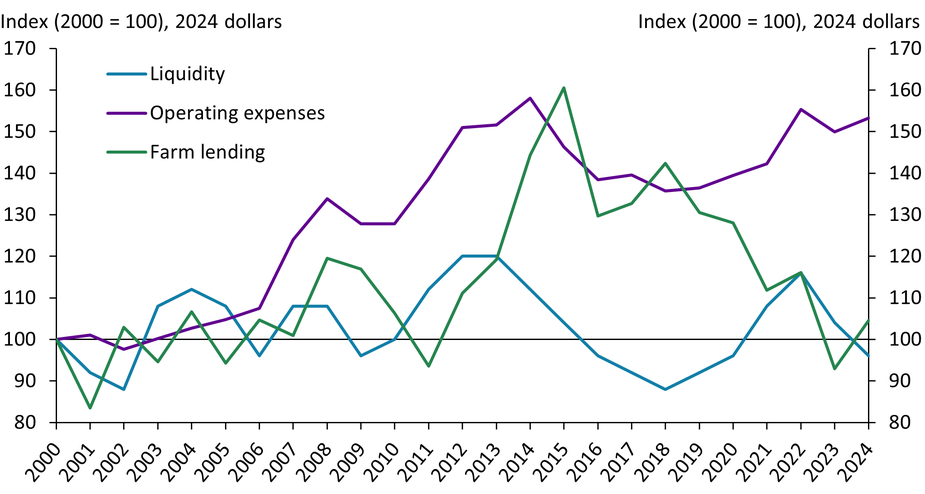
Notes: Farm sector liquidity is plotted using an inverted debt service ratio, so that a lower debt service ratio in the chart indicates lower liquidity. Operating expenses are total U.S. farm sector production expenses less interest expenses and capital expenditures. Farm lending plots the average annual volume of loans for current operating expenses and livestock loans estimated in the Survey of Terms of Lending to Farmers.
Sources: USDA, U.S. Bureau of Economic Analysis (Haver Analytics), Federal Reserve Bank of Kansas City, and author’s calculations.
Elevated operating expenses (purple line) and lower farm sector liquidity (blue line) could put additional upward pressure on demand for non-real-estate agricultural loans (green line). Considerable strength in farm income during 2021 and 2022 bolstered liquidity and reduced lending activity. Since then, farm income and working capital have moderated alongside lower crop prices and firm production costs, and liquidity has fallen. Farm lending activity at commercial banks increased in early 2024 but remained subdued relative to operating expenses. Further depletion in liquidity is likely to increase financing needs and push up interest costs for agricultural borrowers.
Elevated Multifamily Housing Completions Are Likely to Increase the Multifamily Unit Vacancy Rate
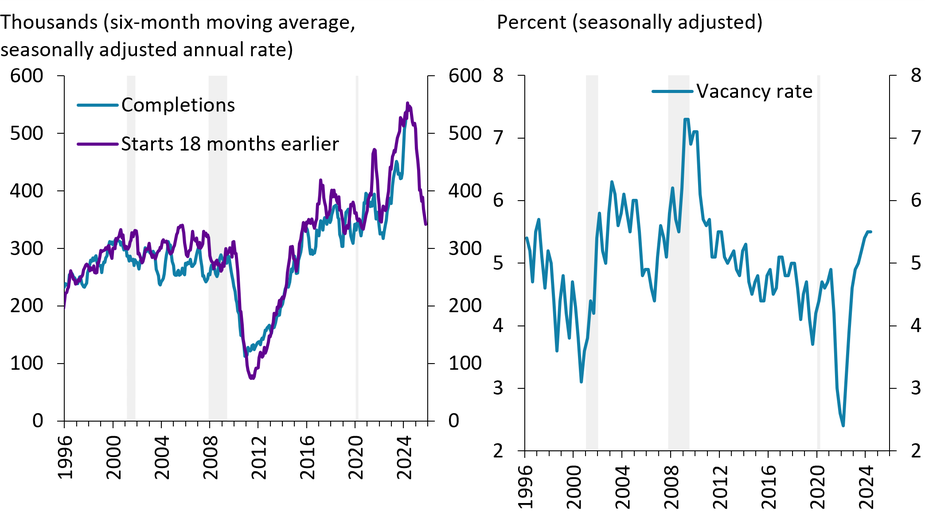
Notes: Left chart plots the annual rate of completions of multifamily housing units through May 2024 and the rate of multifamily housing starts 18 months earlier, both measured as a six-month moving average. The right chart measures the national vacancy rate for multifamily units through 2024:Q2. Gray shading depicts National Bureau of Economic Research (NBER)-defined recessions.
Sources: U.S. Census Bureau and NBER (both accessed via Haver Analytics) and CBRE Econometric Advisors.
The annual rate of multifamily construction completions—the number of units in new apartment buildings—was the highest in more than 25 years in May 2024, measured as a six-month moving average (left chart, blue line). The rate of multifamily housing starts 18 months earlier (purple line), a good predictor of completions, suggests that over the next year, multifamily completions will decline from peak levels but likely remain above their average over the past 10 years. Elevated completions are likely to push up the vacancy rate for rented units in multifamily buildings, which is already at its highest level in almost 15 years (right chart).
Fiscal Boosts to Manufacturing Mask a More Substantial Slowdown in Business Investment Growth

Notes: Chart shows growth in real terms. BFI is business fixed investment.
Sources: U.S. Bureau of Economic Analysis and authors’ calculations.
Investment in manufacturing structures (solid purple bars) typically represents a small fraction of overall business fixed investment (BFI) growth (dark blue line). Following the passage of the Inflation Reduction and CHIPS acts in 2022, however, the sector saw a surge in contributions due at least in part to the influx of federal fiscal support. In 2023, manufacturing structures contributed an unprecedented 2.7 percentage points to BFI growth, the highest level in decades. This unusually high investment in manufacturing structures masks a more substantial slowdown in BFI growth. When manufacturing structures is excluded (light blue line), BFI growth slows significantly over the past two years.
In 2020–23, Non-Metropolitan Counties in the Tenth District Experienced Net Inflows of New Residents for the First Time in Two Decades

Notes: Net domestic migration includes only migration from one state to another. The Tenth Federal Reserve District encompasses the western third of Missouri, the northern half of New Mexico, and all of Colorado, Kansas, Nebraska, Oklahoma, and Wyoming.
Sources: U.S. Census Bureau and authors’ calculations.
During the first two decades of this century, most non-metropolitan counties in the Tenth Federal Reserve District lost residents to other states on net, as shown by the blue shading on the left-side map. Since 2020, however, these counties in aggregate have gained residents from other states, with a majority of Tenth District non-metropolitan counties adding more residents than they lost, as shown by the purple shading on the right-side map.
Profits’ Contribution to Inflation in 2023 Remained within Historical Range for Pre-Pandemic Recoveries
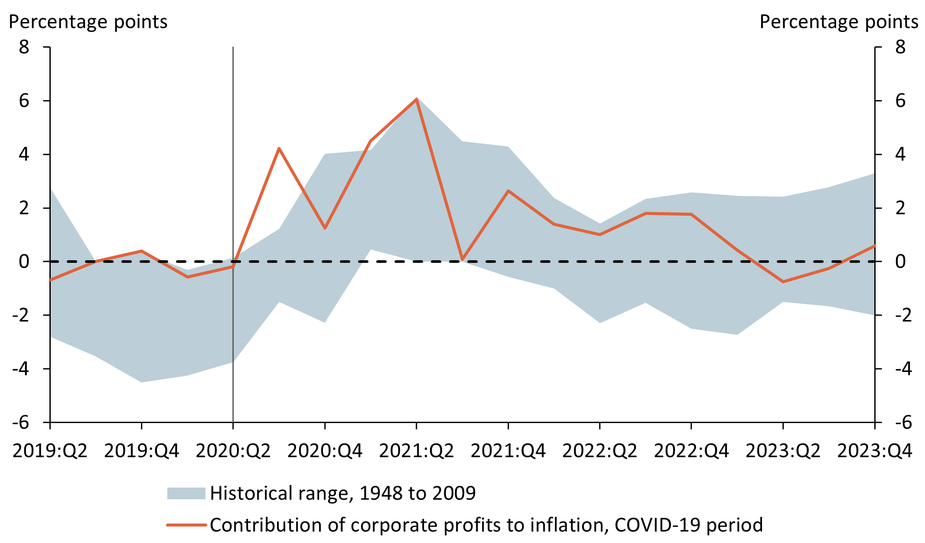
Note: The blue shaded region shows the range of contributions to inflation from corporate profits seen in the four quarters before and 13 quarters after the beginning of pre-pandemic recoveries.
Sources: U.S. Bureau of Economic Analysis and authors’ calculations.
Profits of nonfinancial corporate firms made an atypically high contribution to inflation early in the COVID-19 recovery (orange line), rising outside the historical range for recoveries (blue shaded region). However, since 2021:Q2, the contribution from corporate profits has been within a range consistent with pre-pandemic recoveries. This pattern reflects firms raising prices in anticipation of higher costs in 2021, and higher costs being realized in 2022 and 2023, as argued in Glover, Mustre-del-Río, and Nichols (2023).
Sales Listings of Existing Single-Family Homes Are Rising
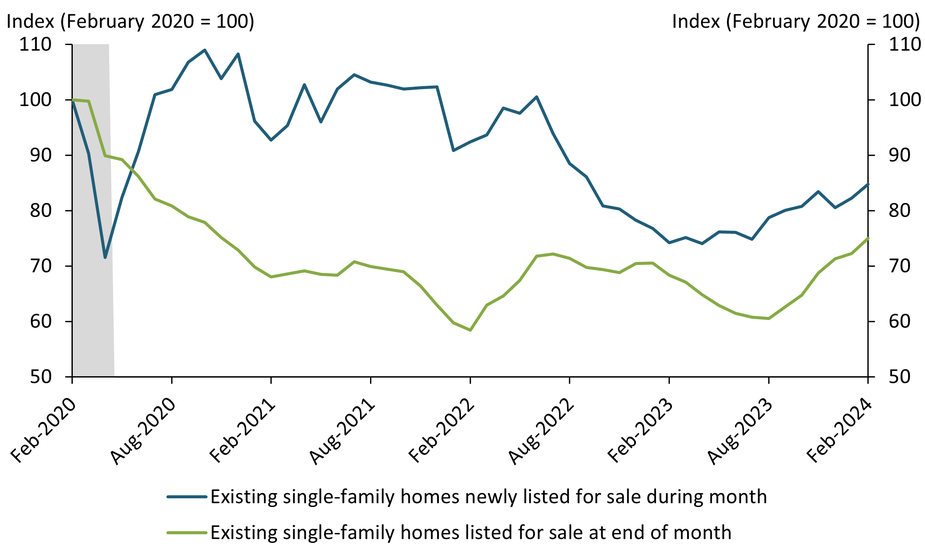
Notes: Gray shading depicts National Bureau of Economic Research (NBER)-defined recession. Data extend through February 2024.
Sources: National Association of Realtors and Redfin (both accessed via Haver Analytics).
The number of homeowners newly listing their home for sale each month has been moving up steadily since July 2023 (blue line), following its sharp move downward during the preceding two years. Similarly, the total number of existing single-family homes listed for sale, both newly listed and previously listed, has been moving up steadily since August (green line), reaching its highest level in more than three years in February 2024. The increase in new listings is boosting sales of existing single-family homes, including large increases in January and February (not shown).
Community Banks Provide Critical Financial Services across the Nation
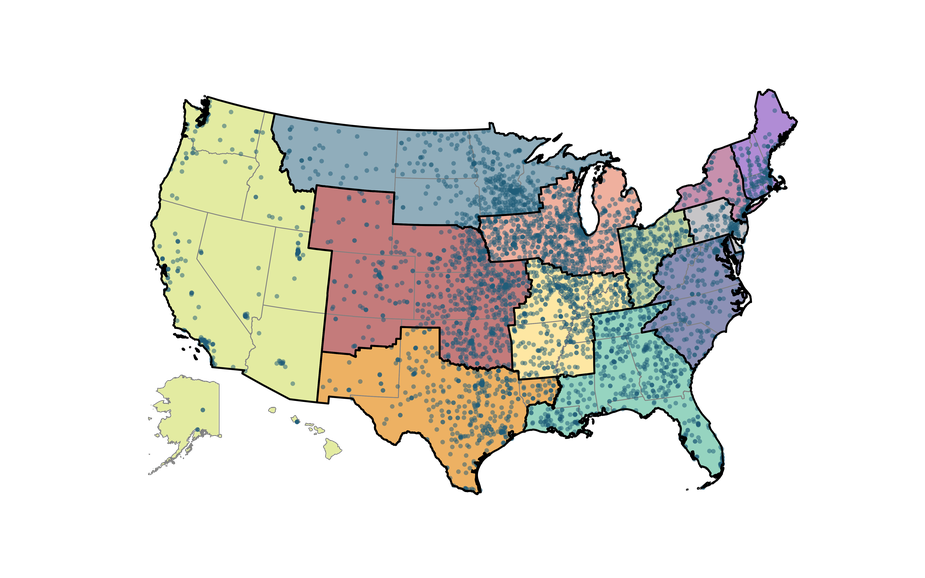
Notes: Each dot denotes the headquarters of a community bank or thrift, defined as a depository institution with total consolidated organization assets of less than $10 billion. Colored regions denote the geographic boundaries of each of the 12 Federal Reserve Districts.
Sources: FFIEC, National Information Center, and Federal Reserve Bank of Kansas City.
Community banks, often defined as banks with less than $10 billion in assets, are integral to the U.S. financial system due to their nationwide presence. Additionally, these smaller banks are usually headquartered within their markets, and many community bankers engage in civic activities. For these reasons, community banks help make up the fabric of their communities. Perhaps most importantly, community banks play an outsized role in many rural or otherwise underserved areas. In fact, the Midwest has a large share of community banks, and nearly 700 are in the Kansas City Fed’s Tenth District (red area).
Labor Markets in Interest-Rate-Insensitive Industries Appear to Be Responding to Monetary Policy Tightening
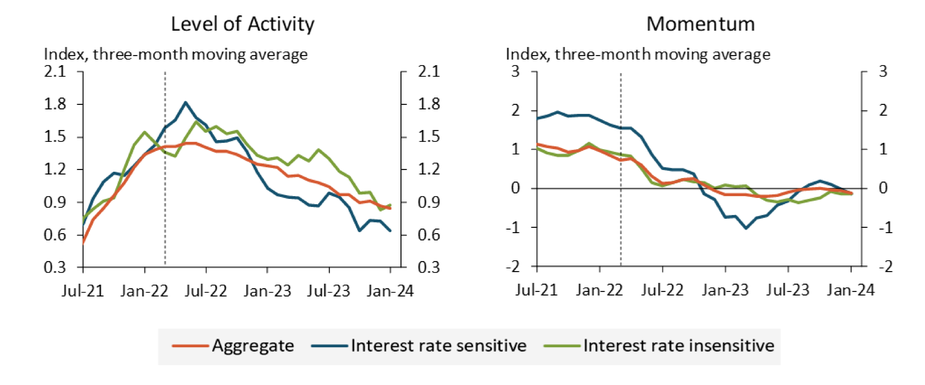
Notes: All series have a mean of zero over the period January 1992 through January 2024. The y-axis unit is standard deviations of the aggregate LMCI series. The dashed vertical line denotes the start of monetary policy tightening in March 2022. Information on series construction and sources for model input data can be found in the data appendix of Dilts Stedman and Pollard (2023).
Sources: Dilts Stedman and Pollard (2023) and authors’ calculations.
Dilts Stedman and Pollard’s (2023) industry-level versions of the Kansas City Fed’s Labor Market Conditions Indicators (LMCI) provide evidence that labor markets in interest-rate-insensitive industries were slower to respond to monetary policy tightening during the first year of the current tightening cycle, in line with historical trends. However, labor markets in these industries now show signs of cooling, with the level of activity (a measure of labor market tightness) trending downward since June 2023. In addition, labor market momentum in interest-rate-insensitive industries turned negative in March 2023, even falling below interest-rate-sensitive momentum during the second half of 2023, a sign of softening labor market conditions.
Labor Market Tightness, Though Elevated, Is Not Far above Pre-Pandemic Levels
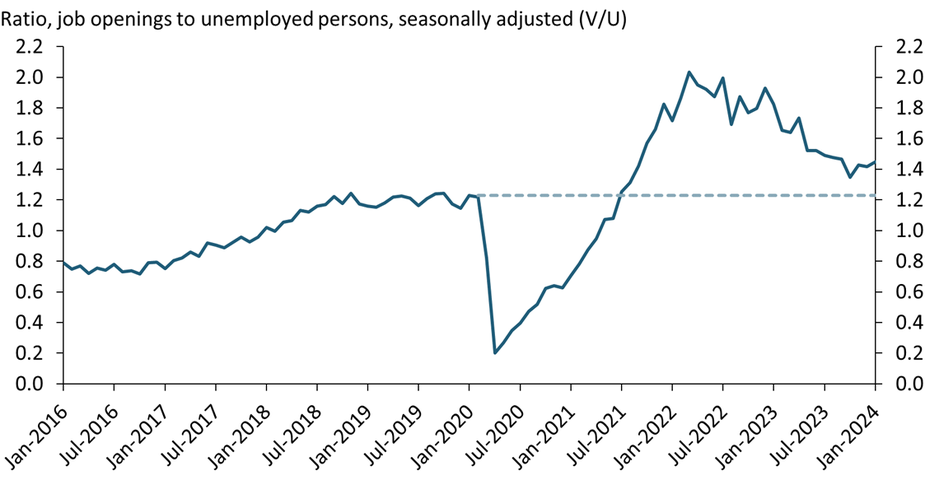
Note: Data series extends through January 2024.
Sources: U.S. Bureau of Labor Statistics (Haver Analytics) and authors’ calculations.
Download the data file for this chart. (Updated through February 2025)
A closely monitored measure of labor market tightness is the ratio of job openings to unemployed persons, or the V/U ratio. As shown in the chart, after rising sharply during the pandemic, the V/U ratio has declined considerably from its peak in early 2022. Currently, the V/U ratio has been oscillating around 1.4 (implying 1.4 job openings per unemployed worker), above but not far from its pre-pandemic level of 1.2 (represented by the dashed line).
U.S. Oil Production Has Had a Remarkable Record of Consistently Beating Expectations
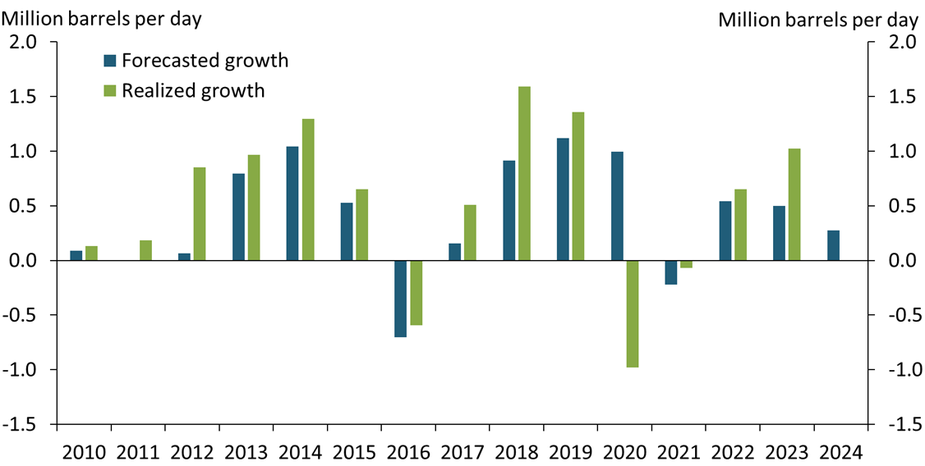
Notes: Chart presents change in average annual U.S. oil production. Forecasts are based on each year’s January Short-Term Energy Outlook (STEO). Realized growth is not yet available for 2024.
Sources: U.S. Energy Information Administration and authors’ calculations.
Over the past 14 years, U.S. oil production growth (green bars) has consistently outpaced expectations (blue bars), driven by both price and productivity surprises. U.S. oil output hit all-time highs following strong growth that exceeded expectations in the 2010s and a rapid recovery in production post-pandemic. However, recent industry trends appear to be shifting. With reduced drilling activity and a move toward industry consolidation, we may see a more measured approach to expansion, likely leading to a more predictable, though cautious, future growth trajectory.
Supercore PCE Inflation Surged in January to Its Highest Monthly Level in More than Two Years
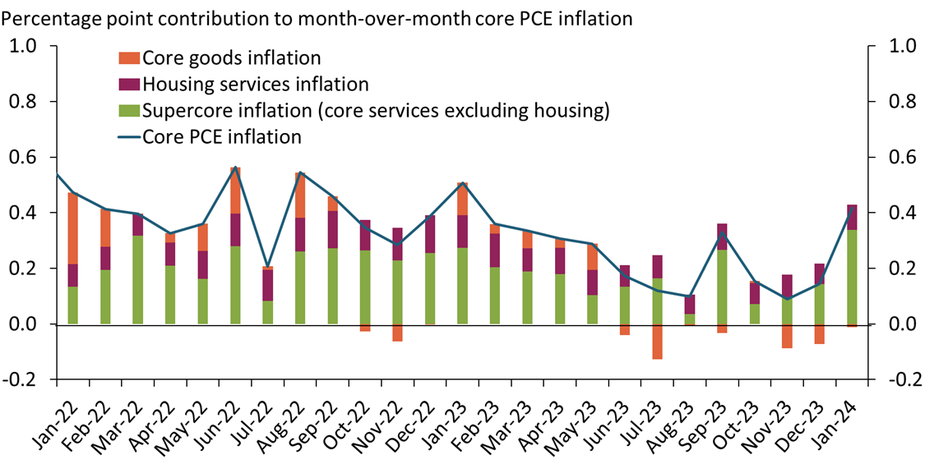
Sources: U.S. Bureau of Economic Analysis (Haver Analytics) and authors’ calculations.
Download the data file for this chart. (Updated through February 2025.)
Supercore prices—the prices of core services excluding housing—as measured by the Personal Consumption Expenditure (PCE) price index jumped by 0.6 percent from December 2023 to January 2024, the largest monthly increase in more than two years. As supercore expenditures account for more than half the weight of the PCE core bundle, the contribution from the surge in supercore inflation (green bars) drove monthly core PCE inflation up to its highest level since January 2023.
Single-Family Home Permits Moved Up for the 12th Consecutive Month in January
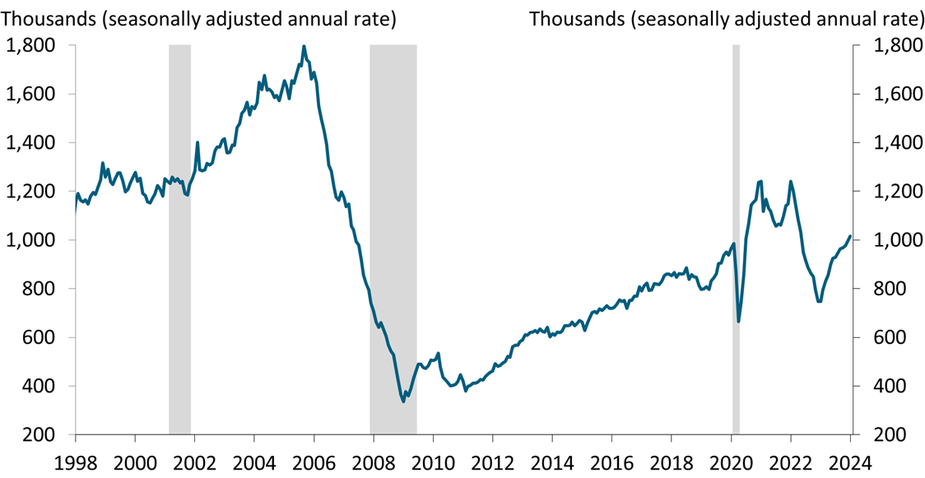
Notes: Gray shading depicts National Bureau of Economic Research (NBER)-defined recession. Data series extends through January 2024.
Sources: U.S. Census Bureau (Haver Analytics) and NBER.
Single-family home permits moved up for the 12th consecutive month in January 2024, cumulatively increasing 36 percent from a trough one year earlier. The number of single-family home permits in January—1.02 million at an annual rate—was modestly above its level just prior to the pandemic in February 2020 but well below its average during 2021. With home prices at a historic high, single-family home construction is likely to continue to move up throughout 2024.
Supercore Inflation Jumped in January, Suggesting Continuing Inflation Pressures
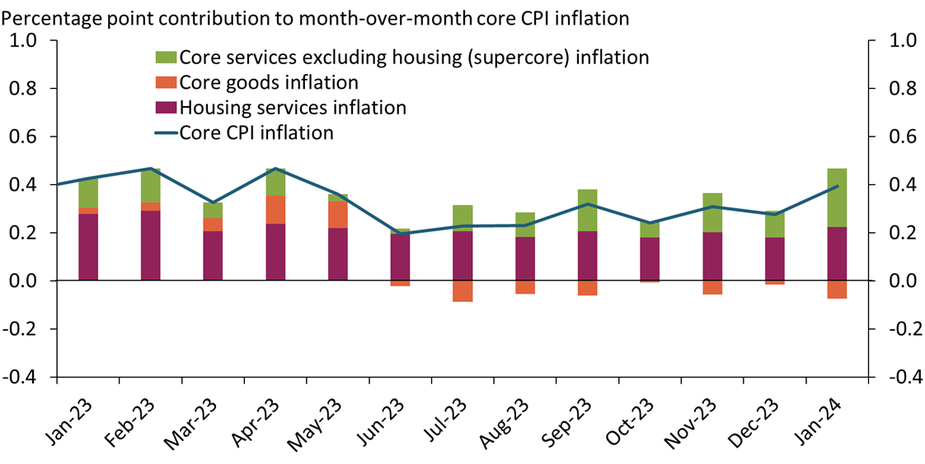
Sources: U.S. Bureau of Labor Statistics (Haver Analytics) and authors’ calculations.
Download the data file for this chart. (Updated through February 2025.)
Inflation from core services excluding housing—or “supercore” inflation—increased in January, contributing 0.24 percentage points to core Consumer Price Index (CPI) inflation, up from 0.11 percentage points in December (green bars). Of the three primary components of core CPI inflation—core goods, housing services, and supercore—supercore inflation is the most labor intensive and therefore especially sensitive to nominal wage increases. Although nominal wage increases moderated during 2023, they remain above their pre-pandemic levels, continuing to put upward pressure on supercore inflation.
Note: This chart replaces an earlier version to correct the calculation of supercore inflation.
KC Fed's LMCI Suggests the Pre-Pandemic Relationship between Labor Market Variables Has Been Restored
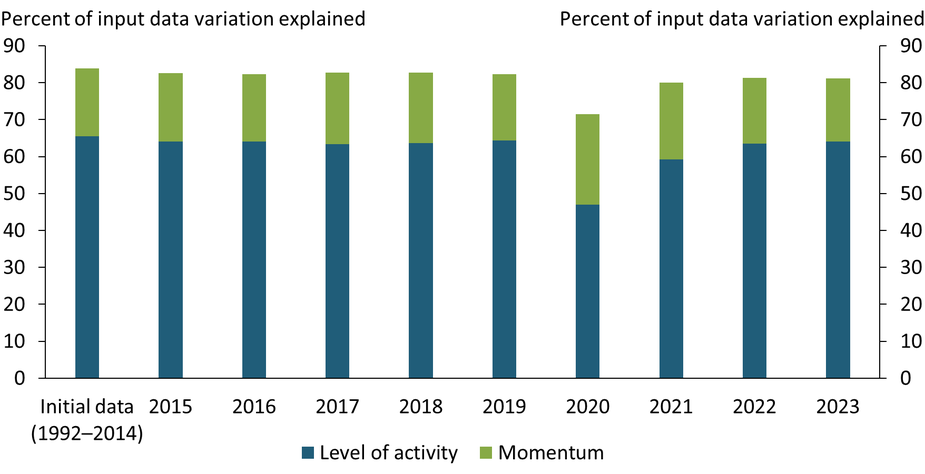
Notes: Chart shows how much of the variance in the LMCI input data is explained by the level of activity and how much by the momentum series. As a baseline, we calculate the explained variance from 1992 to 2014, the period used for the LMCI’s first release. We then add each subsequent year of data to this baseline dataset separately and re-calculate the explained variance. For instance, to calculate the explained variance for 2023, we use data from January 1992 to December 2014 and January 2023 to December 2023, omitting the years in between.
Sources: Federal Reserve Bank of Kansas City and authors’ calculations.
The Kansas City Fed’s Labor Market Conditions Indicators (LMCI) summarize the information of 24 labor market variables into two measures: the level of activity and momentum. Typically, these two indicators explain about 80 percent of the variation in their input series, reflecting the well-defined and stable relationships between labor market variables. During the pandemic, these relationships were disrupted and the LMCI’s explanatory power dropped. However, by 2021 the percent of variation explained by the LMCI recovered, suggesting the labor market variables tracked by the LMCI are now behaving much as they were prior to the pandemic (albeit at much tighter levels).
Higher Interest Costs Could Dampen Demand for Farmland
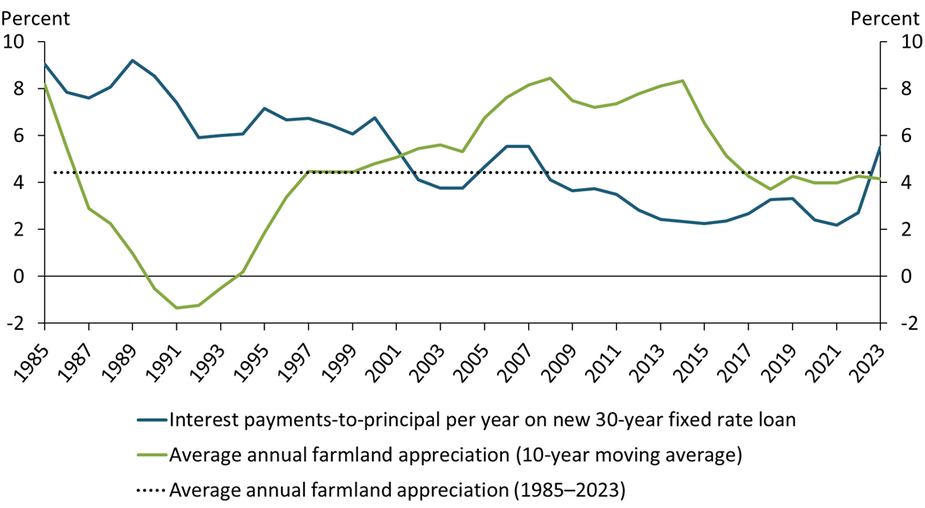
Sources: USDA, Federal Reserve Bank of Kansas City, and author’s calculations.
In 2023, interest costs on new farmland loans (blue line) surpassed the recent average annual appreciation in land values (green line) for the first time since 2001. From 2002 to 2022, growth in agricultural real estate values was well above the cost of financing, supporting demand for farmland. With interest costs now above average land value appreciation, farm operating profits will determine the magnitude of returns for financed land. Although growth in farmland values held firm in 2023, higher interest rates and a moderation in agricultural commodity prices have cut potential returns and could dampen demand for farmland—and thus farmland values—going forward.
Declining Mergers and Acquisitions Activity Could Portend Lower Investment
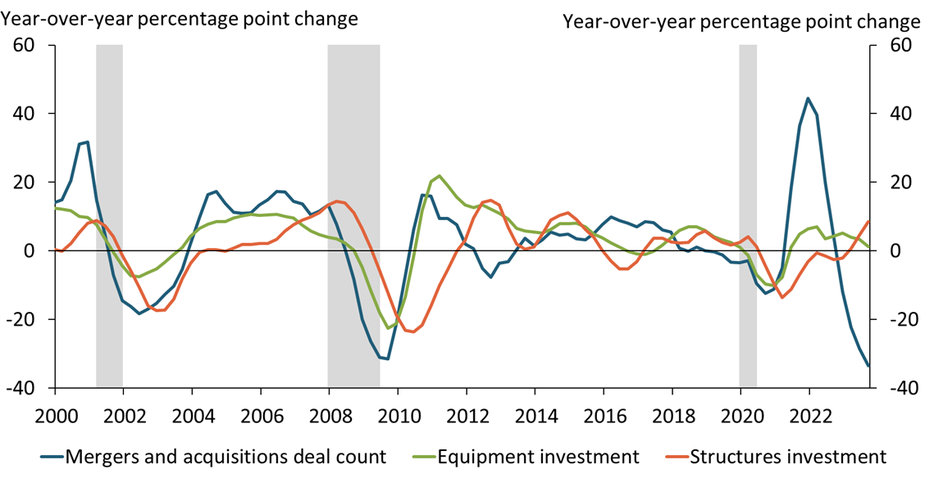
Notes: Gray bars denote National Bureau of Economic Research (NBER)-defined recessions at a quarterly frequency. All values taken as a year-over-year percentage point change for the four-quarter rolling average.
Sources: Bloomberg, U.S. Bureau of Economic Analysis (Haver Analytics), NBER (Haver Analytics), and authors’ calculations.
Higher interest rates and tighter financial conditions tend to slow firms’ growth and reduce mergers and acquisitions (M&A) activity. M&A deal activity (blue line) complements business fixed investments and tends to lead changes in spending on equipment (green line) and structures (orange line). The sharp decline in M&A deals in late 2022 and throughout 2023 may be a reversal of the sharp rise in M&A activity in the second half of 2021 but could also portend a decline in capital investment in the coming quarters. To learn more, see Rodziewicz and Sly (2019).
Sales Listings of Existing Single-Family Homes Have Stabilized
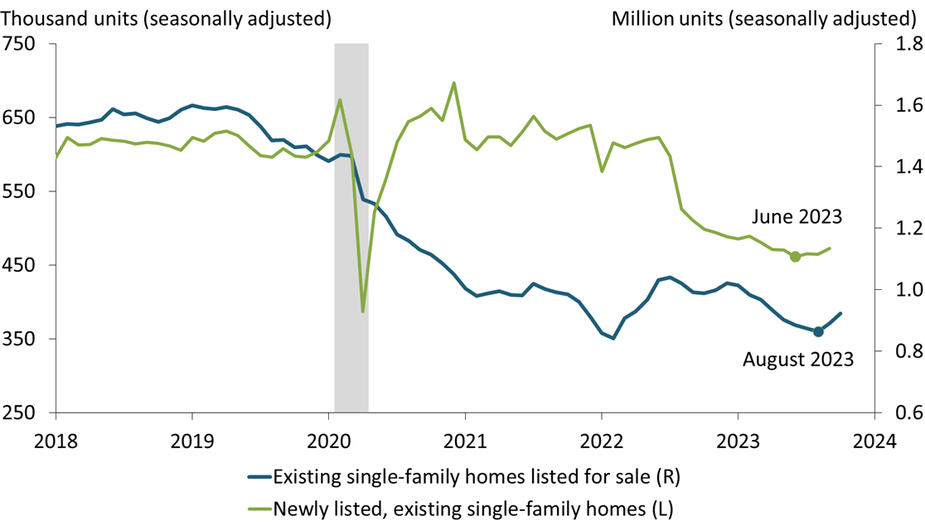
Notes: Gray shading depicts National Bureau of Economic Research (NBER)-defined recession. Newly listed data extend through September 2023; existing listings data extend through October 2023.
Sources: National Association of Realtors, Redfin, and NBER. All data sources accessed via Haver Analytics.
The number of homeowners newly listing their home for sale has inched up since June, following its sharp move downward during the previous two years (green line). Similarly, the number of existing single-family homes listed for sale, both newly listed and previously listed, has moved up since August (blue line), following 18 months of steady decline. This stabilization of both newly listed and total listings of single-family homes suggests that sales of existing single-family homes, which continue to plunge, may also stabilize soon.
Single-Family Home Permits Continue to Climb despite Faltering Builder Sentiment
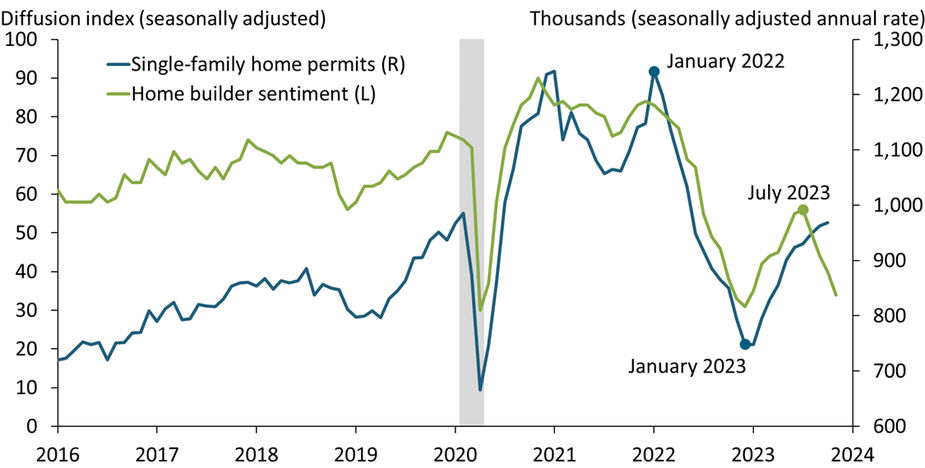
Notes: Gray shading depicts National Bureau of Economic Research (NBER)-defined recession. Permits data extend through October 2023; sentiment data extend through November 2023.
Sources: U.S. Census Bureau, National Association of Home Builders, and NBER. All data sources accessed via Haver Analytics.
The number of single-family permits increased for the ninth consecutive month in October (blue line), leaving its three-month growth rate at 17.4 percent. In contrast, home builders’ sentiment has declined sharply in recent months, with the diffusion index in November falling well into the contractionary range (green line). Builder’s negative sentiment is surprising. Homeowners are gripping their low-rate mortgages, pushing sales listings to near their historic low and sales prices to a historic high. This lock-in effect is likely to persist for some time, suggesting that home construction will remain robust rather than reversing to follow sentiment downward.
Apartment Completions Will Continue to Surge over the Next Six Months
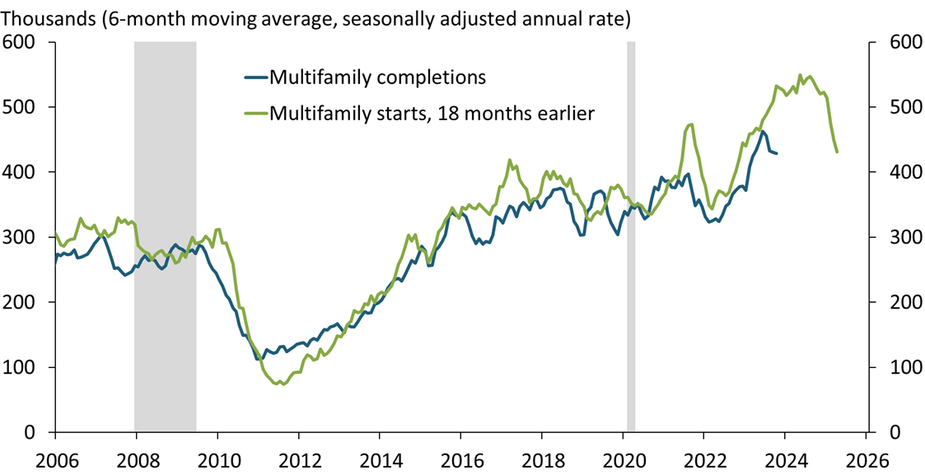
Notes: Gray shading depicts National Bureau of Economic Research (NBER)-defined recession. Data series extend through October 2023.
Sources: U.S. Census Bureau, NBER, and author’s calculations. All data sources accessed via Haver Analytics.
Builders have been completing multifamily units during 2023 at the highest rate since the mid-1980s (blue line). The time to build multifamily units has recently been averaging about 18 months, making the rate of construction starts 18 months earlier (green line) a good predictor of completions. Based on this lag, completions are likely to surge further through at least the first half of 2024. With the deluge of new apartments going on the market, multifamily vacancies have already rebounded a percentage point above their pre-pandemic rate and are likely to continue to move up, putting downward pressure on rent inflation.
Monetary Policy Takes a Long Time to Cool Labor Markets
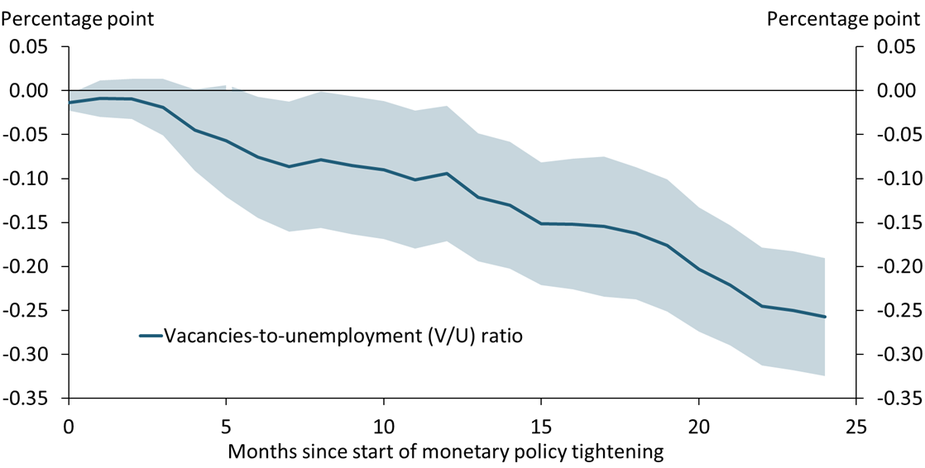
Notes: The chart shows the cumulative effect of a surprise hike in the federal funds rate, coded as a binary variable from Romer and Romer (External Link2023), on the job vacancies-to-unemployment ratio. Monetary policy surprises are narratively identified based on historical minutes and transcripts of Federal Reserve policy meetings. Shaded areas represent one-standard-error confidence bands.
Sources: U.S. Bureau of Labor Statistics (Haver Analytics), Romer and Romer (External Link2023), Barnichon (External Link2010), and author’s calculations.
Historic evidence since 1951 suggests that labor markets respond only slowly to tighter monetary policy. After a surprise hike in the federal funds rate, the vacancies-to-unemployment (V/U) ratio, a popular measure of labor market tightness, declines by an estimated 0.26 percentage points over 24 months. This slow cooling of the labor market is in line with the current tightening cycle. Since the Federal Reserve started raising the policy rate in March 2022, the V/U ratio has only declined from about 1.9 to 1.5 so far and is still well above the pre-pandemic average of about 0.8.
Work Stoppages Have an Uncertain Effect on Prices
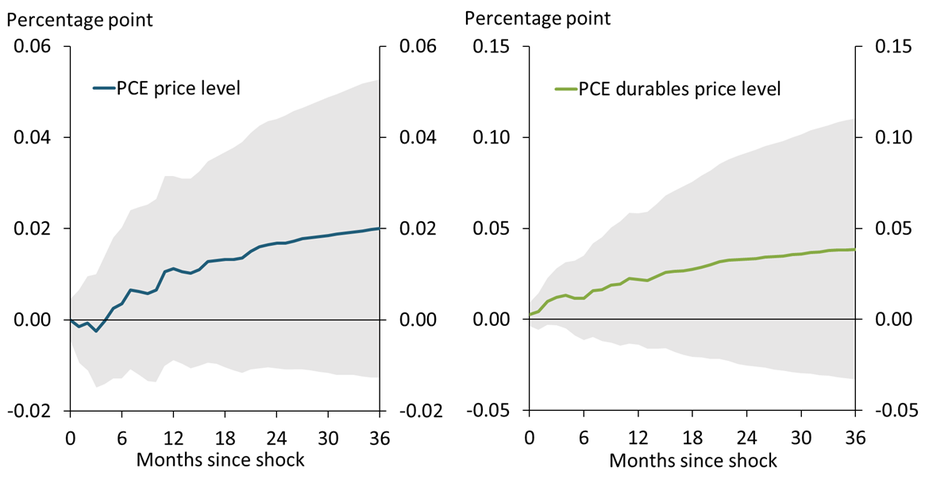
Notes: Chart shows the response of the PCE and PCE durables price indices in the 36 months following a shock to the fraction of idled workers due to work stoppages. The shock is of a magnitude reflecting 25,000 UAW workers striking during September 2023, and reflects an increase in the fraction of worker-days idled due to work stoppages beyond what would be predicted by the last 12 months of inflation, wage growth, industrial production growth, and worker-days idled due to work stoppages.
Sources: U.S. Bureau of Labor Statistics and U.S. Bureau of Economic Analysis.
When work stoppages increase the share of worker-days idled, prices go up slightly on average, especially on durable goods. A shock of the magnitude of the United Auto Workers (UAW) strike that began in September 2023 is predicted to increase the Personal Consumption Expenditures (PCE) price index by 0.02 percentage points (blue line) and the PCE price index for durables by 0.04 percentage points (green line) over the next three years. However, these estimates involve an enormous amount of uncertainty, and because the 95 percent confidence intervals (gray shading) always include zero, we cannot rule out a null effect of a strike of this size on prices.
Monthly Mortgage Payments for Homebuyers Continue to Soar
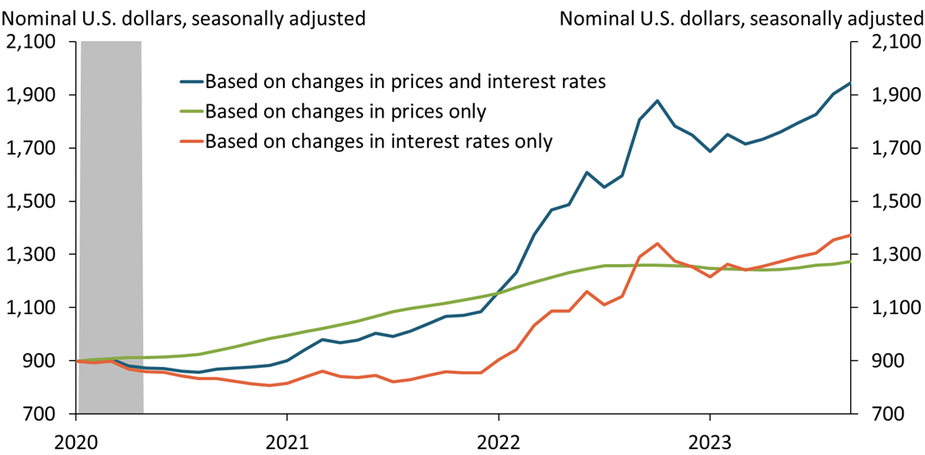
Notes: Chart plots the monthly payment to purchase a home that sold for $250,000 in January 2020, based on a 20 percent down payment and excluding monthly escrow payments, which are used to pay property taxes and homeowner’s insurance. Calculations extend through September 2023. Gray shading depicts National Bureau of Economic Research (NBER)-defined recession.
Sources: Zillow, Freddie Mac, NBER, and author’s calculations. All data sources accessed through Haver Analytics.
Rising home prices and interest rates since January 2020 have more than doubled the monthly mortgage payment required to purchase a home (blue line). In 2020–21, the increase exclusively reflected rising prices (green line). Since then, the increase has primarily reflected rising interest rates (orange line). On their own, rising interest rates have increased monthly payments by more than 60 percent since late 2021, illustrating the strong incentive for owners to remain in their current home rather than sell and purchase a different home at a similar price.
Recent Labor Force Participation Gains for Women with Young Children May Slow as Childcare Stabilization Funds Expire
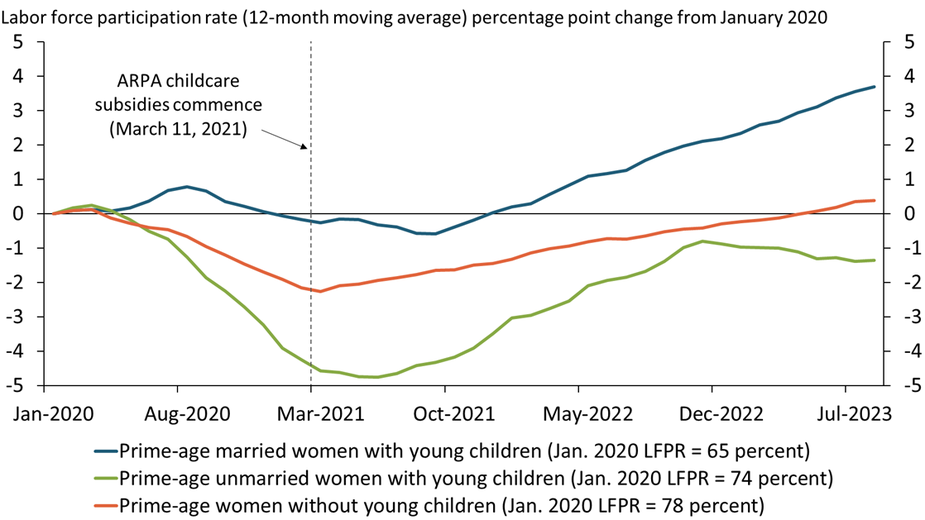
Notes: Chart plots population-weighted percentage point change in 12-month moving average labor force participation rate for each group in a given month relative to January 2020. ARPA is the American Rescue Plan Act. “Prime-age” refers to individuals age 25–54. “Young children” are children under six years old. “Married” corresponds to a married woman with a spouse present.
Sources: U.S. Census Bureau and authors’ calculations.
Labor force participation rates of women with young children (under six years old) have increased significantly since their lows during the pandemic. This rise may be partly attributed to the American Rescue Plan Act’s (ARPA) childcare stabilization funds, which offered financial assistance to daycare providers to remain operational. Childcare availability likely helped the recovery in the labor force participation rate of unmarried women with young children (green line) and supported further increases in the participation rate of married women with young children (blue line). The expiration of these funds on September 30 may limit further progress or cause a partial reversal of these gains.
Rising Labor Costs in the Healthcare Sector Are Poised to Buttress Services Inflation
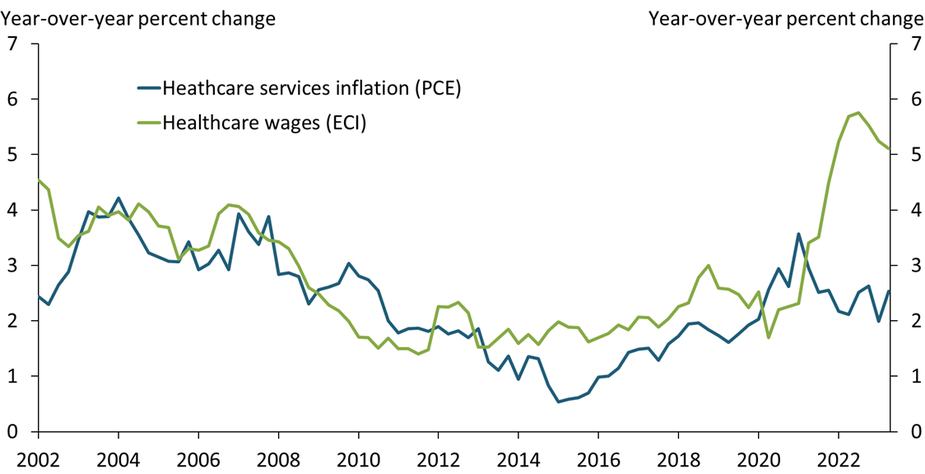
Note: PCE (Personal Consumption Expenditures Price Index) is a measure of price changes; ECI (Employment Compensation Index) is a measure of changes in employee compensation and includes employee benefits.
Sources: U.S. Bureau of Economic Analysis (BEA) and U.S. Bureau of Labor Statistics (BLS).
Historically, inflation in the healthcare sector (blue line) has been tightly linked to wage growth for healthcare workers (green line). This relationship is not surprising as healthcare is labor intensive; according to the BEA, labor accounts for more than 80 percent of output in the healthcare sector. In recent years, however, PCE healthcare services inflation has been surprisingly subdued despite significant wage pressures. Nevertheless, as higher wages have tightened margins for healthcare service providers, PCE inflation for healthcare services is likely to increase.
Sharp Gains in Drilling Productivity over the Previous Decade Have Supported U.S. Oil and Gas Production
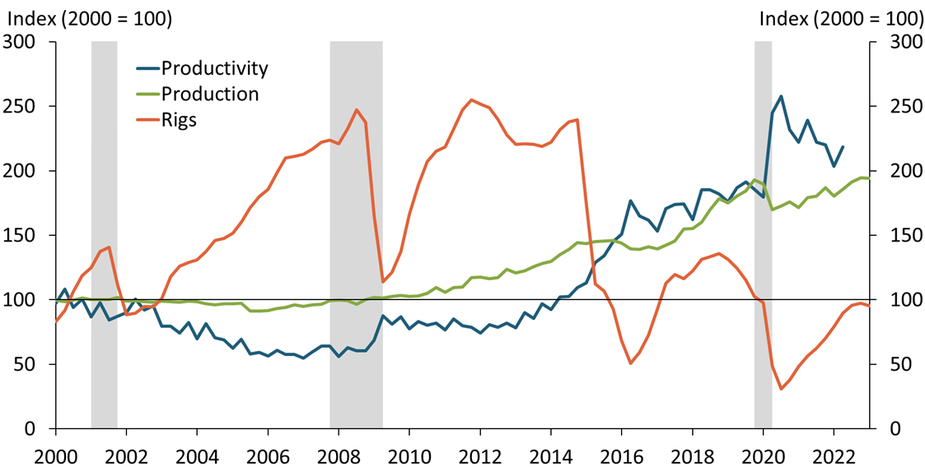
Notes: Productivity is measured as the number of barrels produced per foot of drilling. Production is measured in barrels of oil equivalent—a unit based on the approximate energy released by burning one barrel of crude oil and a way of combining both oil and gas production into a single measure. In recent years, oil and gas production has largely been driven by additional natural gas production. Gray bars denote National Bureau of Economic Research (NBER)-defined recessions.
Sources: Baker Hughes (Haver Analytics), Energy Information Administration, Enverus, NBER, and authors’ calculations.
U.S. oil and gas production has risen steadily over the past decade due in large part to increased drilling productivity. Typically, increases in production are thought to come from a higher number of active drilling rigs. However, for much of the past decade, the number of rigs (orange line) has remained below its 2000 level. Instead, the increase in production (green line) has been driven largely by improved drilling productivity (blue line). The number of barrels of oil produced per foot of drilling has more than doubled since 2014. To learn more, read our Economic Bulletin (linked below).
Improvements in Supply Chains Earlier This Year May Lead to Further Declines in Core Goods Inflation in Coming Months
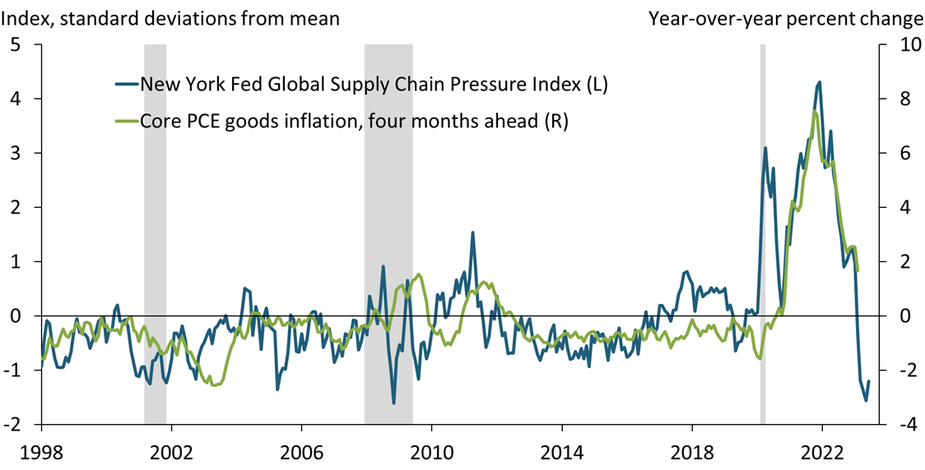
Note: Shaded areas denote National Bureau of Economic Research (NBER)-defined recessions.
Sources: U.S. Bureau of Economic Analysis, Federal Reserve Bank of New York, NBER, and authors’ calculations. All data sources accessed through Haver Analytics.
Supply chain disruptions, as measured by the Global Supply Chain Pressure Index (GSCPI), increased dramatically during the pandemic, reaching unprecedented levels (blue line). These supply shortages led to significant pressure on prices for goods, with core goods prices rising more than 7.5 percent from February 2021 to February 2022. However, since the start of 2022, supply chains have been improving steadily, helping cool core goods inflation (green line). Because core goods inflation has been following the GSCPI with a lag of several months, the most recent declines in the GSCPI suggest potential further declines in goods inflation in coming months.
Newly Unemployed Workers Are Facing More Difficulty Finding Jobs
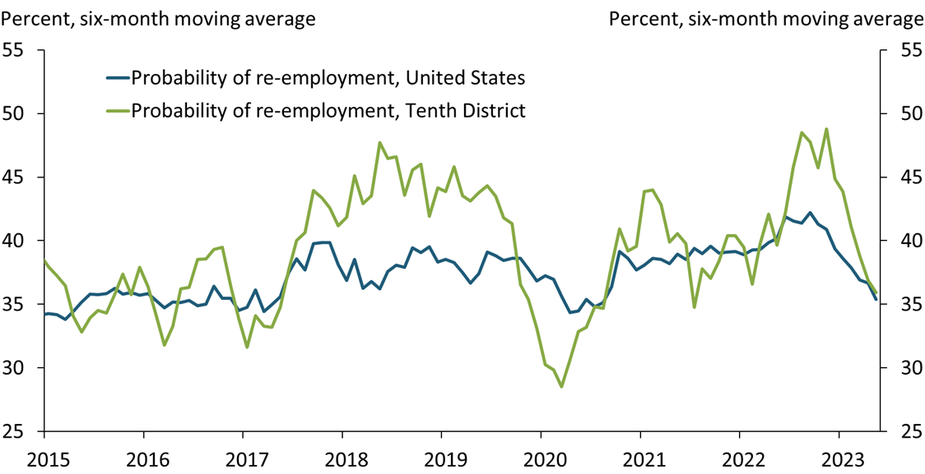
Notes: Values correspond to the fraction of workers unemployed less than five weeks who obtained a job in a given month. The Tenth Federal Reserve District includes Colorado, Kansas, Missouri, Nebraska, New Mexico, Oklahoma, and Wyoming. Tenth District data are not seasonally adjusted.
Sources: U.S. Census Bureau, U.S. Bureau of Labor Statistics (Haver Analytics), and authors’ calculations.
The probability of re-employment for workers unemployed less than five weeks has declined over the past few months, an early signal of the tight labor market loosening. Abundant job openings and strong labor demand in early 2022 made re-employment much easier for job seekers. However, since late 2022, workers who lost their jobs are facing more difficulty finding new employment opportunities in the Tenth Federal Reserve District and across the United States.
Higher Interest Rates Reduce Headline Inflation ahead of Core Inflation
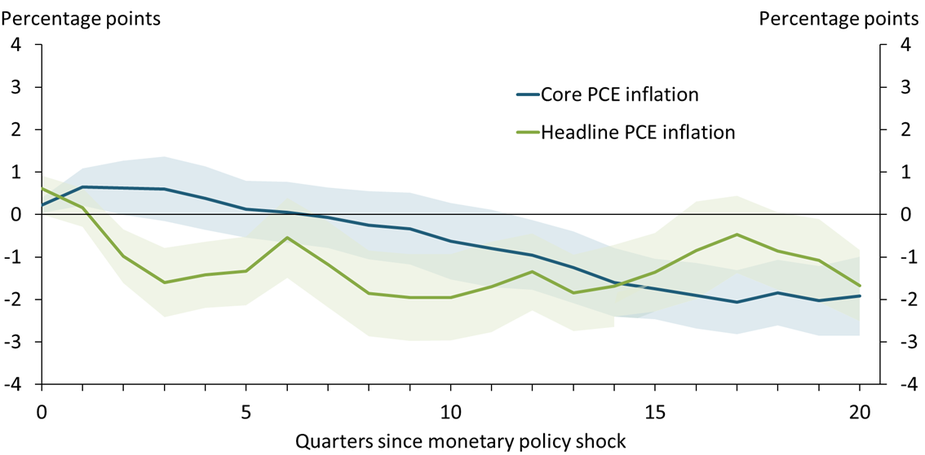
Notes: The chart shows the cumulative effect of a surprise hike in the federal funds rate, coded as a binary variable from Romer and Romer (2023), on the time path of each variable relative to the time path without a surprise hike. Monetary policy surprises are narratively identified based on historical minutes and transcripts of Federal Reserve policymaking meetings. Shaded areas represent one standard error confidence bands.
Sources: Federal Reserve Bank of Kansas City (Haver Analytics), External LinkRomer and Romer (2023), and author’s calculations.
Historic evidence since 1960 suggests that headline inflation responds to monetary policy differently from core inflation, which excludes food and energy prices. After a surprise hike in the federal funds rate, headline personal consumption expenditure (PCE) inflation declines within a year (green line), largely reflecting declines in energy and food price inflation. In contrast, core PCE inflation (blue line) takes two years to decline. The current inflation cycle follows this pattern: over the last year, core PCE inflation declined only slightly, but headline PCE inflation declined from 7.0 to 4.4 percent.
High Prices Continue to Drive Consumer Pessimism about Goods Purchases while Concerns about Interest Rates Grow
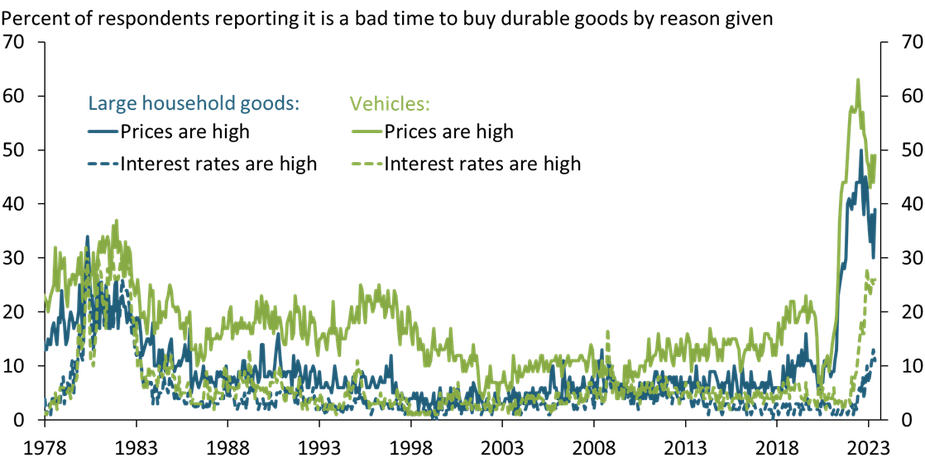
Source: University of Michigan (Haver Analytics).
A historically high proportion of people believe it is a bad time to buy large household goods or vehicles. While concerns about high interest rates have become a major reason given for negative sentiment about these purchases (dashed lines), consumers still cite high prices as the top reason they believe it is a bad time to buy durable goods (solid lines). This negative sentiment is especially striking given that actual goods consumption has been surprisingly resilient. Consumers’ discontent with high prices may weigh more heavily on consumption as excess savings decline and consumer budgets tighten (Çakır Melek and Pollard 2022).
The Fed’s Footprint in U.S. Money Market Funds Has Grown Significantly Since 2021
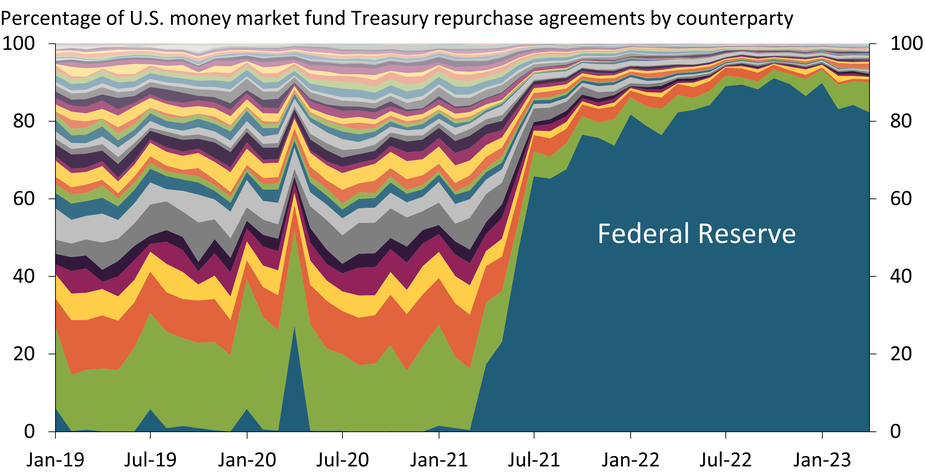
Sources: U.S. Securities and Exchange Commission (via U.S. Office of Financial Research) and author’s calculations.
The Federal Reserve’s Overnight Reverse Repurchase Facility provides money market funds with a short-term, risk-free investment paying competitive returns. Through this program, the Fed’s role as a counterparty for money market funds’ Treasury security repurchases has grown significantly. The chart above shows counterparties to U.S. money market funds in Treasury security repurchase agreements as a percentage of the total market. From 2019 to 2021, activity was spread among a diverse set of counterparties. However, since 2021, the Fed has been the dominant counterparty for U.S. money market funds’ Treasury repurchases.
Prices Charged by Publicly Traded Firms Grew Less Than Their Costs in 2022, Even Though Inflation Remained High
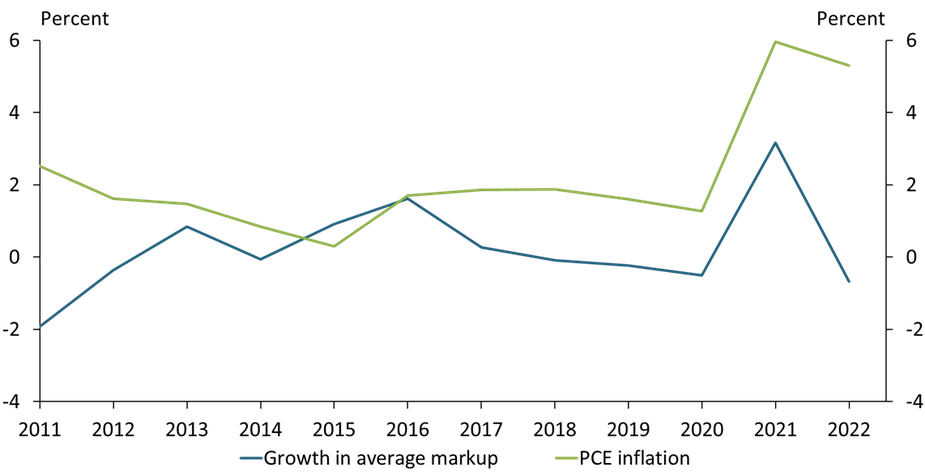
Sources: U.S. Bureau of Economic Analysis (Federal Reserve Bank of St. Louis FRED), Compustat, and authors’ calculations.
Growth in the average markup of publicly traded firms (that is, the price firms charge above their costs) fell sharply from 3.2 percent in 2021 to −0.7 percent in 2022. This decline could have substantially reduced inflation if firms’ costs had remained constant, since inflation is the sum of markup growth plus growth in the marginal cost of production. However, the pace of inflation—as measured by the price index for personal consumption expenditures (PCE)—fell by only 0.7 percentage points, suggesting rapid cost growth drove inflation in 2022.
Many Money Market Funds Have Invested Heavily in the Fed’s Overnight Reverse Repurchase Facility

Note: Chart shows ON RRP take-up by participating money market funds in April 2023. Total ON RRP investments are currently limited to $160 billion per fund.
Sources: U.S. Securities and Exchange Commission and authors’ calculations.
The Federal Reserve’s Overnight Reverse Repurchase Facility (ON RRP) has become increasingly important to the business model of many eligible money market funds because it provides a safe investment with competitive returns. The chart above shows each participating money market fund’s ON RRP investment compared with their total investments. Dots close to the 45° line indicate funds with nearly all of their investments in the ON RRP. As of April 2023, many funds kept most, and sometimes nearly all, of their investments in the ON RRP.
Wage Growth Is Softening for Job Switchers, but Remains Steady for Stayers
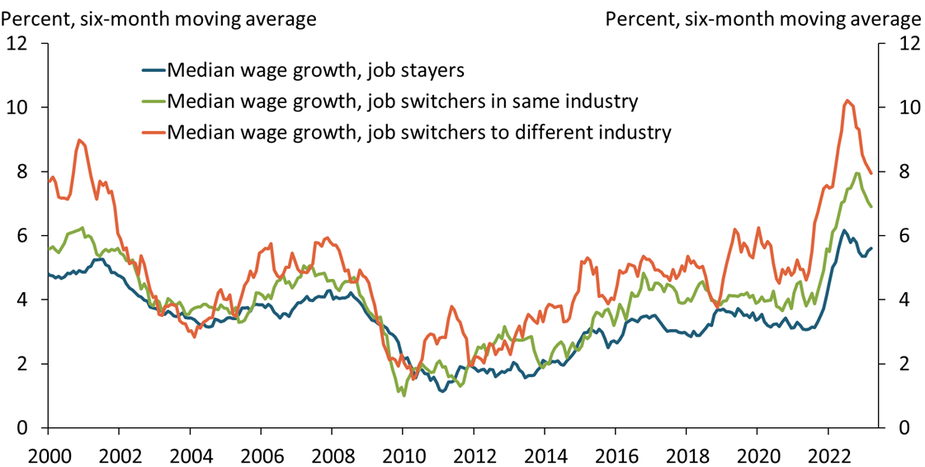
Sources: Federal Reserve Bank of Atlanta and author’s calculations.
Starting in mid-2021, median wage growth accelerated across job mobility categories in the same order as in prior expansions: first for job and industry switchers (orange line), then for job switchers who remained in the same industry (green line), and finally for stayers (blue line). More recently, wage growth of switchers—particularly those who also switched industries—has been the first category to decline, again consistent with historical patterns. Thus, an overall moderation in wage growth may take some time, as wage growth for the bulk of the employed, job stayers, is generally the last to react.
Home Prices Remain Near Their Peak, Boosting Single-Family Construction
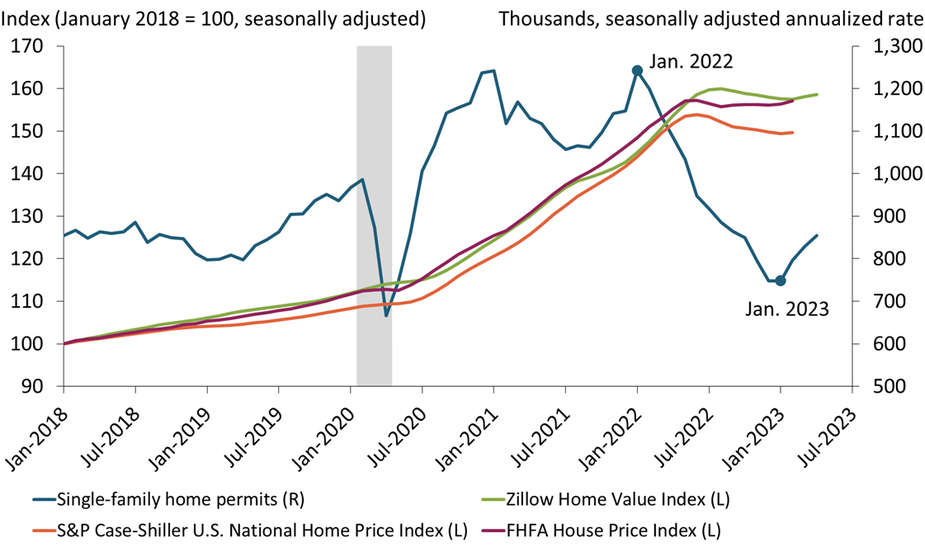
Note: Count of permits and Zillow Home Value index are through April 2023; S&P Case-Shiller and FHFA indexes are through February 2023.
Sources: U.S. Census Bureau, Standard & Poor’s, and Federal Housing Finance Agency (FHFA). All data sources accessed via Haver Analytics.
New permits to construct single-family homes (blue line) climbed for the third straight month in April, increasing 14 percent from their trough in January. This marks a partial reversal from their collapse during 2022 and reflects the surprising resilience of home prices (green, orange, and purple lines). Although the sharp run-up in interest rates has exerted strong downward pressure on prices, this pressure has thus far been offset by current homeowners’ reluctance to sell and give up their low-rate mortgages. As a result, home builders face less competition and so can maintain high profit margins.
Sharp Decline in Online Job Postings for Job Recruiters Could Signal a Softening Labor Market
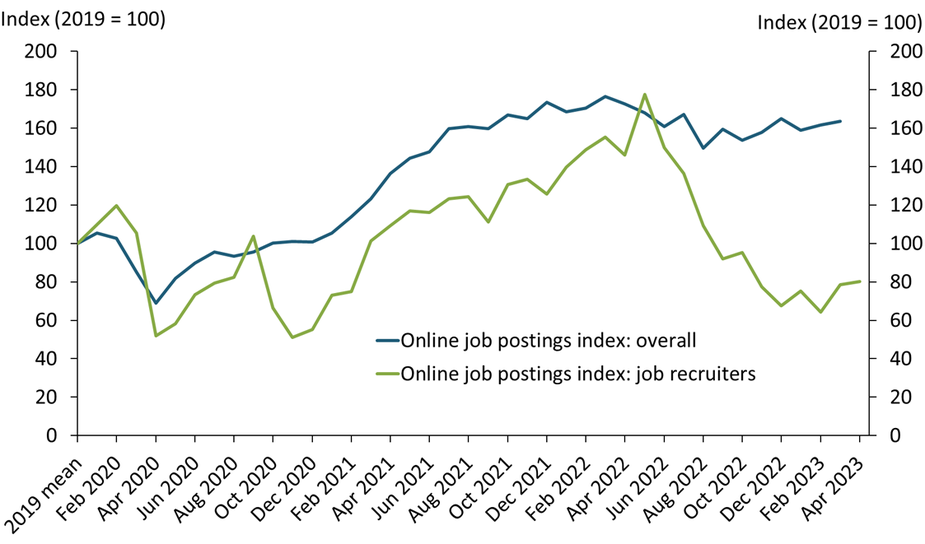
Notes: The mean online job postings for human resource specialist (recruiter) per month in 2019 was 30,848. Overall online job posting data is from the Conference Board’s Help Wanted Online Index (HWOL).
Sources: Lightcast and the Conference Board.
Online job postings have been persistently high compared with pre-pandemic levels (blue line), reflecting heightened labor demand. In contrast, after peaking in 2022, online postings for job recruiters have fallen sharply over the past year and are 20 percent below 2019 levels as of April 2023 (green line). The decline in recruiter postings may suggest that fewer employers are interested in recruiting new workers or that hiring new workers has become easier. Because having fewer recruiters may lead to fewer job openings in the coming months, this decline could signal that the labor market is softening.
The LMCI-Implied Unemployment Rate Suggests Actual Unemployment May Begin to Rise
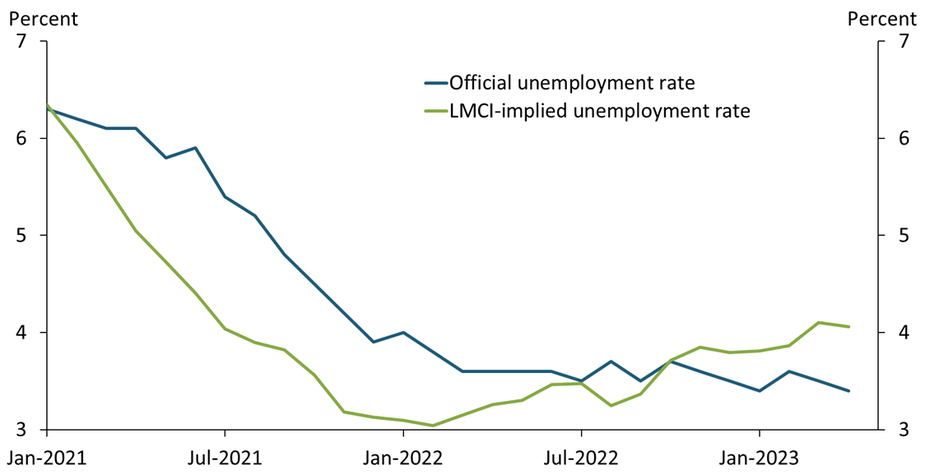
Sources: U.S. Bureau of Labor Statistics; Federal Reserve Bank of Kansas City; Glover, Mustre-del-Río, and Pollard (2021); and authors’ calculations.
Despite some signals of labor market slackening, the unemployment rate (blue line) has shown little upward movement over the past several months. However, the Kansas City Fed’s Labor Market Conditions Indicators (LMCI) unemployment rate (green line) suggests some loosening has begun. This alternative measure of the unemployment rate (updated from Glover, Mustre-del-Río, and Pollard 2021) began rising early in 2022 and now stands at 4.1 percent. Historically, turning points in this alternative measure have preceded turning points in the official measure, suggesting actual unemployment may begin to rise.