Over the past year, the Federal Reserve has rapidly raised interest rates to try to mitigate inflation. Nevertheless, the labor market remains tight, supporting ongoing elevated inflation. Why has rapid monetary policy tightening not yet cooled labor markets enough to quell the current bout of inflation?
One explanation lies in the degree to which some sectors of the economy are less sensitive to changes in interest rates than others. The services sector, in particular, has contributed substantially to recent inflation, reflecting ongoing imbalances in labor markets where supply remains impaired and demand remains robust (Bundick, Smith, and Van der Meer 2023)._ Because labor represents a substantial input cost in service industries, services inflation is more responsive to labor market tightness compared with goods inflation. Moreover, because service production tends to be less capital intensive and services consumption is less likely to be financed, it also tends to respond less quickly to rising interest rates. Thus, monetary policy may take longer to influence a key source of current inflation—the tight labor market in services.
To assess whether labor markets in certain industries take longer to respond to monetary policy, we create industry-specific versions of the Kansas City Fed Labor Market Conditions Indicators (LMCI). The Kansas City Fed LMCI collapses information from 24 labor market variables into two monthly measures: the level of activity and momentum. The level of activity provides a sense of overall labor market tightness, while momentum provides a signal of where the labor market is headed. We use the same 24 labor market variables that inform the headline LMCI indicators to create activity and momentum indicators for eight specific industries._ We then sort these industries by their interest rate sensitivity, averaging the LMCI series for the two industries most sensitive to interest rates (manufacturing and information) and the two least sensitive to interest rates (nonprofessional services and transportation, warehousing, and utilities) to create an “interest-rate-sensitive” and “interest-rate-insensitive” LMCI._
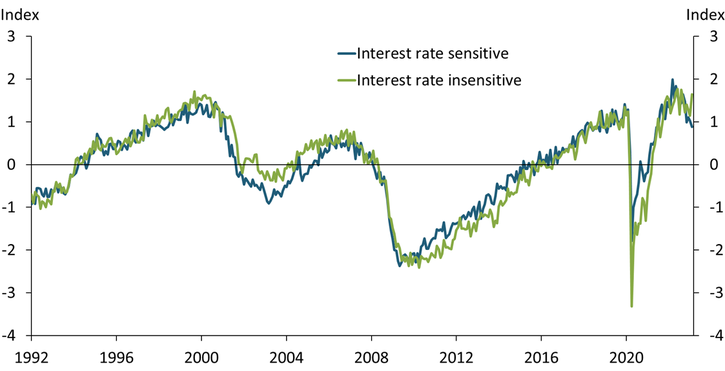
Chart 1 shows the demeaned interest-rate-sensitive and interest-rate-insensitive LMCI. Panels A and B show that both the level of activity and momentum in interest-rate-sensitive industries (blue line) and interest-rate-insensitive industries (green line) tend to move together. However, momentum falls more quickly for industries sensitive to interest rates than for those insensitive to interest rates. This result suggests that interest-rate-sensitive industries shed workers more quickly when conditions worsen and are slower to bring them back on in expansions.
Chart 1: Labor market activity and momentum in interest-rate-sensitive and -insensitive industries move together across the business cycle
Panel A: Level of activity
Panel B: Momentum
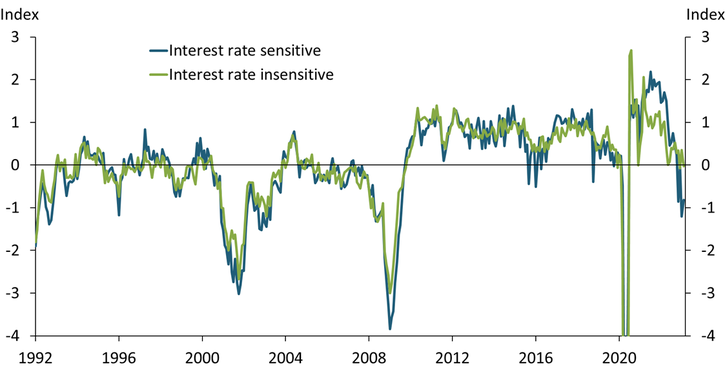
Notes: All series have a mean of zero. The y-axis unit is standard deviations of the aggregate LMCI series. Sources for model input data can be found in the online data appendix.
Source: Authors’ calculations.
Momentum is an important signal for the future health of the labor market. For example, Mustre-del-Río and Pollard (2022) find that sustained negative momentum readings are a leading indicator of declining wage growth and rising unemployment, though these outcomes normally lag momentum turning negative by one or two years. Sectors insensitive to interest rates are more sluggish to respond, however, muting the response of the aggregate momentum indicator. To quantify this effect, Chart 2 compares momentum indicators for all industries, interest-rate-sensitive industries, and interest-rate-insensitive industries during the monetary policy tightening cycles of the mid-1990s, early 2000s, and mid-2000s. During these cycles, aggregate momentum (orange line) begins to fall on a sustained basis six months after tightening begins. However, this decline appears to be driven by a sustained decrease in momentum in interest-rate-sensitive industries (blue line). Momentum in interest-rate-insensitive industries (green line) does not begin to fall on a sustained basis until 12 months after the monetary policy tightening begins. Our decomposition supports Willis and Cao’s (2015) hypothesis that the relative contraction of interest-rate-sensitive industries in the United States to insensitive industries has extended the lag with which monetary policy affects aggregate labor market behavior.
Chart 2: Momentum in interest-rate-insensitive sectors falls six months after the aggregate
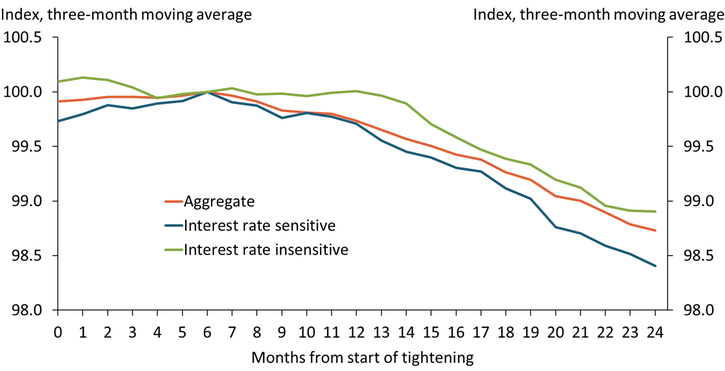
Notes: All series are indexed to 100 six months after the start of monetary policy tightening. Series are the average of data from the mid-1990s, early 2000s, and mid-2000s tightening cycles. Sources for model input data can be found in the data appendix.
Source: Authors’ calculations.
Turning to the current episode, Chart 3 shows the level of activity and momentum indicators for all industries, interest-rate-sensitive industries, and interest-rate-insensitive industries since July 2021, where the dashed vertical line denotes the start of monetary policy tightening. The left panel shows that labor market activity in industries sensitive to interest rates appears to have peaked first, in March of 2022, followed by the aggregate level of activity, which began trending down in May 2022. However, industries insensitive to interest rates have yet to trend clearly down.
Chart 3: Activity and momentum have noticeably cooled in interest-rate-sensitive industries, while insensitive industries lag behind
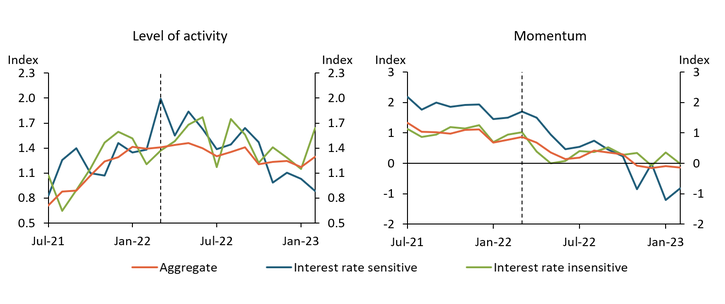
Notes: All series have a mean of zero. The y-axis unit is standard deviations of the aggregate LMCI series. The dashed vertical line denotes the start of monetary policy tightening in March 2022. Sources for model input data can be found in the data appendix.
Source: Authors’ calculations.
Momentum follows a similar pattern. Although momentum has turned negative for interest-rate-sensitive industries, momentum for interest-rate-insensitive industries remains around its longer-run average, suggesting those labor markets have not yet begun contracting. Still, momentum in interest-rate-insensitive industries is low, suggesting that while labor markets in these industries continue to tighten, the pace has slowed. Together, Charts 2 and 3 suggest that recent labor market dynamics are consistent with historical norms, with industries that have traditionally been insensitive to interest rates showing less of a reaction to monetary policy tightening.
In sum, labor markets in services industries have historically been less sensitive to monetary policy tightening than other industries, a pattern confirmed by developments over the last year. Because labor tightness in these industries has contributed substantially to elevated inflation, this pattern suggests a potential roadblock for monetary policy in effectively bringing down core services inflation and provides a potential reason why monetary policy has yet to cool the labor market enough to bring inflation back to target.
Download Materials
Endnotes
-
1 Bundick, Smith, and Van der Meer (2023) find that an increase in labor tightness passes through to core services inflation at more than three times the rate it passes through to goods inflation.
-
2 Details on the construction of the LMCI are available in Hakkio and Willis (2014), while information on our industry groupings and the input data used are available in an online data appendix. Note that the aggregate data in this article do not exactly match that of the official LMCI release. See the data appendix for details.
-
3 We group the industry-level indexes using principal components analysis. Although the first factor is common among all industries (specifically, the business cycle), the second factor appears to group industries into those historically categorized as interest rate sensitive versus those commonly thought of as interest rate insensitive. We use the coefficients of this second factor to pick the two industries most and least sensitive to interest rates.
References
Bundick, Brent, A. Lee Smith, and Luca Van der Meer. 2023. “External LinkA Tight Labor Market Could Keep Rent Inflation Elevated.” Federal Reserve Bank of Kansas City, Economic Bulletin, March 1.
Hakkio, Craig S., and Jonathan L. Willis. 2014. “External LinkKansas City Fed’s Labor Market Conditions Indicators (LMCI).” Federal Reserve Bank of Kansas City, The Macro Bulletin, August 28.
Mustre-del-Río, José, and Emily Pollard. 2023. “External LinkThe KC Fed LMCI Momentum Indicator Suggests Monetary Policy Is Beginning to Weigh on Labor Markets.” Federal Reserve Bank of Kansas City, Economic Bulletin, February 3.
Willis, Jonathan L., and Guangye Cao. 2015. “External LinkHas the U.S. Economy Become Less Interest Rate Sensitive?” Federal Reserve Bank of Kansas City, Economic Review, vol. 100, no. 2, pp. 5–36.
Karlye Dilts Stedman is a senior economist at the Federal Reserve Bank of Kansas City. Emily Pollard is an assistant economist at the bank. The views expressed are those of the authors and do not necessarily reflect the positions of the Federal Reserve Bank of Kansas City or the Federal Reserve System.
Authors

Karlye Dilts Stedman
Senior Economist