Demand for Farmland

Long-term prospects may remain attractive to some buyers. Scroll to read the insight.

Insights on Agricultural and Rural Economies

Regular updates and concise analysis on agricultural and rural economic trends from the Center for Agriculture and the Economy.


Filters
Agricultural Finance Agriculture Crop and Livestock Sectors Food Prices Natural Resources and Environment Regional Agriculture Rural Economy US Agriculture Clear Filters
9-18-26-Meatpacking-Employment

Rural Labor Markets are Likely Disrupted Most When Meatpacking Jobs Relocate
Rural Economy |
Line graph comparing average long-term farmland appreciation and yields on U.S. government securities from 2010 to 2026, showing farmland appreciation is consistently higher than government securities yields.

Long-term Farmland Appreciation May Remain Attractive to Some Buyers
Agriculture | Agricultural Finance
8-19-26-Meat-Prices

Demand for Beef Remains Strong Despite Higher Retail Prices
Food Prices | Crop and Livestock Sectors | Agriculture
Two line charts compare Return on Average Assets and Net Interest Margin for community banks, agricultural banks, and highly concentrated agricultural banks from Mar-16 to Mar-26. All groups show fluctuations and general trends over time.

Earnings Performance at Agricultural Banks Remains Strong
Agriculture | Agricultural Finance
8-6-2026-Ag-Summit

Agricultural Economic Summit Highlights Key Structural Changes Shaping Agriculture
Agriculture | US Agriculture
7-22-26-Hospital-Beds

Consolidation Has Affected Availability of Rural Health Care

Rural Economy
7-13-26-Cattle-Drought

Drought Intensity Adds Further Uncertainty to Cattle Herd Rebuilding

Agriculture | Crop and Livestock Sectors | Natural Resources and Environment
7-3-26-Unemployment

Unemployment Remains Low in Rural Farm Counties

Rural Economy
6-25-26-Corn-Soybean-Prices

Corn and Soybean Price Patterns Reflect Different Stages of Their Respective Biofuel Markets

Agriculture | Crop and Livestock Sectors | US Agriculture
Load More

Rural Labor Markets are Likely Disrupted Most When Meatpacking Jobs Relocate

By John McCoy and Francisco Scott

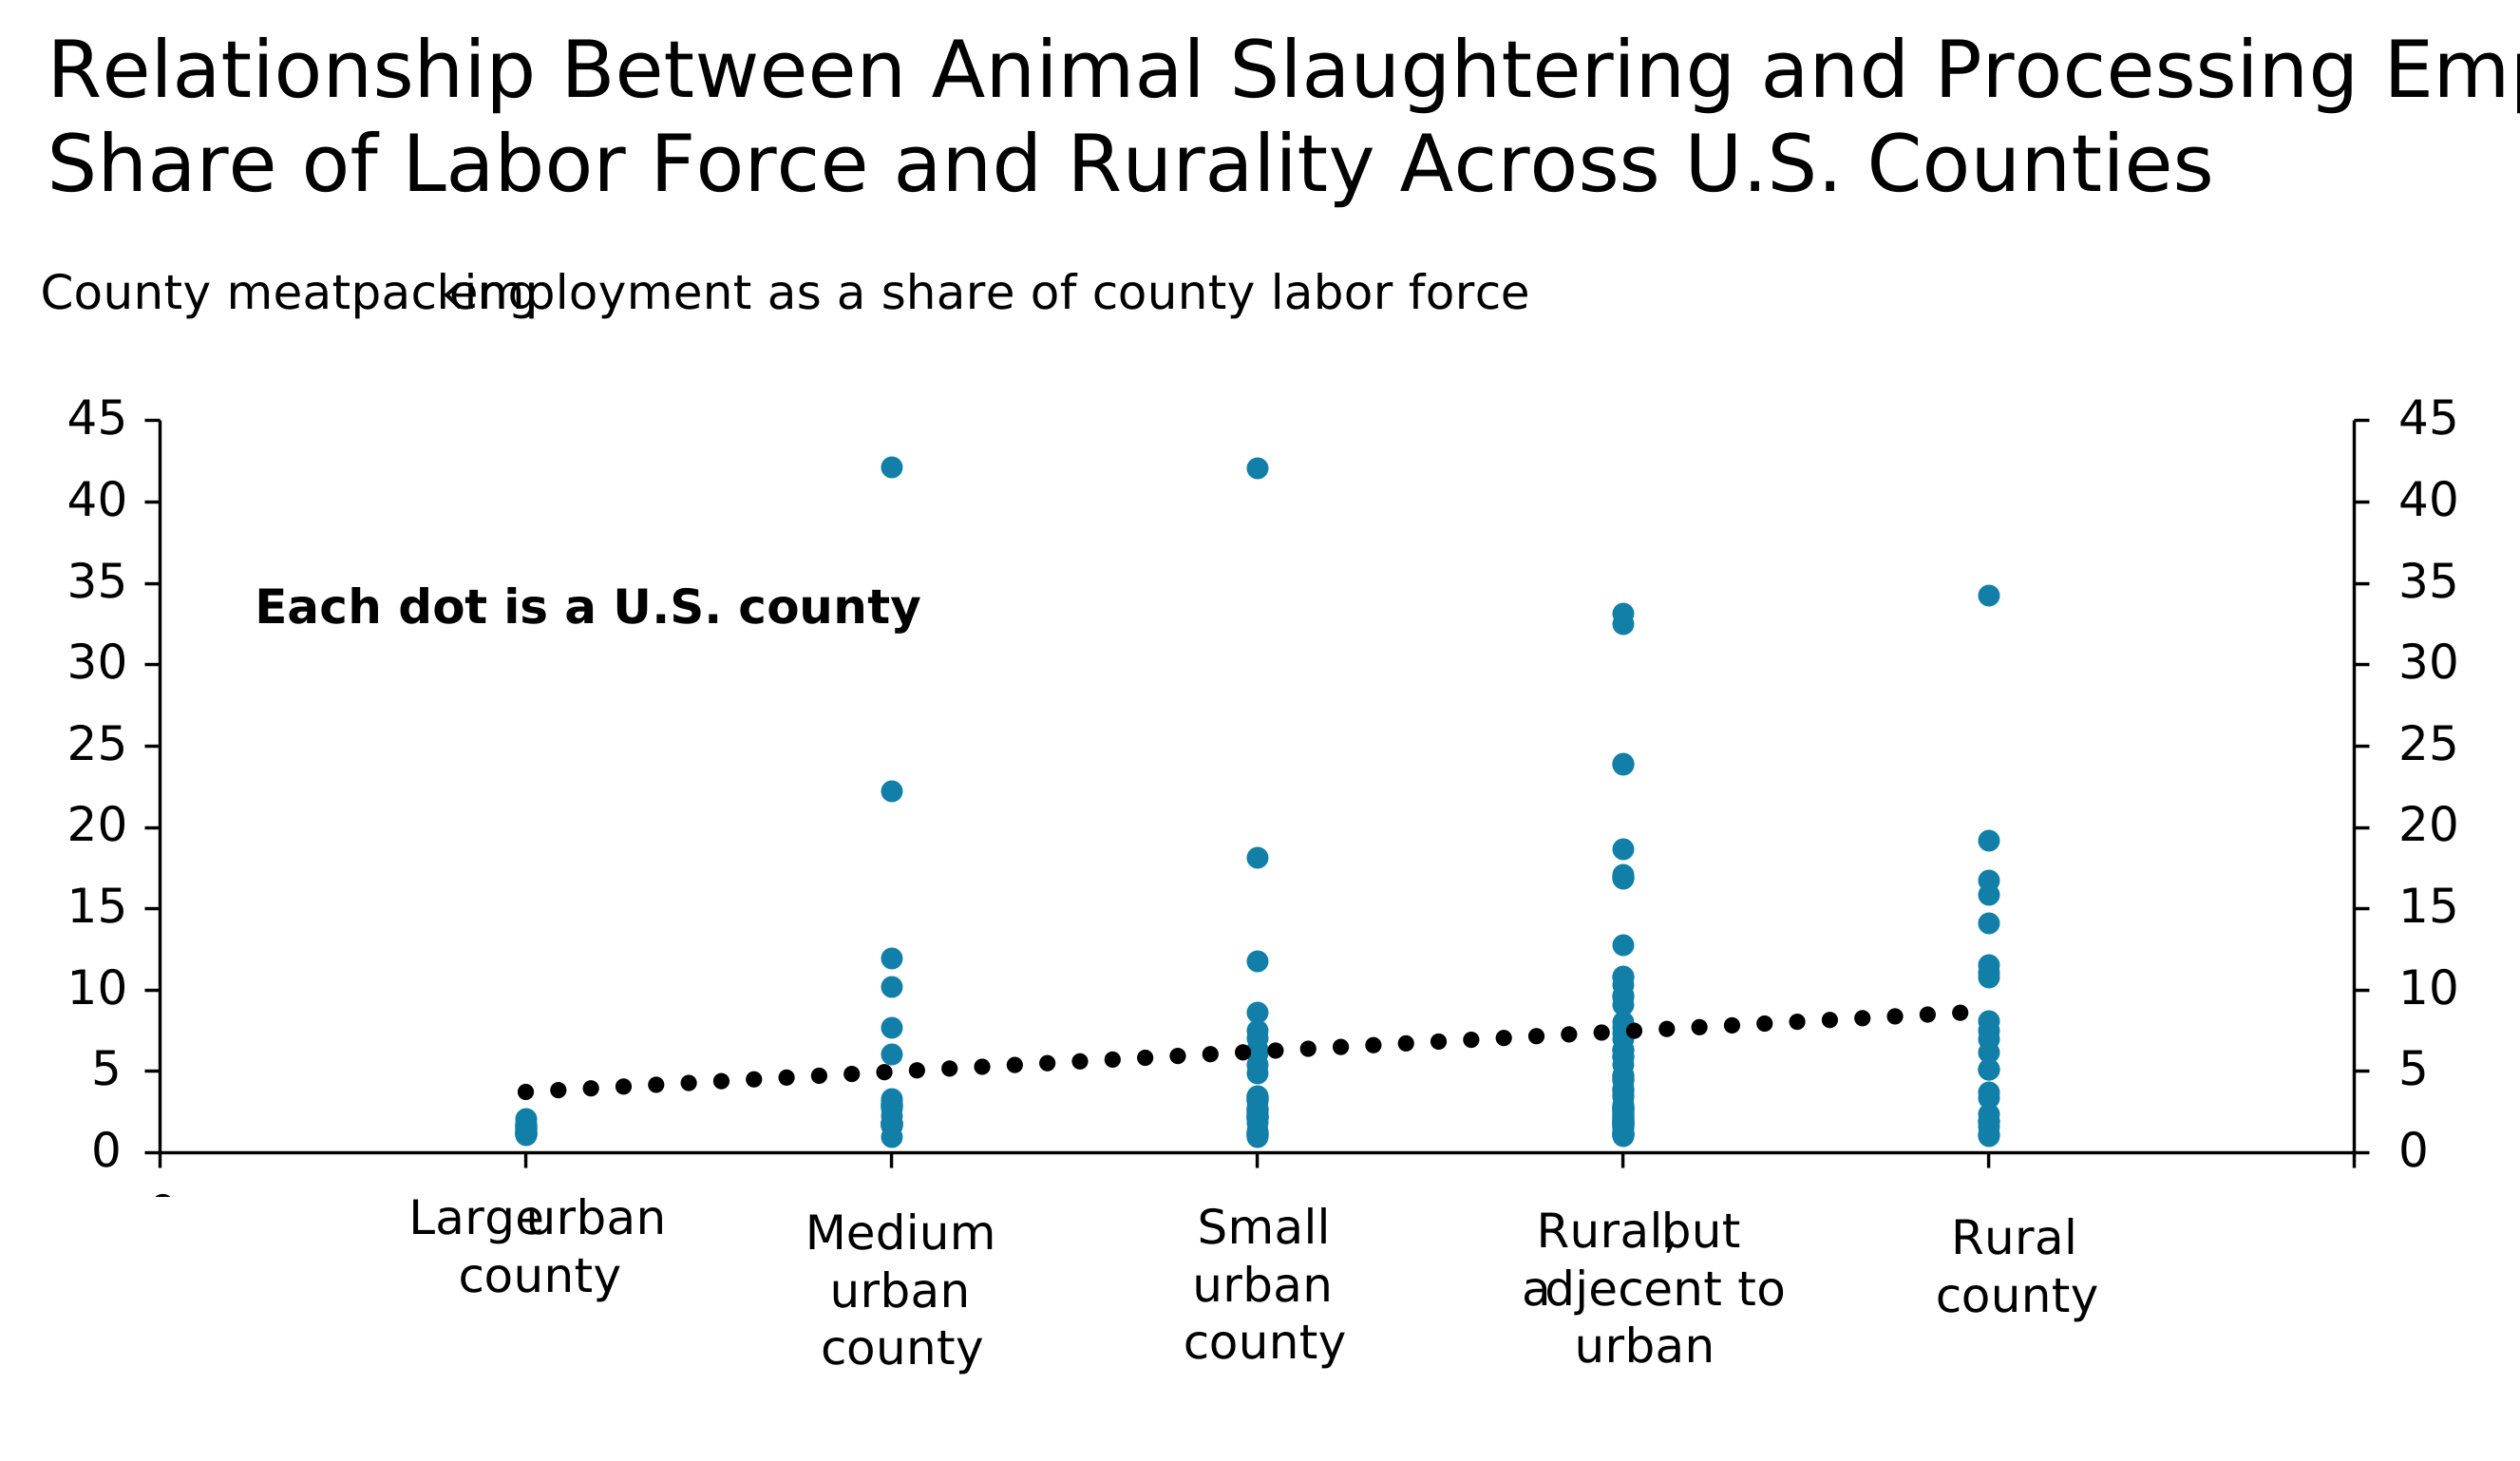
Rural labor markets are likely to be more adversely affected from recent meatpacking closures than those near urban areas. Rural counties tend to have a higher share of their workforce employed in meatpacking plants. However, a significant number of these meatpacking-dependent counties are also near urban areas. Counties with high concentrations of meatpacking jobs near metropolitan areas have a larger, more dynamic labor market that can help workers transition to new jobs. If meatpacking plants in urban or urban adjacent counties close or consolidate, workers in these areas will likely transition faster to new jobs than workers in rural areas.

Dot plot titled 'County meatpacking employment as a share of county labor force.' Counties are grouped into five categories along the x-axis: large urban, medium urban, small urban, rural but adjacent to urban, and rural. Each dot is a U.S. county. A dotted trend line rises gradually showing that meatpacking employment makes up a larger share of the labor force in more rural areas. However, some counties with a large share of employment in meatpacking are located in more urban or urban-adjacent counties."

Notes: Meatpacking employment as a share of labor force uses 2023 data from county business patterns. Each dot represents a county. Sample includes all U.S. counties that have at least 1% of their labor force working in animal slaughter and processing plants. We modified the USDA rurality continuum to create a new typology for urban and rural counties. Urban counties with population of 1 million, between 250 thousand and 1 million, and less than 250,000 are classified as Large urban, Medium urban, and Small urban, respectively. Counties in rural areas but adjacent to urban areas are classified as Rural, but adjacent to urban, and those rural counties not adjacent to urban areas are classified as Rural county. Black line shows the relationship between meatpacking jobs as a share of labor force and an encoded version of the rurality categories that vary from 1 to 5, 1 being most urban and 5 being the most rural.

Sources: U.S. Census Bureau, USDA, authors’ calculations

Related Content

Economic Bulletin: Mass Layoffs Can Disproportionately Disrupt Small Communities

By John McCoy

The recent closure of a meatpacking plant in Lexington, Nebraska, raises questions about how mass layoffs affect nearby...

Rural Economy

Long-term Farmland Appreciation May Remain Attractive to Some Buyers

By Ty Kreitman

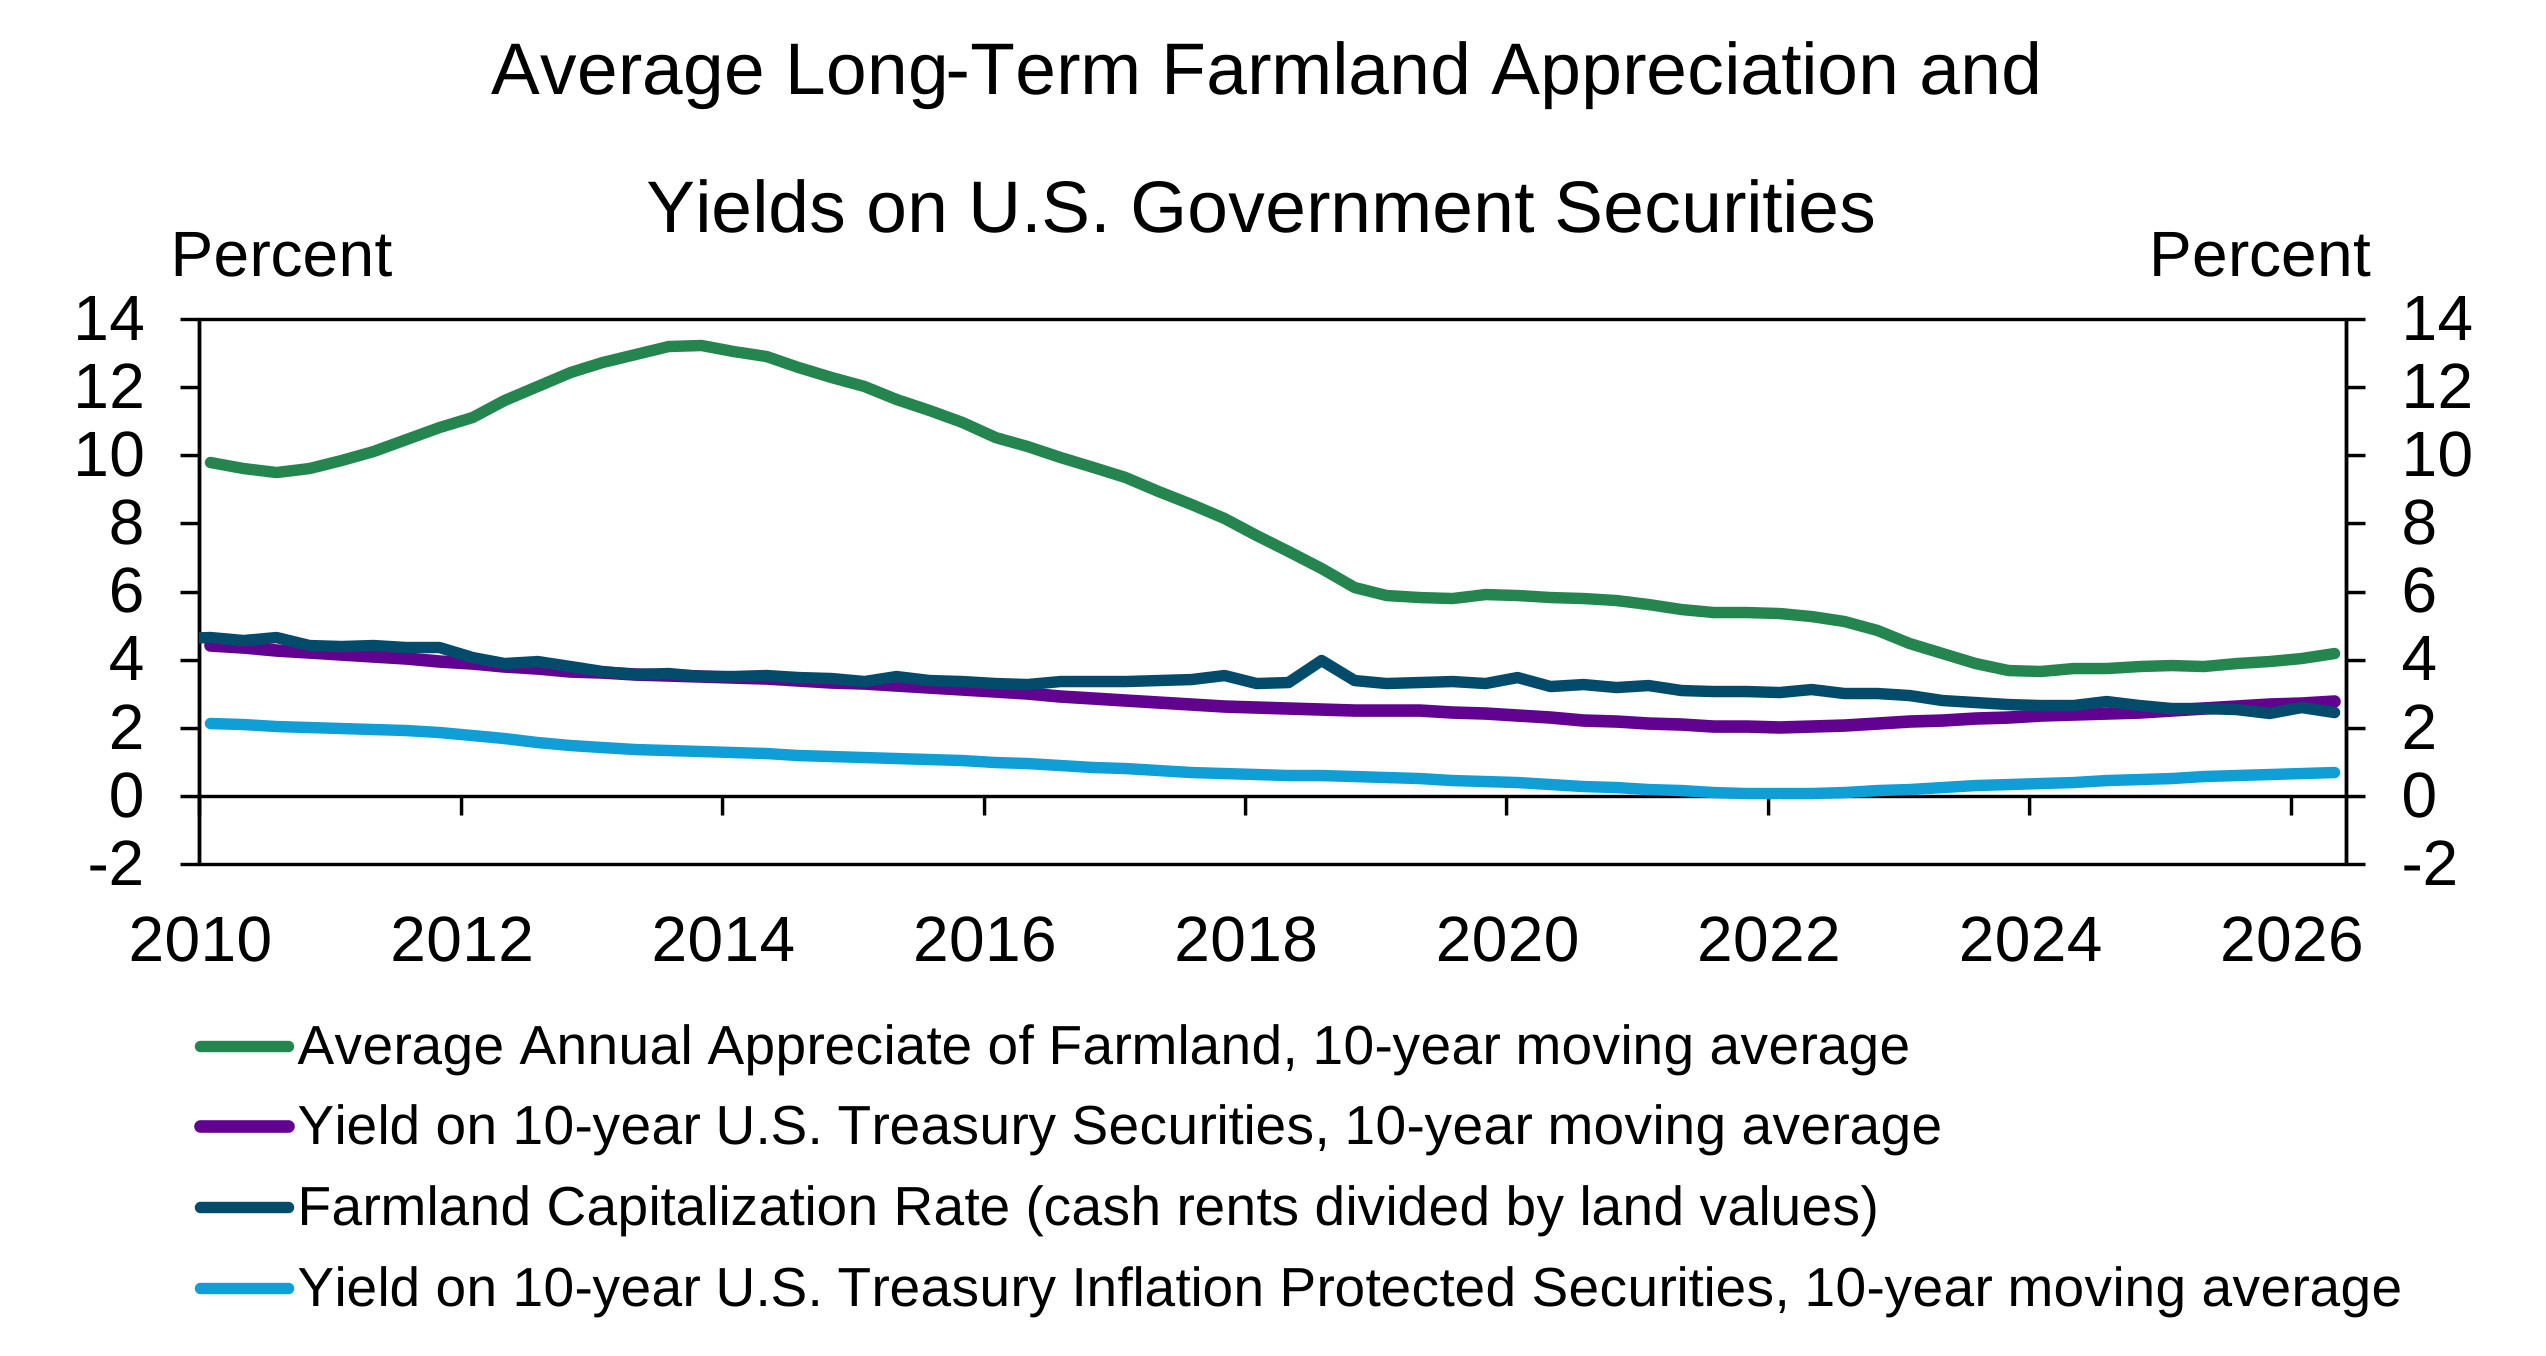
U.S. farmland real estate values have stayed strong despite tightening in farm financial conditions. While the expected return on farmland from cash rents has declined as land values have outpaced increases in rental rates, long-term appreciation has remained relatively steady. The capitalization rate on nonirrigated cropland dropped slightly below the 10-year moving average yield on 10-year U.S. bonds in the second quarter of 2026 (dark blue and purple lines). However, the 10-year moving average of annual appreciation in land values (green line) remained more than 1.25 percentage points higher. Over the past decade, average land appreciation has also exceeded average yields on inflation adjusted 10-year bonds by about 3.5 percentage points (light blue line). Farmers have remained the primary buyers of land in most major agricultural regions and the long-term prospects have potentially remained attractive when considering inflation and alternative investments.

Line graph comparing average long-term farmland appreciation and yields on U.S. government securities from 2010 to 2026, showing farmland appreciation is consistently higher than government securities yields.

Note: The capitalization rate is calculated as cash rent on nonirrigated cropland divided by the value of nonirrigated cropland. The appreciation of farmland values is based on annual changes in the value of nonirrigated cropland.

Sources: Federal Reserve Survey of Agricultural Credit Conditions, Federal Reserve Board of Governors; Federal Reserve Bank of Kansas City staff calculations

Related Content

Agricultural Finance Update: Farm Finance Deterioration Eases Slightly

By Ty Kreitman

Farm income and credit conditions continued to deteriorate in the second quarter but showed signs of easing.

Agriculture Agricultural Finance

Demand for Beef Remains Strong Despite Higher Retail Prices

By Cortney Cowley

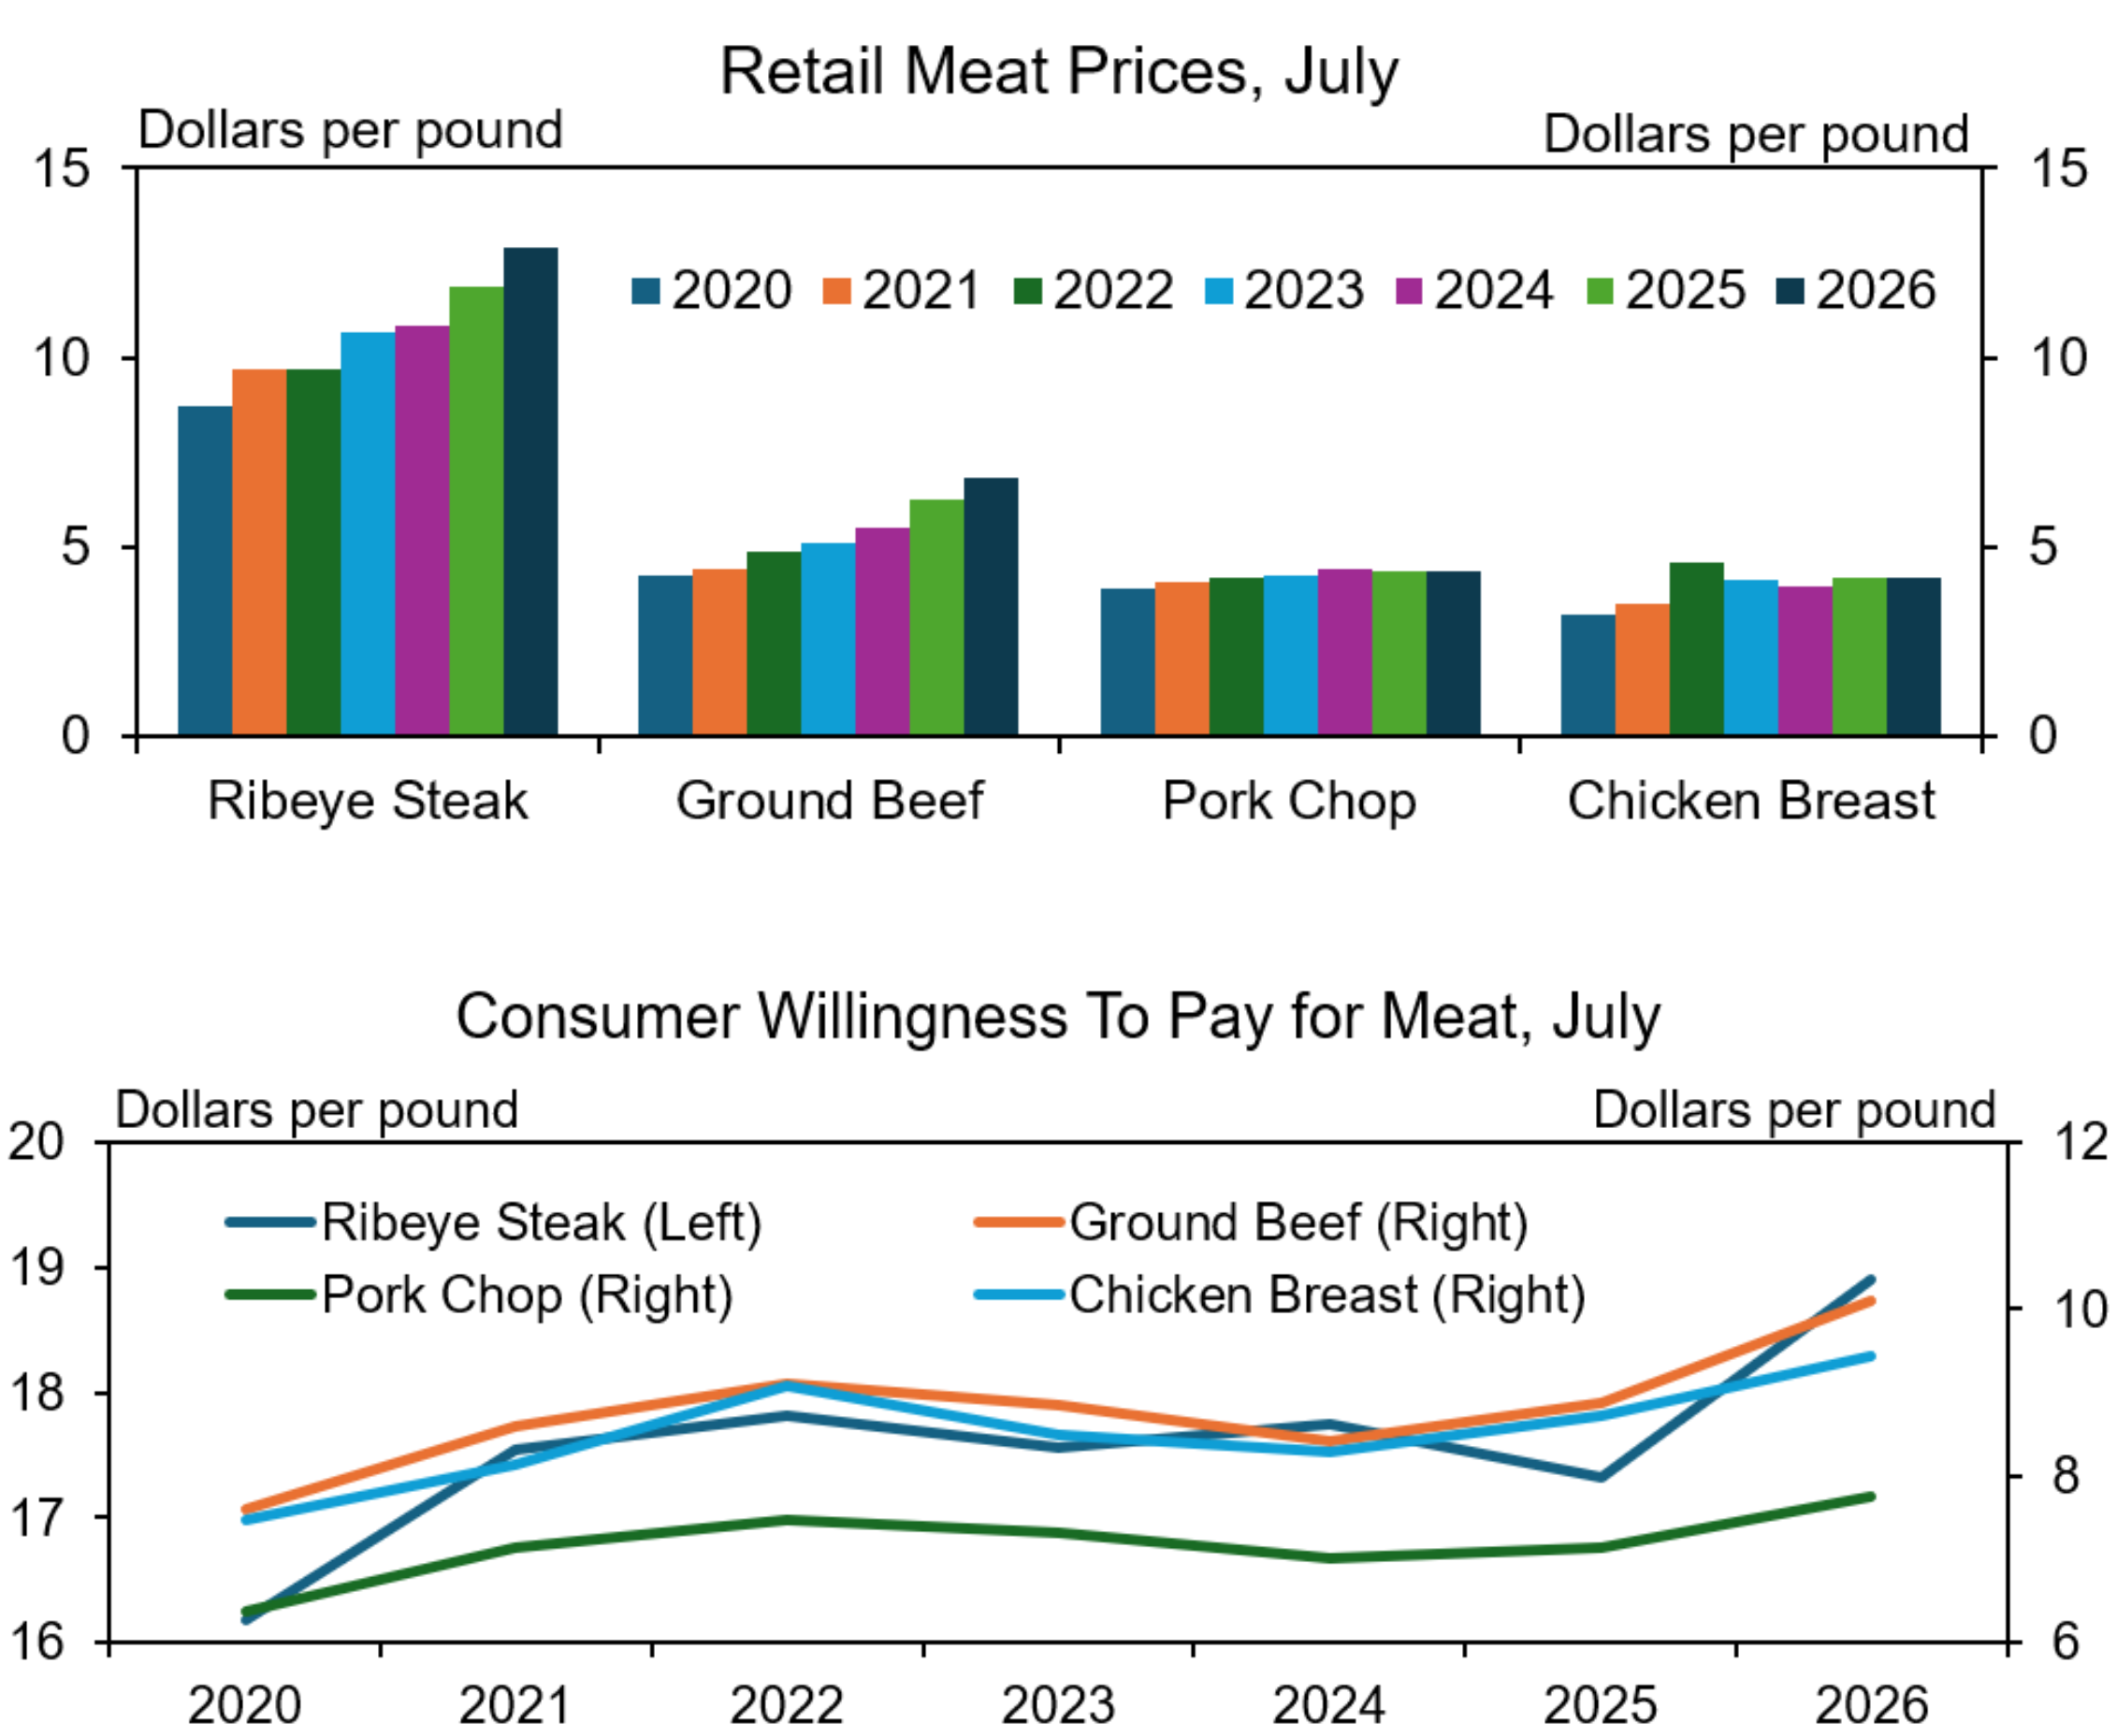
Consumer demand for many beef products has continued to increase even as retail prices have climbed higher for seven consecutive years. Since 2020, retail prices for ribeye steak and ground beef have increased nearly 50% and 60%, respectively, while prices for other meat products like pork chops and chicken breast have remained relatively more stable (top chart). Low supplies have contributed to higher prices for beef, but strong demand also has remained a key factor. In fact, consumers’ willingness to pay for all meat products rose in July 2026 (bottom chart). Consumers were willing to pay nearly $19 per pound for a ribeye steak and about $10 per pound for ground beef, suggesting that consumers’ stated desire for meat, and particularly beef, could continue to put upward pressure on prices.

The top chart is a bar graph showing retail meat prices in dollars per pound for four types of meat (Ribeye Steak, Ground Beef, Pork Chop, and Chicken Breast) across seven years (2020-2026). Ribeye steak and ground beef prices increase steadily each year, while trends for prices for pork chops and chicken breast remain relatively flatter. The bottom chart is a line graph showing consumer willingness to pay (WTP, in dollars per pound) for four types of meat from 2020 to 2026. The chart uses two y-axes: the left axis ranges from 16-20 dollars per pound, while the right axis ranges from 6-12 dollars per pound. Prices for all meats increase steadily over the period, with WTP for steak and ground beef outpacing pork and chicken in 2026.

Notes: This Agricultural Insight was inspired by discussion at the AAEA Post-Conference Workshop titled “Bridging Research and Application: Emerging Developments in Agricultural Science, Data, and Finance” on July 29, 2026 at the Federal Reserve Bank of Kansas City in Kansas City, MO. Willingness-to-pay (WTP) values are nominal estimates of the dollars per pound at retail, such as a grocery store, that a typical U.S. resident would spend to purchase a product. Retail meat prices for 2026 are for the month of June.
Sources: U.S. Bureau of Labor Statistics and the Meat Demand Monitor at Kansas State University (AgManager.info)

Related Content

High Costs and Uncertainty Will Likely Keep Cattle Inventories Low and Beef Prices Elevated for Some

By Francisco Scott

Despite favorable market signals, supply constraints may keep beef prices elevated for some time.

Food Prices Crop and Livestock Sectors Agriculture

Earnings Performance at Agricultural Banks Remains Strong

By Chris Summers, Kalyn Yzaguirre, and Camryn Lucas

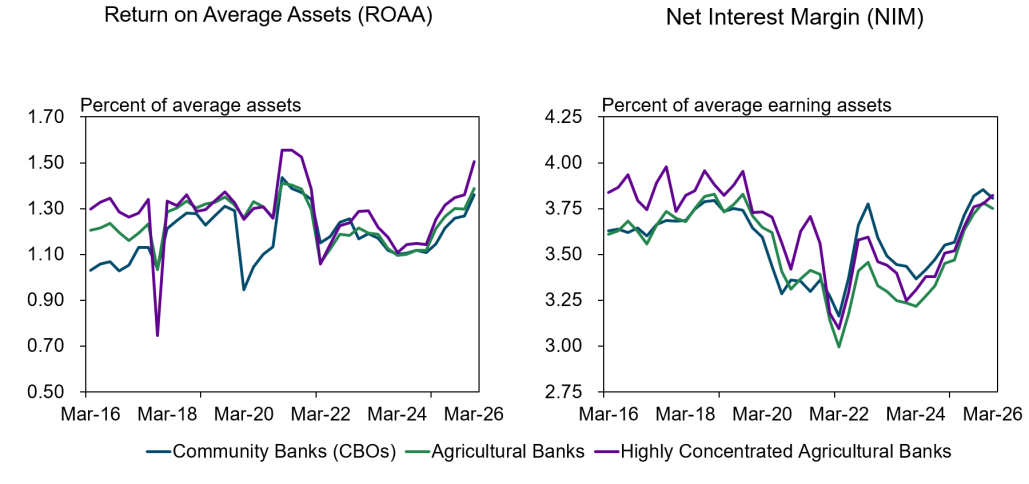
Earnings performance across commercial agricultural banks remained strong in the first quarter of 2026. The return on average assets increased to 1.4% through March, continuing to surpass earnings of all community banks. More specifically, net income improvement was largely driven by increases in net interest income related to recent loan growth. Community banks have also continued to report higher levels of noninterest and provision expenses than agricultural banks, further bolstering earnings. Net interest margins at all community banks and agricultural banks contracted slightly from the previous quarter as loan yields declined slightly more than funding costs; however, margins at highly concentrated agricultural banks continued an upward trend. This trend in margins was driven by cost of funds declining faster than earning asset yields.

Two line charts compare Return on Average Assets and Net Interest Margin for community banks, agricultural banks, and highly concentrated agricultural banks from Mar-16 to Mar-26. All groups show fluctuations and general trends over time.

Notes: ROAA = net income (year-to-date) divided by average assets - annualized. NIM = interest income net of interest expense (quarter) divided by average earning assets (quarter) - annualized. Community banking organizations (CBOs) are defined as commercial banks having less than $10 billion in assets. Agricultural banks are defined as commercial banks with agricultural production and farm real estate loans equaling 25 percent or more of total loans. Highly concentrated agricultural banks are defined as commercial banks with agricultural production and farm real estate loans equaling 300 percent or more of tier 1 capital plus the allowance for credit losses (ACL). This more stringent definition captures approximately the top one-third of all agricultural banks.

Sources: Consolidated Reports of Condition and Income, Reports of Conditions and Income

Chris Summers, Kalyn Yzaguirre, and Camryn Lucas are supervisory examiners at the Federal Reserve Bank of Kansas City.

Related Content

Agricultural Finance Update: Farm Loan Growth Remains Strong as Lending Shifts at Some Large Banks

By Ty Kreitman

Farm loan growth continued to be concentrated among agricultural banks during the first quarter of 2026 and production loans...

Agriculture Agricultural Finance

Agricultural Economic Summit Highlights Key Structural Changes Shaping Agriculture

By Nate Kauffman

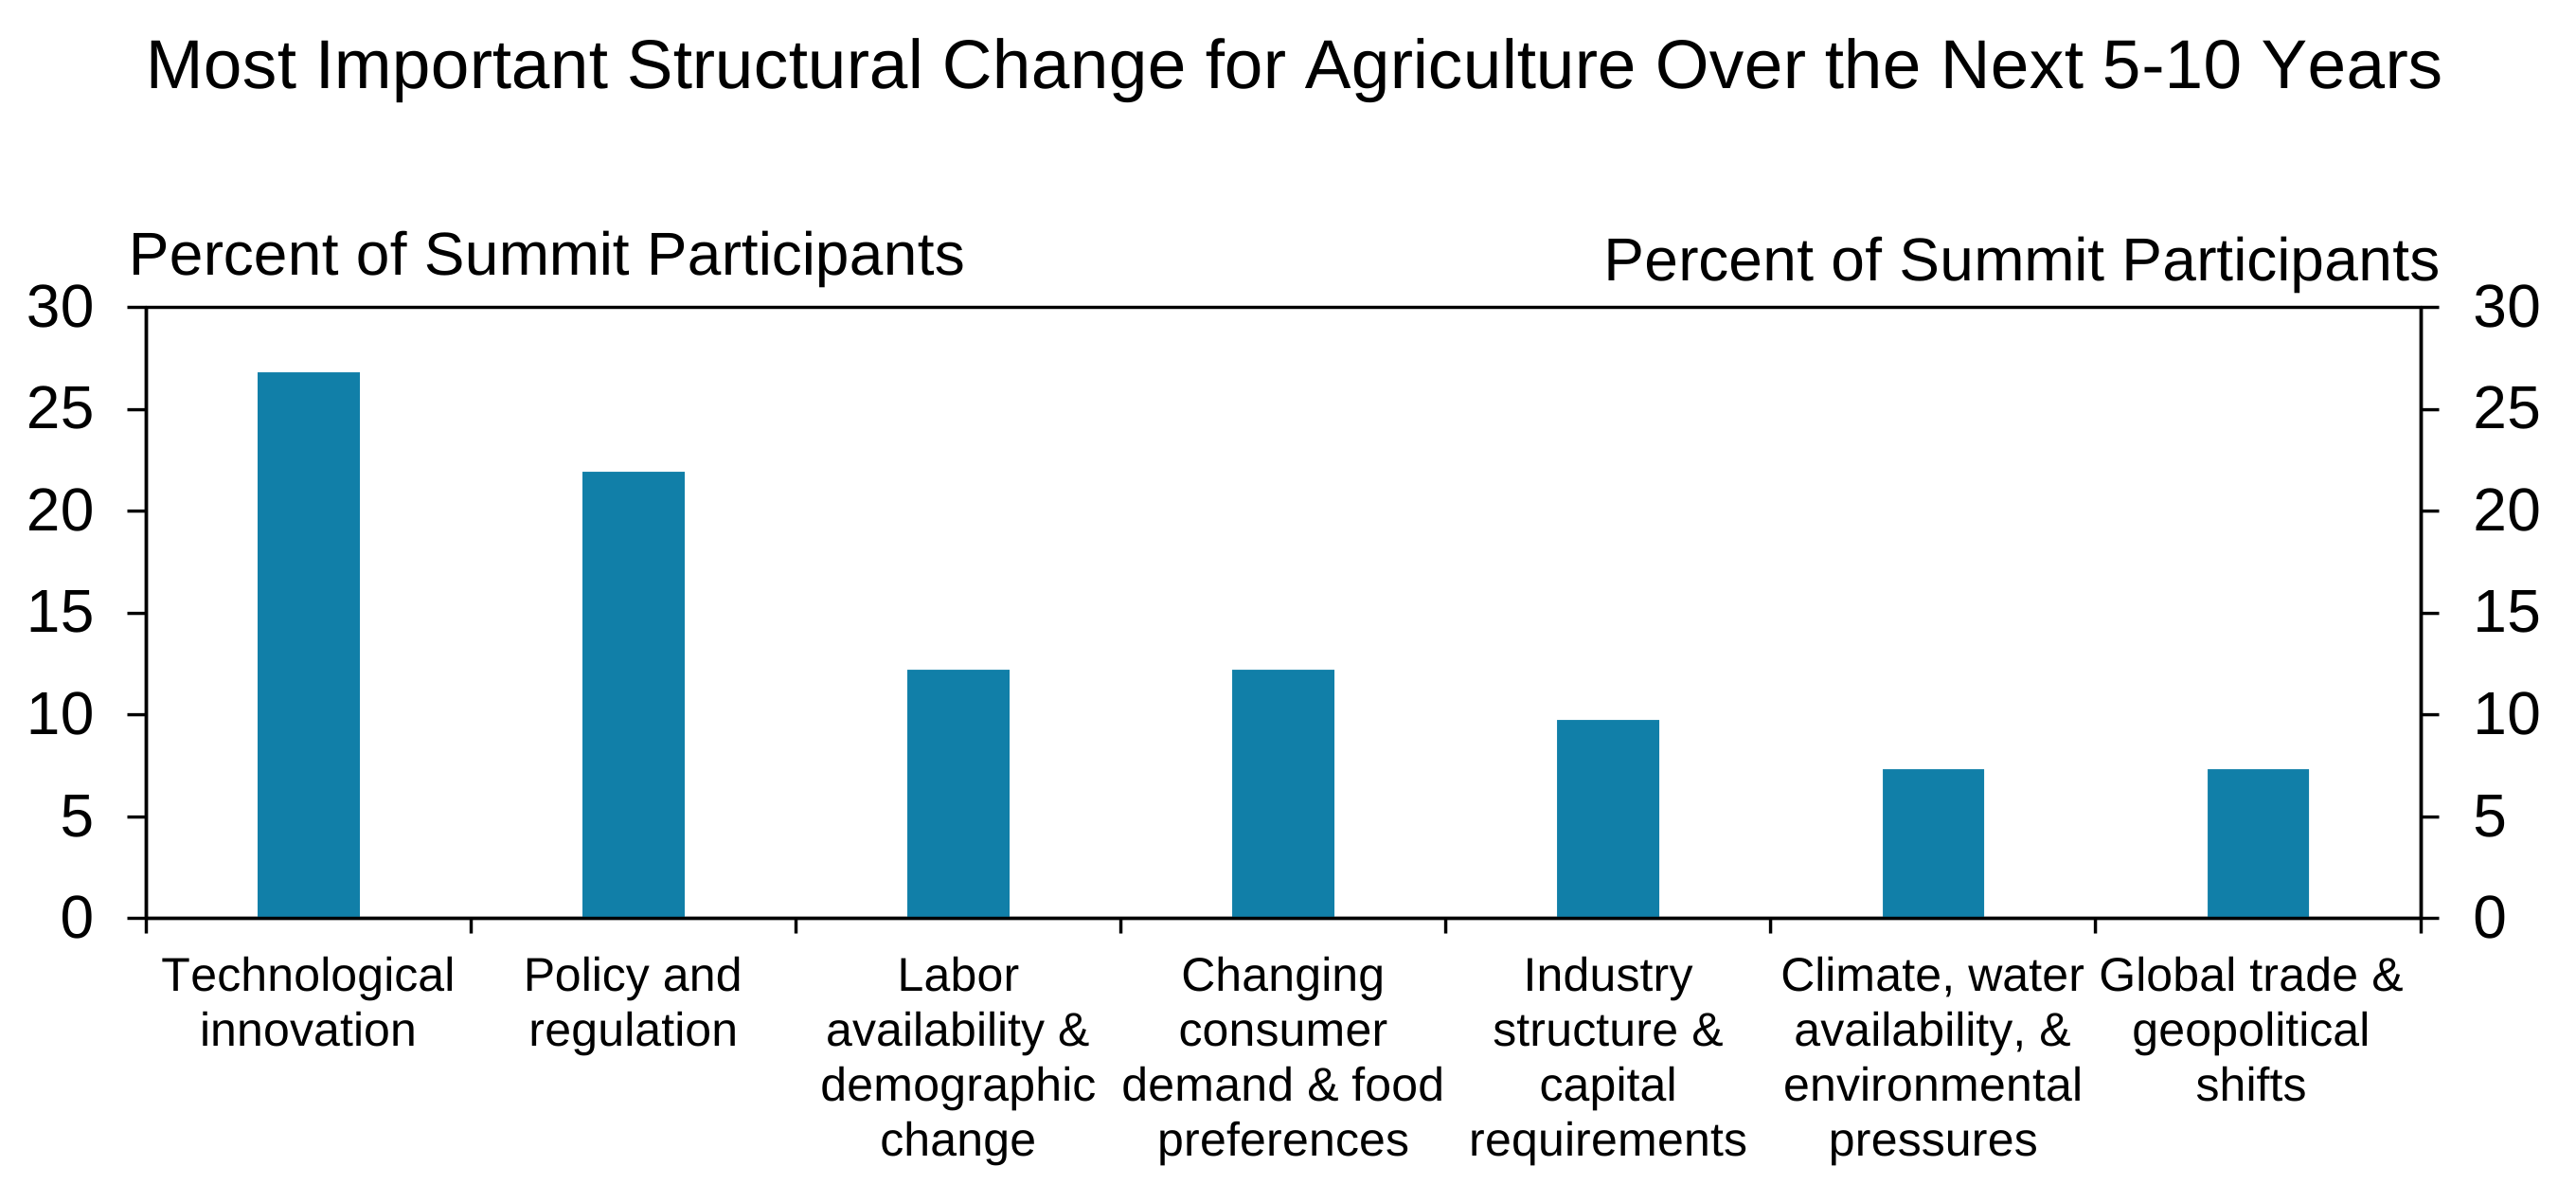
Industry experts met at the Federal Reserve Bank of Kansas City’s Agricultural Economic Summit to discuss "The Business of Agriculture Amid Structural Change." Participants discussed long-term forces shaping agricultural decision-making, supply behavior, and industry structure. Among Summit participants, the largest share thought that technological innovation would be the single most important structural change likely to affect agriculture in the next 5-to-10 years, with policy and regulation also highlighted frequently. A smaller portion anticipate other factors such as labor, demographic change, consumer preferences, capital requirements, climate, and trade and geopolitics being the most important.

A bar chart showing the percentage of participants ranking the most important structural changes for agriculture in the next 5-to-10 years. Technological Innovation (27%) and policy and regulation (22%) and are most selected, followed by labor availability and demographic change (14%). Climate, industry structure, global trade, and consumer demand each rank around 8%."

Note: Chart shows responses to the question, “Which of the following is the single most important structural change likely to shape agriculture over the next 5-10 years from the perspective of your business or industry? Select only one.” from about 50 executives and industry experts who participated in the Kansas City Fed’s Food and Agriculture Economic Summit in August 2026.

Source: Federal Reserve Bank of Kansas City

Agriculture US Agriculture

Consolidation Has Affected Availability of Rural Health Care

By John McCoy

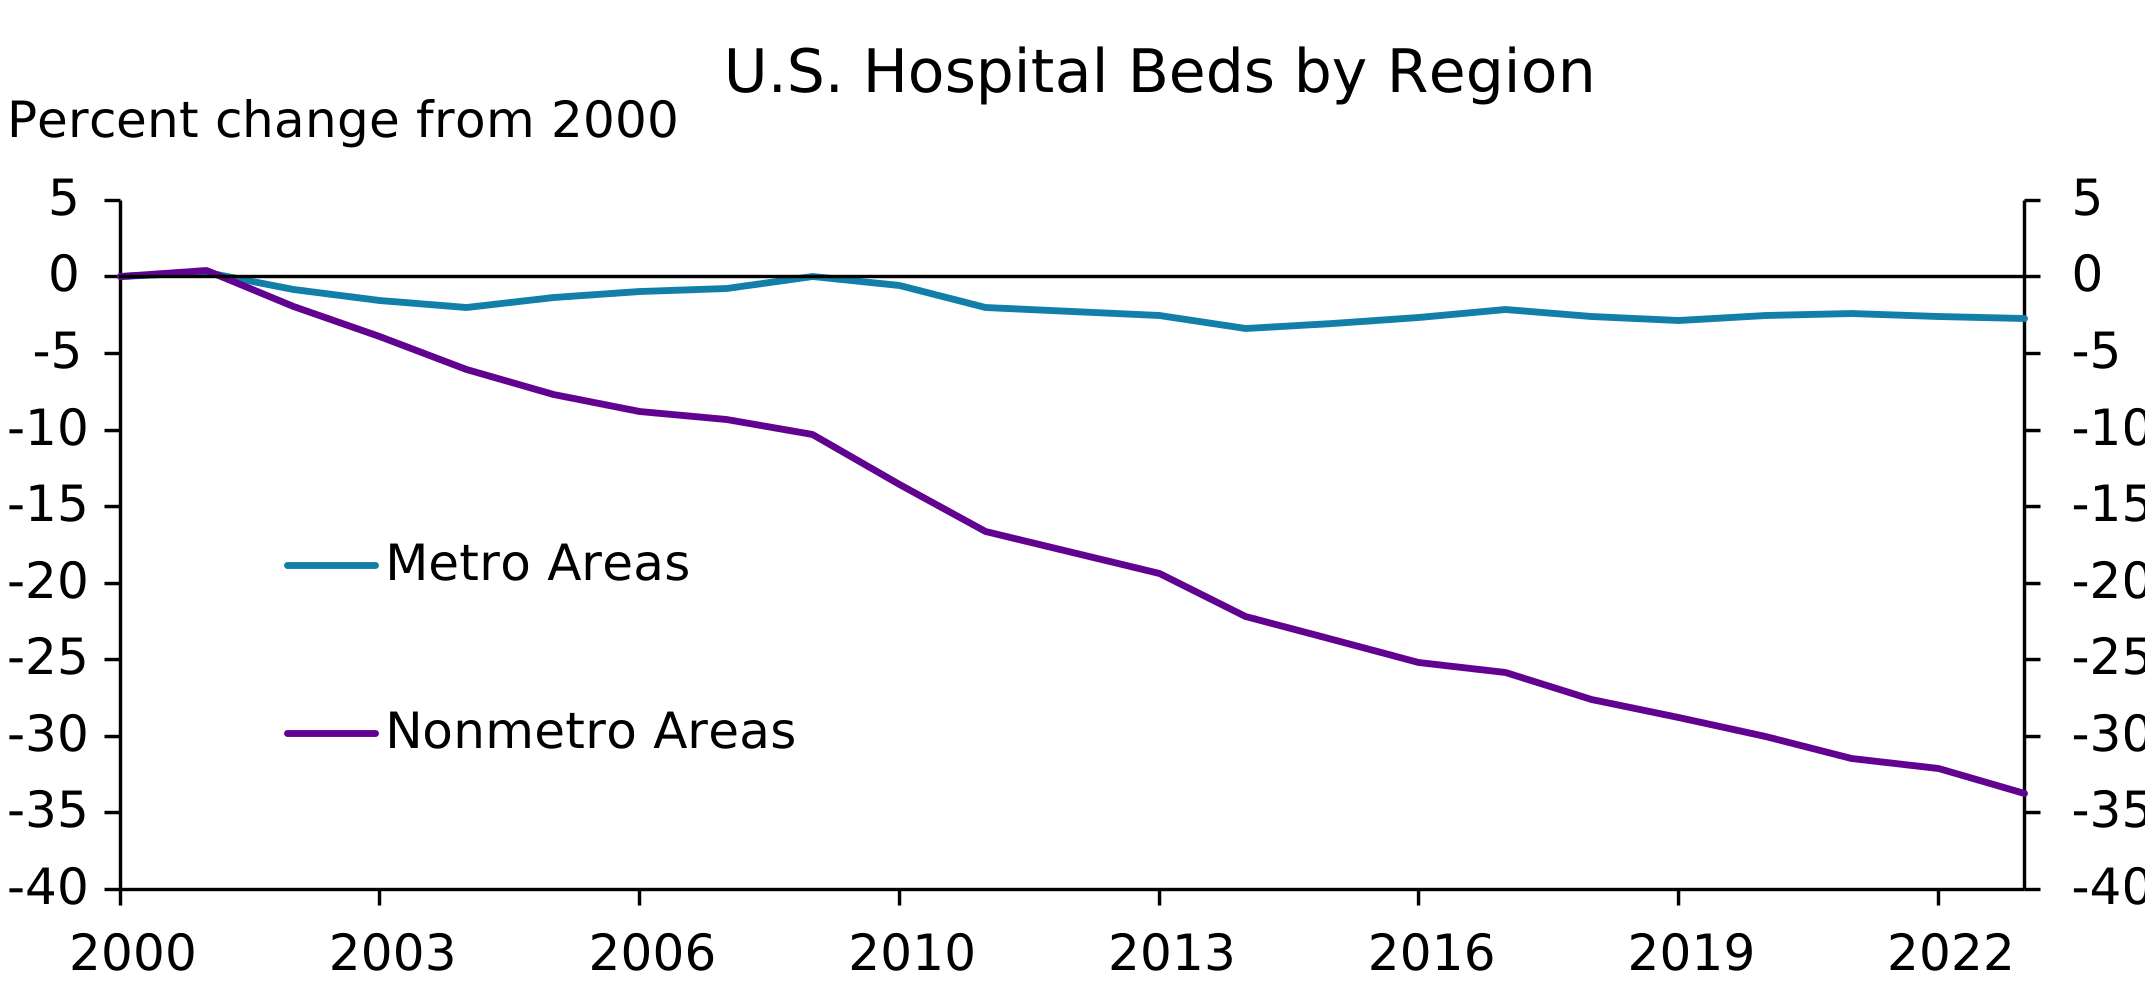
Hospitals and health systems are increasingly consolidating services, leading to fewer hospital beds available across the country. Outright closures of hospitals have remained rare, but health systems have consolidated key services units, like emergency departments or labor and delivery units. Such consolidation has been most acute in rural areas, where the number of beds has fallen by about a third since 2000 (purple line). While some evidence suggests consolidation is placing upward pressure on health care prices, increases in non-monetary costs like drive and wait times could also be particularly impactful for rural communities.

Line graph showing percent change in hospital beds from 2000 to 2022: metro areas decline by about 5%, nonmetro areas decline steeply by over 35%.

Sources: HRSA Area Health Resources File, author’s calculations.

Related Content

Nebraska Health Care Under Pressure: Increasing Costs, Consolidation, and Growing Demand

By John McCoy

Health care costs have risen substantially since the turn of the century as an aging population’s demand for medical care...

Rural Economy

Drought Intensity Adds Further Uncertainty to Cattle Herd Rebuilding

By Francisco Scott

Intense drought has the potential to limit the rebuilding of cattle herds in regions with concentrated production, driving up beef prices. Beef inflation in the U.S. has been above historical norms, increasing by 17% since the beginning of 2025, amid strong consumer demand and low inventories of cattle. Further declines in inventories may exacerbate beef and food inflation and, historically, intense droughts in cattle-producing regions have led to herd liquidation. Drought often leads to degraded pastures and reduced forage quality, increasing operational costs by forcing ranchers to supplement their animals' diets with more expensive feed. If drought in cattle-producing regions intensifies, uncertainty about the balance of costs and expected revenue may also grow, increasing the risk of further declines in cattle inventories and higher beef prices.

The chart depicts the year-over-year change in cattle inventories (blue line) and share of cattle production under extreme drought as deviation from the mean (purple line) between 2000 and 2026. The chart shows a negative association between changes in cattle inventories and changes in cattle production under drought.

Cattle Inventories and Cattle Production Under Extreme Drought

Sources: USDA, UNL Drought Monitor, author’s calculations.

Agriculture Crop and Livestock Sectors Natural Resources and Environment

Unemployment Remains Low in Rural Farm Counties

By Ty Kreitman

Despite ongoing challenges in the crop sector and tighter farm financial conditions, unemployment in rural counties most highly concentrated in farming has remained low. The rate of unemployment in farm-concentrated counties (blue line) and all other rural counties (green line) diverged in the early 2000s and that trend has persisted. The seasonally adjusted unemployment rate in farming counties was 3.8% as of May 2026, which was slightly higher than the record lows reached in 2022 but notably lower than other areas of the U.S. The contrast likely reflects differences in factors like age demographics, population growth, industry concentrations and labor market participation and has implications for labor availability in the agricultural sector and prospects for off-farm employment.

Line chart showing U.S. unemployment rates from 1990 to 2026 for three county types: Rural Counties - Farm Concentrated (dark blue), Rural Counties – Not Farm Concentrated (green), and All Urban Counties (purple). All three lines follow similar patterns: 5-8% in 1990, declining to 4-6% in late 1990s-early 2000s, rising to 8-10% during the 2008-2010 recession, falling to ~4% by 2019, then spiking dramatically to 16% (urban) and 8-10% (rural) around 2020 before declining back to 3-4%. Since the early 2000s, rural farm concentrated counties show slightly lower unemployment than all other rural counties and urban counties.

Notes: The rural and urban county distinction is based on USDA Rural-Urban Continuum Codes for metro and non-metro counties and the farm concentration distinction is based on the high farming-concentration USDA Economic Typology Code. The rural and urban classifications are based on population and connection to broader labor-market areas. Urban counties (metro) are those that have one or urban area with a population of 50,000 or more people and outlying counties that are economically tied to an urban county as measured by labor-force commuting. Rural counties (non-metro) have cities with populations of 20,000 or less and are not economically tied to an urban county. Farm concentrated rural counties have at least 20 percent of the county annual average labor and proprietors’ earnings derived from farming or at least 17 percent of the annual average number of jobs in the county derived from farming.

Source: BLS, USDA, and Federal Reserve Bank of Kansas City Staff Calculations.

Rural Economy

Corn and Soybean Price Patterns Reflect Different Stages of Their Respective Biofuel Markets

By Ayesha Cooray

Differences in the path of prices for corn and soybeans in the first half of 2026 have been, in part, due to different stages of development in their respective biofuel markets. Following a rally with the onset of conflict in the Middle East, the price of corn has fallen to a level slightly below the start of the year. The well-established role that corn plays in ethanol production creates significant co-movement with ethanol prices and, by extension, oil prices. In contrast, the price of soybeans has increased at a relatively modest and stable pace since January. With large increases in mandated biofuel production for 2026 and 2027, biomass-based diesel production capacity is expanding. Domestic soybean processing has been further bolstered by higher energy prices supporting soybean oil coupled with strong demand for its byproduct soybean meal as animal feed. While favorable planting conditions and substantial carryover from previous large harvests put downward pressure on both crop prices in late spring, expanding biomass-based diesel production likely prevented a steeper decline in the price of soybeans.

The left chart depicts the percent change in daily prices for corn (blue) and ethanol (purple) since January 2, 2026 using December futures contracts. Both prices rise concurrently to about 8% in April, then diverge with the price of ethanol rising to nearly 15% in May while the price of corn more modestly increased to 10%. Both prices fall in June- the price of ethanol falls to about 3% above its start-of-the-year price and the price of corn falling to below 3% of its start-of-the-year price. The right chart depicts the percent change in daily prices for soybeans (blue) and soybean oil (purple) since January 2, 2026 using November and December futures contracts, respectively. Since the beginning of the year, the price of soybeans (blue) has increased at a modest and stable pace from 0% to 7-12%, while the price of soybean oil (purple) demonstrates dramatic divergence, climbing to nearly 50% by late May before declining to 35% in June.

Crop Prices and Biofuel Markets

Note: Panel A depicts the percent change in the daily price from January 2, 2026 for December corn and ethanol futures. Panel B depicts the percent change in the daily price from January 2, 2026 for November soybean and December soybean oil futures.
Source: Chicago Board of Trade via Barchart.com

Related Content

Economic Review: The Expanding Role of Renewable Fuel Policy as a Demand Driver in Agriculture

By Cortney Cowley

Recent renewable energy policies may lead to higher but more volatile prices for soybeans and other oilseed crops.

Agriculture Crop and Livestock Sectors US Agriculture