Farm loan growth continued to be concentrated among agricultural banks during the first quarter of 2026 and production loans declined notably at some of the largest lenders. According to commercial bank Reports of Condition and Income, farm real estate and non-real estate debt at agricultural banks continued to grow at a steady pace, but non-real estate loans at non-agricultural banks declined even as real estate loans at those lenders increased. The pullback in production loans was concentrated among a small number of banks with farm loan portfolios larger than $1 billion. Farm loan delinquency rates were nearly unchanged from a year ago and remained relatively low, though loan performance has been weaker at large lenders in recent years. Aggregate farm financial conditions have remained resilient with support from government payments, strong cattle revenues and stable farm real estate values. However, the decline in production loans at a few large banks likely reflects caution toward ongoing crop sector challenges by some creditors and a growing concentration of lenders with specialization in agriculture.
First Quarter 2026 Commercial Bank Call Report Data
Patterns in farm debt at commercial banks remained split across agricultural and non-agricultural banks. Growth in outstanding non-real estate loans at agricultural banks remained strong in the first quarter while balances at non-agricultural banks declined for the first time since 2021 (Chart 1, left panel). After declining slightly in 2025, farm real estate debt at non-agricultural banks grew in the first months of the year and growth in real estate loans at agricultural banks was similar to recent quarters (Chart 1, right panel).
Chart 1: Farm Debt Outstanding at Commercial Banks
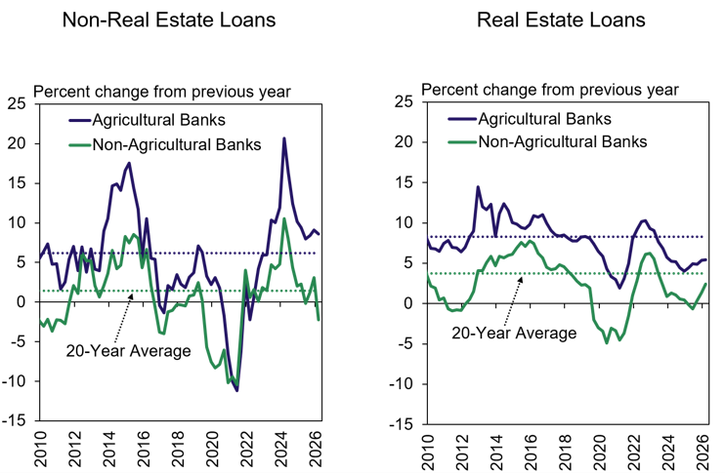
Note: Agricultural Banks are defined as banks with total agricultural loans comprising at least 25% of total loans. Figures above are calculated using the same group of 880 agricultural banks from Q1 2026 in every quarter.
Source: Reports of Condition and Income and Federal Reserve Board of Governors
The change in farm debt at non-agricultural banks was primarily driven by activity at the largest lenders. Non-real estate loan balances at banks with farm loan portfolios larger than $1 billion declined by nearly 10% from a year ago but real estate loan balances at those lenders increased nearly 10% (Chart 2). Both types of loans increased across all other size cohorts and growth was most pronounced at mid-to-large sized lenders with portfolios between $100 million and $1 billion.
Chart 2: Changes in Farm Debt Balances by Farm Loan Portfolio Size, Q1 2026
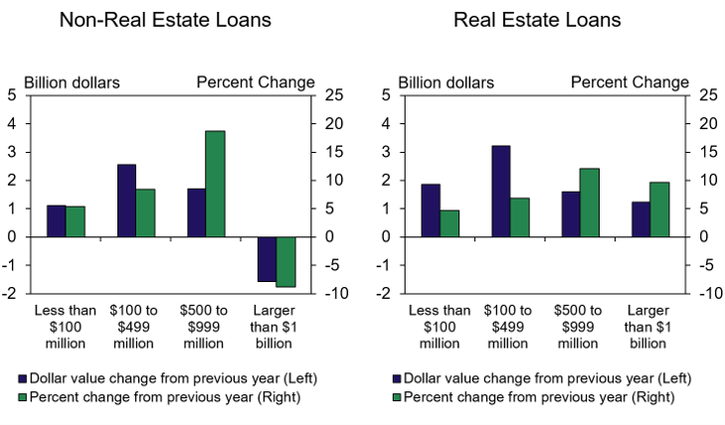
Source: Reports of Condition and Income and Federal Reserve Board of Governors
The reduction in farm debt at large banks was concentrated among a small number of institutions. Only three banks with the largest portfolios had more than a 10% decline in farm debt compared with last year (Chart 3). Across all size cohorts, more banks had an increase in farm debt than a decline and a notable portion had loan growth exceeding 10%.
Chart 3: Distribution of Year-Over-Year Change in Farm Debt by Farm Loan Portfolio Size, Q1 2026
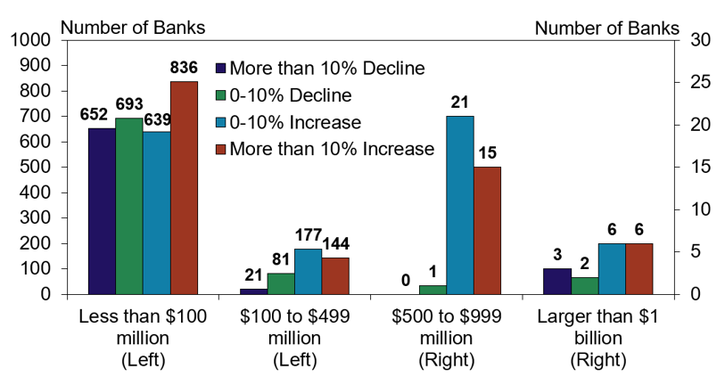
Note: The figures are calculated using only banks that reported an agricultural loan balance during Q1 2025.
Source: Reports of Condition and Income and Federal Reserve Board of Governors
Farm production debt among large banks declined as delinquency rates among those lenders remained somewhat higher. Similar to the same time last year, about 2% of farm loans at the largest agricultural banks were past due at least 30 days and that share was less than 1.5% for all other size cohorts (Chart 4). While delinquency rates remained relatively low overall, large lenders have maintained a problem loan rate higher than banks of other sizes for the past two decades and some may have limited growth in agricultural lending in response to ongoing challenges with loan performance.
Chart 4: Farm Loan Delinquency Rates by Farm Loan Portfolio Size, Q1
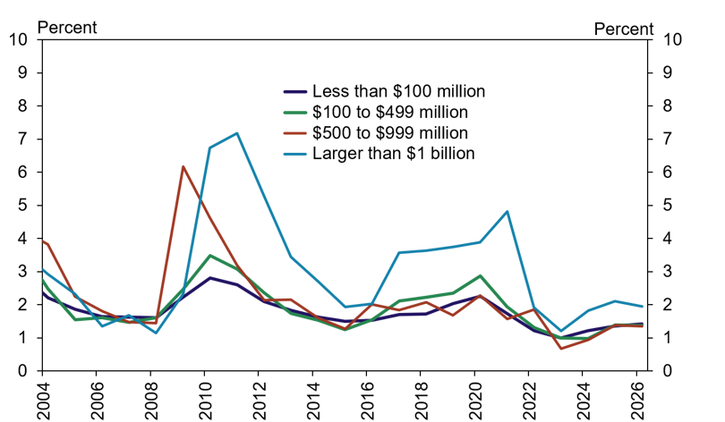
Note: Delinquent farm loans include all agricultural loans past due 30 or more days or non-accruing.
Source: Reports of Condition and Income and Federal Reserve Board of Governors
Uncollected farm debt also remained higher among the cohort of the largest agricultural lenders. The charge-off rate on agricultural loans for the largest banks declined slightly in the first quarter of 2026 after increasing to an average of about 0.25% in mid-2025 (Chart 5). Charge-offs for all other size cohorts increased slightly in the first quarter but remained negligible and likely reflect the write-off of a small portion of loans that have been unpaid for an extended period.
Chart 5: Farm Loan Charge-Off Rates by Farm Loan Portfolio Size
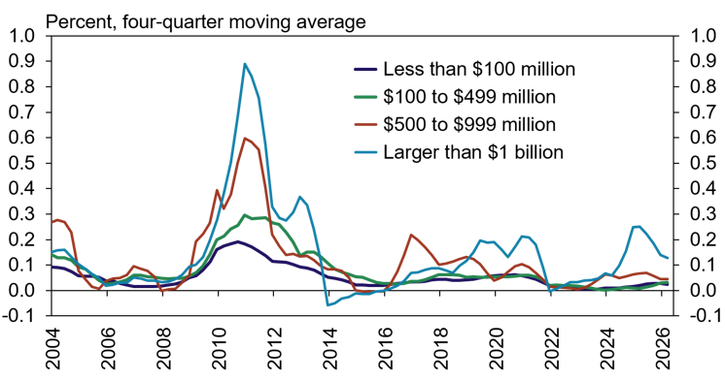
Note: The charge-off rate is calculated as charge-offs on farm real estate and production loans divided by total outstanding farm real and production loans balances. Values below zero signify a recovery.
Source: Reports of Condition and Income and Federal Reserve Board of Governors
Commercial Bank Call Report Historical Data
Commercial Bank Call Report Data Tables
External LinkAbout Commercial Bank Call Report Data
The views expressed are those of the authors and do not necessarily reflect the positions of the Federal Reserve Bank of Kansas City or the Federal Reserve System.
Author
