
Following a period of moderation, grocery prices in the United States started to tick up again in 2026 amid strong consumption by U.S. buyers and supply disruptions in trade and energy markets. As Chart 1 shows, food-at-home inflation reached nearly 3 percent in April 2026, well above its pre-pandemic average rate of 2 percent (dashed line). Processed foods and meats (purple and blue bars) have driven the increase. Some of the same pressures that have affected goods inflation broadly, such as strong demand, trade disruptions, and higher energy costs, can explain processed foods inflation (Cowley and Scott 2022). However, structural issues in domestic food supply chains, particularly for beef, have also driven increases in grocery prices, with higher beef prices accounting for most of the rise in meats inflation.
Chart 1: Food-at-home inflation has risen in 2026
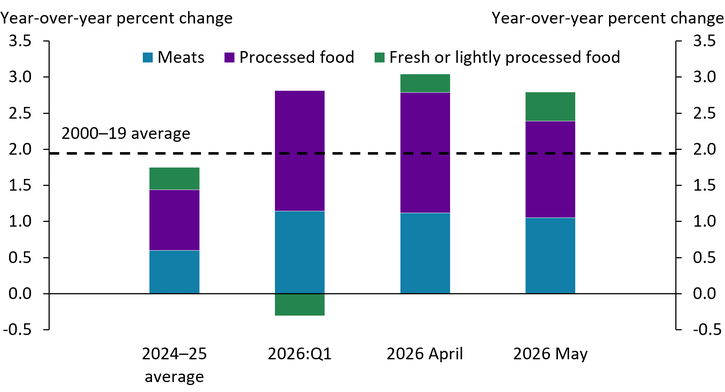
Notes: “Processed food” includes cereal and baked goods, cheese, ice cream, other dairy products, processed fruit and vegetables, beverages, and the category “other food at home.” “Fresh and lightly processed food” includes eggs, milk, and fresh produce. “Meats” includes all meat products.
Sources: U.S. Bureau of Economic Analysis (Haver Analytics) and author’s calculations.
Prices for beef have risen as U.S. consumption of beef has increased and domestic production has contracted. Chart 2 shows that despite beef price increases, beef consumption in the United States is expected to be 8 percent higher in 2026 than its average over the last 20 years, likely due to strong U.S. consumer demand for proteins in general and a high affinity for beef in particular (Bina, Tonsor, and Richards 2026; Tonsor and Lusk 2022). In contrast, domestic beef production is projected to decline in 2026 from historical averages. While imports have closed the gap between domestic production and consumption, higher domestic beef prices indicate that imports have not been cheap enough to put considerable downward pressure on beef inflation._
Chart 2: In 2026, domestic beef consumption is expected to increase and domestic beef production to decline from historical averages
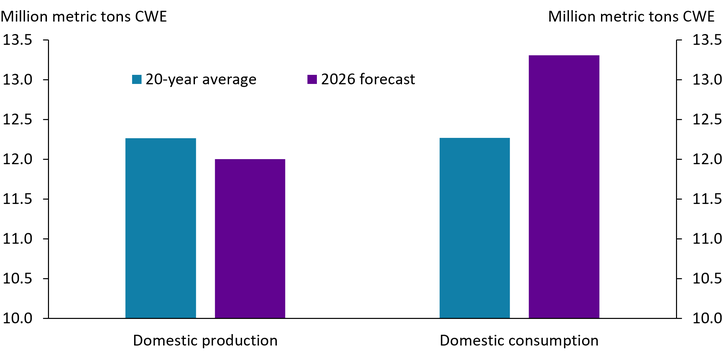
Note: CWE refers to carcass weight equivalent, a standardized measurement used by the meat industry to determine the total weight of meat cuts.
Sources: USDA and author’s calculations.
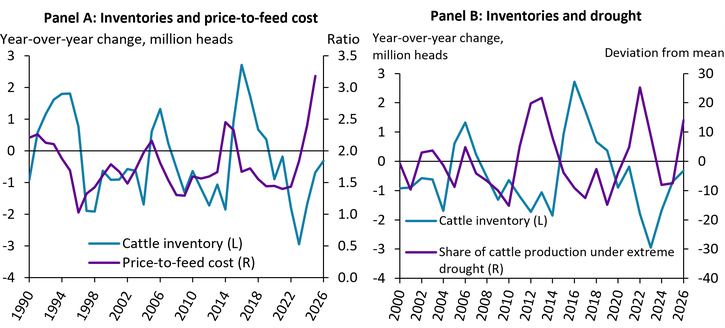
Domestic beef production has declined alongside lower cattle inventories, which have not expanded recently despite favorable market conditions for cow-calf operations._ Cattle inventories are the number of cattle held by cow-calf operations (where calves are raised) and feedlots (where cattle gain more weight before being sold to packing plants). Cow-calf operations typically start to rebuild their herds when their expected revenue surpasses the cost of raising cattle, often approximated by the ratio of cattle prices to feed costs. Panel A of Chart 3 shows that, historically, cattle inventories (blue line) have increased roughly one year after the cattle price-to-feed ratio increases above historical averages (purple line). Since 2021, however, the ratio has been above averages and cattle herds have only continued to shrink.
Chart 3: Cattle inventories are affected by yearly changes in prices and drought conditions
Sources: USDA, UNL Drought Monitor, and author’s calculations.
Higher cattle costs alongside weather disruptions and the threat of disease may explain the lack of herd rebuilding in recent years. Panel B of Chart 3 shows that periods of abnormal drought in cattle-producing regions, as experienced in the United States in 2012, 2022, 2023, and 2026, have historically increased the likelihood of herd liquidation. Drought often leads to degraded pastures and lower forage quality, increasing the operational costs of raising cattle and leading farmers to shrink their operations. The recent reintroduction of the New World screwworm, a potentially fatal parasite that affects cattle herds, has also increased risks for cow-calf operations. With the average price of cows, steers, and heifers used for herd replacement up 100 percent from the 20-year average, ranchers may be hesitant to invest in the costly expansions needed to grow their herds.
Looking ahead, beef inflation could ease if herds expand or increase if further disruptions affect supply. Cattle production takes time; historically, cattle inventories have started to grow about two to three years after ranchers begin retaining heifers for breeding purposes (known as replacement heifers). Panel A of Chart 4 shows that the number of replacement heifers (purple line) has risen slightly in 2026, suggesting ranchers may be starting to expand their herds. If uncertainty around the conditions for raising cattle increases, however, ranchers may stall herd expansion by selling those heifers to feedlots for eventual slaughter. Panel B shows that an unexpected economic shock leading to a 1 percent increase in heifers being fed for slaughter leads to lower beef prices initially, but such a shock ultimately results in a 0.6 percent increase in prices for beef two years later.
Chart 4: Supply of replacement heifers affects cattle inventories and beef prices
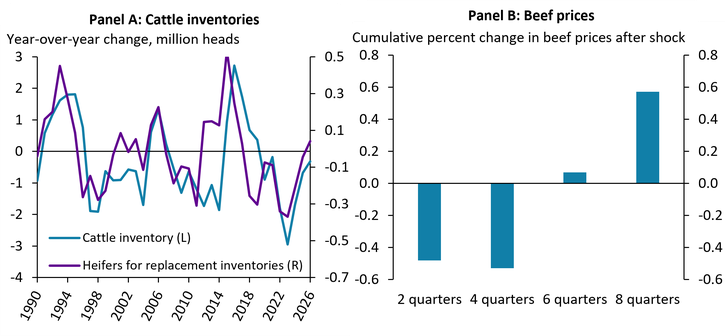
Notes: Panel B uses quarterly data on heifers on feed and the Consumer Price Index for beef and veal to construct the cumulative response of beef prices to a 1 percent unexpected increase in the inventory of heifers being fed for slaughter.
Sources: USDA, U.S. Bureau of Labor Economics, and author’s calculations.
Strong demand for beef and constrained domestic supply has driven up beef inflation in 2026. Absent any changes in demand for beef, steady cattle herd expansion that would guarantee the future supply of beef to U.S. consumers could help soften price increases. However, historical data suggests that current, early signs of rebuilding could stall amid the high costs of herd expansion and heightened uncertainty in cattle production. If ranchers decide to liquidate their herds further, beef inflation may remain high for some time.
Endnotes
-
1 The contraction in beef domestic production differs from trends observed in beef substitutes such as chicken and pork, for which domestic production has increased in tandem with domestic consumption.
-
2 Over the long term, cattle production has trended toward increasing productivity and lower cattle herds (for example, finishing cows at higher weights).
Article Citation
Scott, Francisco. 2026. “High Costs and Uncertainty Will Likely Keep Cattle Inventories Low and Beef Prices Elevated for Some Time.” Federal Reserve Bank of Kansas City, Economic Bulletin, August 5.
References
Bina, Justin D., Glynn T. Tonsor, and Timothy J. Richards. 2026. “External LinkGLP-1 Use and Protein Demand.” Food Policy, vol. 138, no. 103026.
Cowley, Cortney, and Francisco Scott. 2022. “Commodity Prices Have Limited Influence on U.S. Food Inflation.” Federal Reserve Bank of Kansas City, Economic Bulletin, September 23.
Tonsor, Glynn T., and Jayson L. Lusk. 2022. “External LinkU.S. Perspective: Meat Demand Outdoes Meat Avoidance.” Meat Science, vol. 190, no. 108843.
Francisco Scott is a senior economist at the Federal Reserve Bank of Kansas City. The views expressed are those of the author and do not necessarily reflect the positions of the Federal Reserve Bank of Kansas City or the Federal Reserve System.
Author