In July 2022, food prices in the United States had increased by almost 11 percent year-over-year, the fastest pace in more than 40 years. Although food accounts for about 15 percent of U.S. household spending on average, food prices are generally excluded from measures of core inflation. Historically, one of the main reasons offered for this exclusion is that food prices, like energy prices, are volatile and highly influenced by specific supply shocks (Gordon 1975). However, over the last 20 years, food prices have been much less volatile than energy prices. Chart 1 shows that since 2000, energy prices (green line) have fluctuated widely, declining by as much as 30 percent or increasing by almost 45 percent within a single year. Conversely, food prices (blue line) have fluctuated much more modestly, ranging from a 2 percent annual decline in 2009 to the 11 percent annual increase in 2022.
Chart 1: Food inflation has been more stable than energy inflation in recent decades
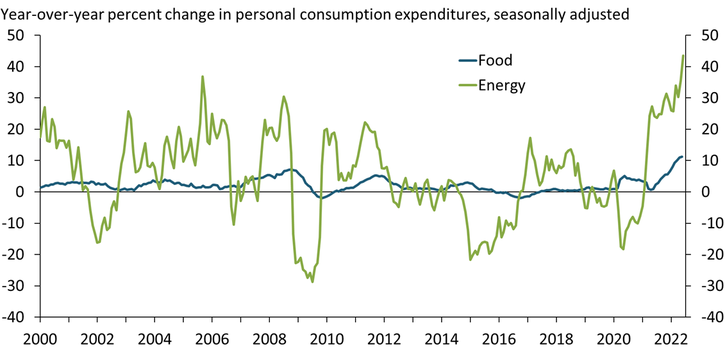
Note: According to the U.S. Bureau of Economic Analysis (BEA), which compiles and reports personal consumption expenditures, “food” consists of food and beverages purchased for off-premises consumption. Food services, which include purchased meals and beverages, are not classified as food.
Source: BEA.
Moreover, food prices have also been much less volatile than agricultural commodity prices over the past 20 years, suggesting that the pass-through from changes in commodity prices to overall food price inflation may be limited. Chart 2 shows that since 2000, dramatic changes in prices for commodities such as corn (blue line) and wheat (green line) have typically been followed by much smaller and lagged changes in prices for food consumed at home (orange line)._ Although the relationship between commodity and food prices may be stronger for certain products—for example, increasing wheat prices may lead to increasing bread prices—the overall pass-through from commodity prices to food prices has been weak.
Chart 2: Dramatic changes in commodity prices have had limited effects on food prices
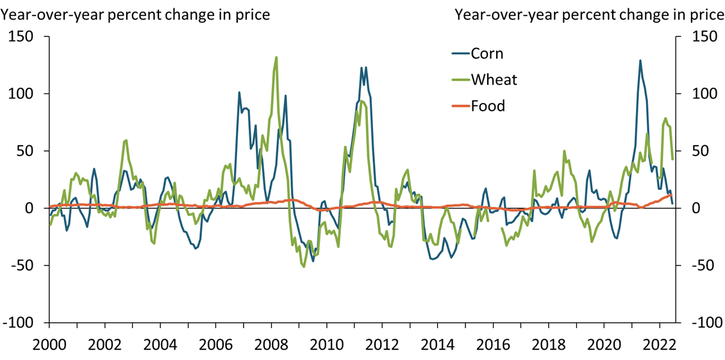
Note: According to the BEA, “food” consists of food and beverages purchased for off-premises consumption. Food services, which include purchased meals and beverages, are not classified as food.
Sources: BEA and The Wall Street Journal (Haver).
Instead, changes in consumer income and behavior may have had a bigger influence on food prices, particularly during the pandemic. Increases in income can boost consumption of certain foods: for example, Lusk and Tonsor (2016) and Cowley (2020) highlight a strong positive relationship between income and meat consumption in the United States._ Although personal income typically declines during recessions, putting downward pressure on meat consumption, household income actually rose during the pandemic-induced recession. So, too, did household consumption of meat (among other products), putting upward pressure on food prices.
Shifting consumer behaviors have also contributed to the surge in food prices at grocery stores over the last two years. Chart 3 shows that since 2009, households have spent more money on food prepared away from home (such as at restaurants and other food service establishments) than on food prepared at home (such as groceries). The onset of the pandemic reversed this trend: although consumers still spent more on restaurant meals than groceries in 2020, their spending on food at home increased substantially due to lockdowns, travel restrictions, reduced hours or closures at restaurants and other food service establishments, health concerns, and general uncertainty related to the pandemic. This increased demand for food at grocery stores, discount stores, and convenience stores likely contributed to higher food prices for consumers.
Chart 3: The composition of food expenditures whipsawed during the pandemic
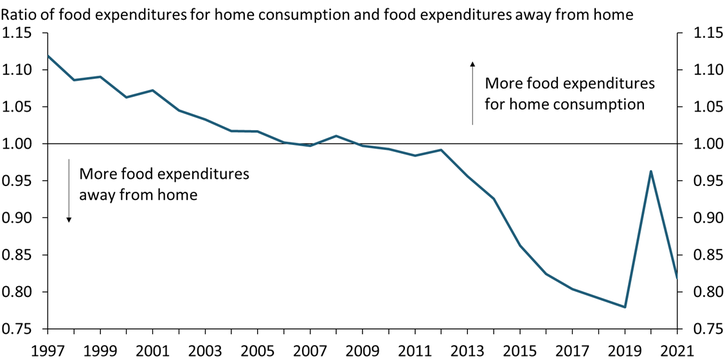
Notes: The U.S. Department of Agriculture (USDA) supplements the BEA’s estimates for expenditures on Food Away from Home. A comprehensive list of differences is found in Okrent and others (2018).
Sources: USDA and authors’ calculations.
In 2021, alongside easing COVID-19 restrictions and a greater appetite for food prepared away from home, consumers once again shifted the majority of their food spending back toward restaurants. Although the share of spending on food at grocery stores remains above pre-pandemic levels, the sharp decline in this ratio in 2021 suggests demand for food purchased at grocery stores is softening. Recent data from Information Resources Inc. and the U.S. Department of Agriculture (USDA) on purchases at grocery stores support this view. Consumers have reduced their consumption of several products relative to pre-pandemic levels, indicating some consumer response to high food prices. For example, the price of eggs is about 60 percent above its pre-pandemic level and the quantity of eggs consumed has declined by almost 15 percent._
In addition to changes in consumer income and behavior, higher costs of labor, transportation, and rents have likely contributed substantially to food inflation. The top portion of Chart 4 shows the input costs associated with a dollar spent on food at home. For each dollar spent on food (the length of the bar), 45 cents go toward salaries and benefits of workers across the food supply chain (blue section), while 37 cents go toward property costs such as rent on different assets (green section). A smaller share goes toward other costs, such as output taxes and import costs (orange section). This composition of input costs for each dollar of food suggests that increases in wages and rents can push food prices up substantially.
Chart 4: The production of farm commodities makes up a small share of every dollar spent on food
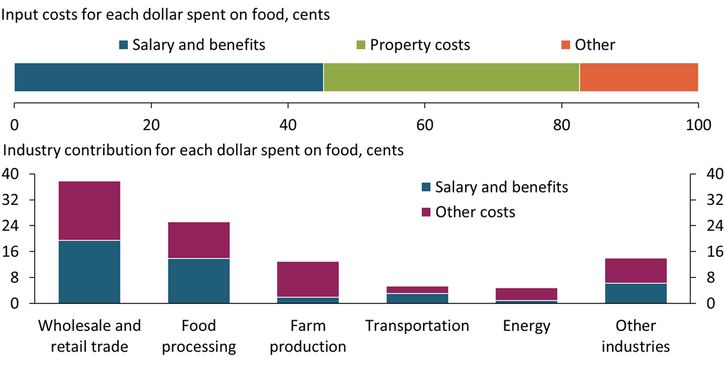
Note: The sum of the added value from all components in each panel equals the total food dollar.
Sources: USDA and authors’ calculations.
Input costs are largely allocated to the food processing, wholesale trade, and retail trade stages of the supply chain._ Notably, the bottom part of Chart 4 also shows that farm production, which reflects the contribution from agricultural commodity prices, makes up only a small share of the cost of food consumed at home. Instead, wholesale and retail trade account for almost 40 cents of every dollar spent on food at grocery stores, while food processing accounts for more than 25 cents. In other words, sectors that process, pack, distribute, and sell food contribute the majority of the cost that consumers pay at grocery stores. Moreover, labor costs are substantial in these sectors, suggesting that an easing in wage growth in these stages of the supply chain could help to put a dent in food inflation.
In conclusion, food prices have been relatively stable historically but have increased notably in the aftermath of the global pandemic. Recent declines in commodity prices may do little to ease the prices consumers pay for food. Instead, lower wage and rent inflation alongside a slowdown in demand at grocery stores could put some downward pressure on food inflation. However, if broader measures of inflation do not abate, food inflation could remain elevated.
Download Materials
Endnotes
-
1 We focus on prices of food at home because they represent a larger relative importance of overall food inflation, have been the primary driver of overall food inflation in the aftermath of the pandemic, and are more salient to consumers when compared with prices of food away from home.
-
2 An additional chart showing the relationship between meat consumption and income is available in an online data supplement.
-
3 An additional chart showing the prices and quantities of eggs sold at retail since January 2020 is available in an online data supplement.
-
4 The definitions used by the USDA state that wholesale trade refers to all non-retail establishments reselling products to other establishments for the purpose of contributing to the U.S. food supply and all subcontracting establishments. Retail trade refers to all food retailing and related establishments and all subcontracting establishments.
Cortney Cowley is a senior economist at the Federal Reserve Bank of Kansas City. Francisco Scott is an economist at the bank. The views expressed are those of the authors and do not necessarily reflect the positions of the Federal Reserve Bank of Kansas City or the Federal Reserve System.
References
Cowley, Cortney. 2020. “External LinkCOVID-19 Disruptions in the U.S. Meat Supply Chain.” Federal Reserve Bank of Kansas City, Ag Outlook, July 31.
Gordon, Robert J. 1975. “External LinkAlternative Responses of Policy to External Supply Shocks.” Brookings Papers on Economic Activity, vol. 1975, no. 1, pp. 183−206.
Lusk, Jayson L., and Glynn T. Tonsor. 2016. “External LinkHow Meat Demand Elasticities Vary with Price, Income, and Product Category.” Applied Economic Perspectives and Policy, vol. 38, no. 4, pp. 673−711.
Okrent, Abigail M., Howard Elitzak, Timothy Park, and Sarah Rehkamp. 2018. “External LinkMeasuring the Value of the US Food System: Revisions to the Food Expenditure Series.” U.S. Department of Agriculture Economic Research Service, Technical Bulletin No. 1948, September.
The views expressed are those of the authors and do not necessarily reflect the positions of the Federal Reserve Bank of Kansas City or the Federal Reserve System.
Authors

Cortney Cowley
Assistant Vice President and Oklahoma City Branch Executive