
Farm income and credit conditions continued to deteriorate in the second quarter but showed signs of easing. According to lenders participating in Federal Reserve Surveys of Agricultural Credit Conditions, the pace of decline in farm loan repayment rates and farm income slowed slightly in recent months. Despite a slower pace of weakening, lenders continued to gradually tighten collateral requirements as challenges for crop producers persisted. Slightly higher crop prices in the second quarter and the recent distribution of payments from the Farmer Bridge Assistance Program likely contributed to the less pessimistic outlook. Further supporting financial conditions, farmland values remained strong and continued to bolster borrower balance sheets.
Second Quarter Federal Reserve District Ag Credit Surveys
Deterioration in loan performance continued but showed signs of moderating during the first half of 2026. The average pace of decline in farm loan repayment rates over the past four quarters slowed across all participating Districts during the second quarter (Chart 1). In the Minneapolis and St. Louis Districts, the share of lenders reporting that repayment rates were lower than a year ago dropped from an average of around 50% in 2025 to about 30% in the most recent survey.
Chart 1: Farm Loan Repayment Rates
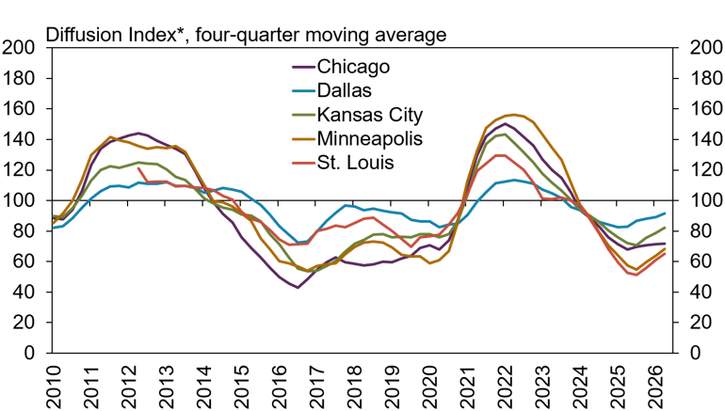
*Lenders responded by indicating whether conditions during the current quarter were higher than, lower than, or the same as in the year-earlier period. The index numbers are computed by subtracting the percentage of survey respondents who responded "lower" from the percentage who responded "higher" and adding 100.
Note: The St. Louis survey began in Q2 2012.
Source: Federal Reserve Surveys of Agricultural Credit Conditions
The decline in loan repayment rates slowed alongside less rapid tightening in farm finances. Farm income continued to soften but the pace of decline eased in recent quarters across all participating Districts (Chart 2). The share of lenders reporting that farm income was less than a year ago in the Minneapolis and St. Louis Districts dropped from an average of around 90% in 2025 to about 60% in the most recent survey. Financial challenges remained less pronounced in the Kansas City District where cattle revenues have been particularly supportive.
Chart 2: Farm Income
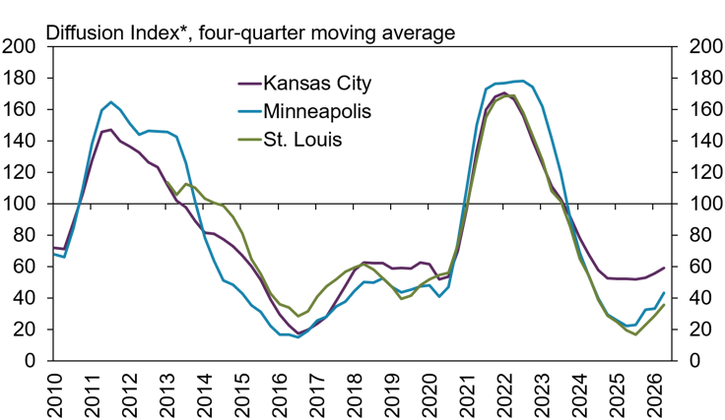
*Lenders responded by indicating whether conditions during the current quarter were higher than, lower than, or the same as in the year-earlier period. The index numbers are computed by subtracting the percentage of survey respondents who responded "lower" from the percentage who responded "higher" and adding 100.
Note: Information about farm income and borrower spending is only collected for the above Districts. The St. Louis survey began in Q2 2012.
Source: Federal Reserve Surveys of Agricultural Credit Conditions
Alongside gradual weakening in farm finances, credit standards continued to tighten steadily. The pace of increase in collateral requirements was similar to recent quarters in most regions and was most pronounced in the St. Louis District (Chart 3). Nearly 30% of lenders in the St. Louis District reported that collateral requirements for farm borrowers were higher than a year and that share was about 20% in all other regions.
Chart 3: Collateral Requirements
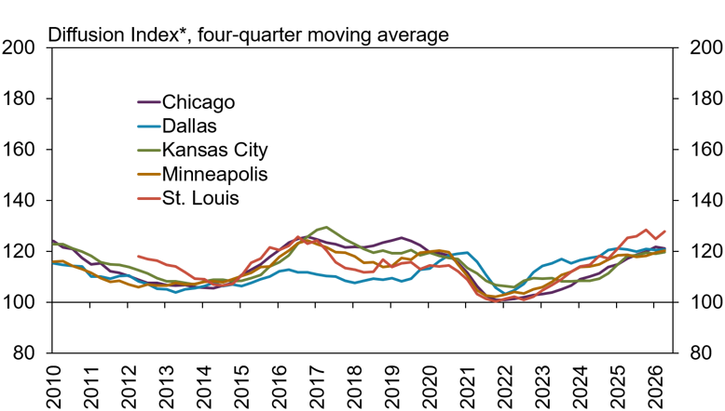
*Lenders responded by indicating whether conditions during the current quarter were higher than, lower than, or the same as in the year-earlier period. The index numbers are computed by subtracting the percentage of survey respondents who responded "lower" from the percentage who responded "higher" and adding 100.
Note: The St. Louis survey began in Q2 2012.
Source: Federal Reserve Surveys of Agricultural Credit Conditions
Despite persistent tightening in farm financial conditions, agricultural real estate values remained strong and continued to provide support to many borrowers. The value of nonirrigated cropland across all regions increased by an average of about 2.5% from the previous year during the second quarter (Chart 4, left panel). Despite softer conditions in farmland markets during the past two years, values remained more than 50% higher than in 2020 across most regions and more than 80% higher in the Dallas District.
Chart 4: Nonirrigated Cropland Values
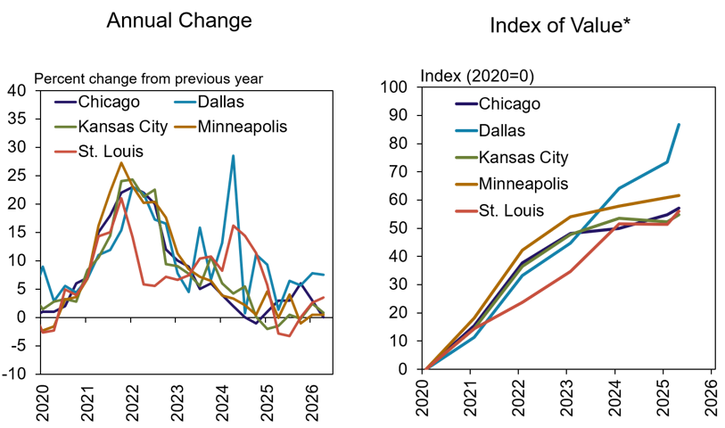
*Calculated using the average annual year-over-year percent change
Source: Federal Reserve Surveys of Agricultural Credit Conditions
Commercial Bank Call Report Historical Data
Commercial Bank Call Report Data Tables
External LinkAbout Commercial Bank Call Report Data
The views expressed are those of the authors and do not necessarily reflect the positions of the Federal Reserve Bank of Kansas City or the Federal Reserve System.
Author