The farm economy in Oklahoma generally has remained solid, with growth in farm income outpacing other states in the Federal Reserve’s Tenth District. External LinkIn contrast to a few years ago, historically high cattle prices have contributed to a more positive story for the agricultural sector in Oklahoma in 2026, while low crop prices and elevated expenses have led to weaker farm financial conditions in other states. Strength in Oklahoma’s agricultural economy has supported broader economic conditions and business activity. However, developments in agricultural credit conditions and farm household spending have been similar across all states. In addition, elevated input costs, particularly for fertilizer and diesel, and expanding drought remain key concerns for all producers.
Growth in the Oklahoma Farm Economy Has Outpaced the Rest of the Tenth District
Farm income in Oklahoma has remained relatively stable compared with other states in the District. In the second quarter of 2026, farm income in Oklahoma rose at a faster pace than a year ago (Chart 1). Farm incomes in the rest of the District continued to decline, albeit at a slower pace than the previous year. In Oklahoma, 50% of agricultural lenders reported that farm income was higher in the second quarter compared with last year, while only 12% reported lower farm income. At the same time, in the rest of the Tenth District only 11% of agricultural lenders reported higher farm incomes, and 57% reported that farm incomes were lower.
Chart 1. Farm income continues to grow in Oklahoma while it contracts in neighboring states.
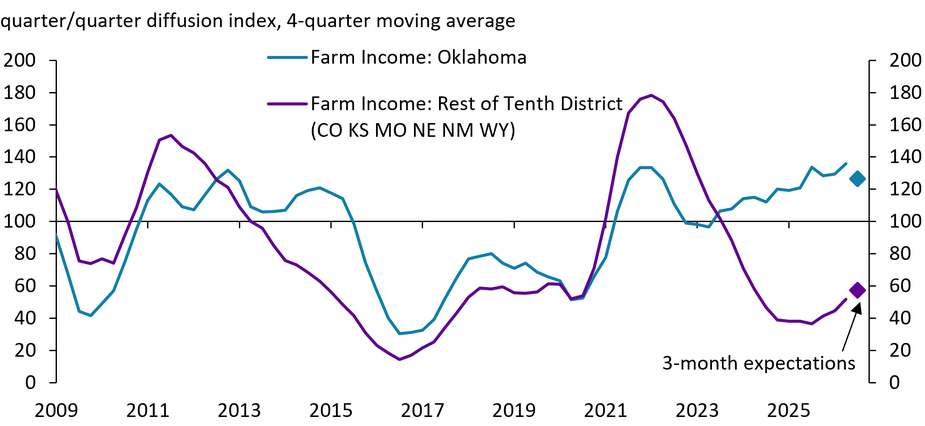
Note: The diffusion indexes represent the net percentage of firms reporting an increase from the previous quarter. Any value over 100 indicates net expansion.
Source: Federal Reserve Bank of Kansas City (FRBKC).
Stronger farm incomes have supported broader economic conditions and business activity in rural parts of Oklahoma. In the third quarter of 2025, 65% of Ag Credit Survey respondents from Oklahoma reported that recent agricultural economic conditions had a positive effect on broader economic conditions and business activity, compared with 15% who thought agricultural economic conditions were having a negative effect (Chart 2). Comparatively, only a quarter of respondents from other states in the Tenth District reported that economic conditions in agriculture were supporting broader business activity. A much larger share (64%) reported that conditions in the farm economy were having a negative effect on the broader economy.
Chart 2. Stronger farm income in Oklahoma has supported broader economic conditions
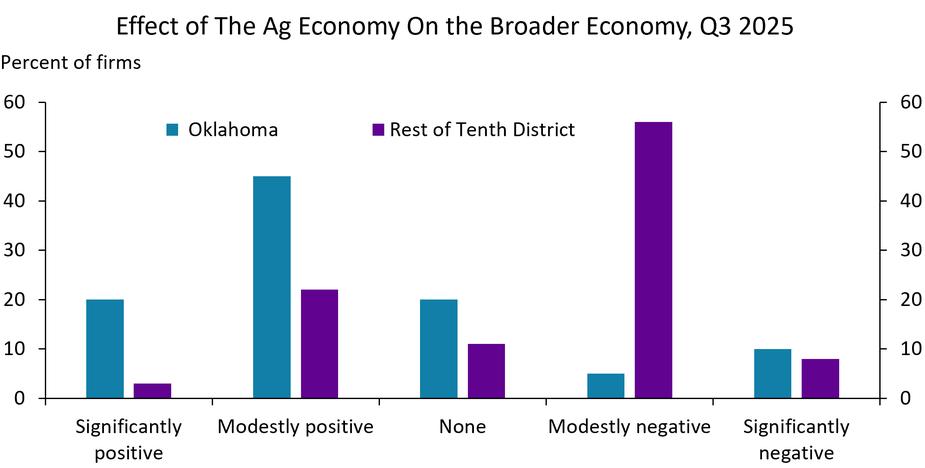
Note: Agricultural lenders were asked “How have recent agricultural economic conditions affected broader economic conditions and business activity in your lending area?”
Source: FRBKC.
Strength in the Cattle Industry Has Supported Oklahoma’s Farm Economy
Farm and rural economies in Oklahoma have been supported by stronger profit margins in the cattle industry, while profit margins have remained tighter for crop producers. Input costs for all producers rose dramatically in the aftermath of the pandemic and have remained elevated. Following Russia’s invasion of Ukraine in February 2021, prices for crops, including wheat and cotton, rose sharply, creating the best profit opportunities for Oklahoma crop producers in years (Chart 3, Panel A). However, since 2022, profit opportunities for both wheat and cotton have been scarce. Conversely, the margin between cattle prices and average production costs has continued to expand (Chart 3, Panel B). Indeed, Oklahoma’s inflation-adjusted farm income reached its highest level in more than 50 years in 2025, amid elevated cattle prices (External LinkUSDA ERS 2026).
Chart 3. Crop profits have been limited alongside elevated costs while opportunities for cattle producers have remained strong
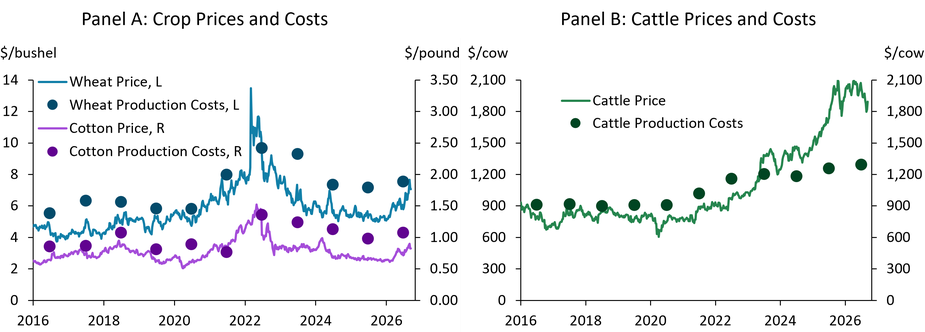
Note: Prices shown are first-expiring futures contracts.
Sources: Chicago Mercantile Exchange (CME), Wall Street Journal (WSJ), USDA (Haver Analytics).
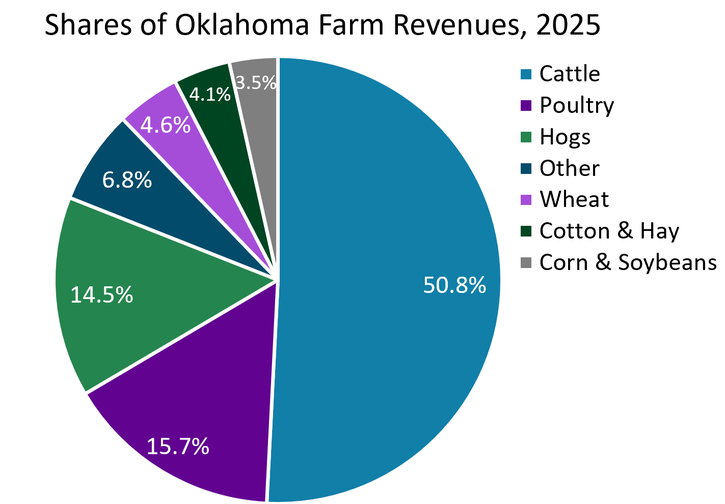
Cattle prices increased to record levels in recent years alongside External Linkhistorically low cattle inventories and strong demand for beef in the United States (Cowley 2026). At the same time, crop prices have remained much lower than their 2022 highs. In recent months, however, feeder cattle prices have fallen 20% due to announcements of higher beef imports and the closure of several slaughter facilities by large meatpacking firms. Winter wheat prices rose 20% from late June to September, due in part to dry weather, expectations of lower crop yields, and geopolitical tensions. However, cattle futures prices have started to rebound, and despite the uptick in crop prices, input prices have remained elevated, maintaining pressure on profit margins. In addition, prices for hogs and poultry products had been strong for most of 2026, but profit margins have tightened in Oklahoma’s second- and third-largest agricultural industries recently, alongside slower demand at restaurants and higher feed and fuel costs. Overall, stronger prices in the cattle sector have likely contributed to the overall strength in Oklahoma’s farm economy, where more than 50% of farm revenues are generated from cattle production (Chart 4).
Chart 4. Cattle production accounts for more than half of farm revenues in Oklahoma.
Sources: U.S. Department of Agriculture (USDA).
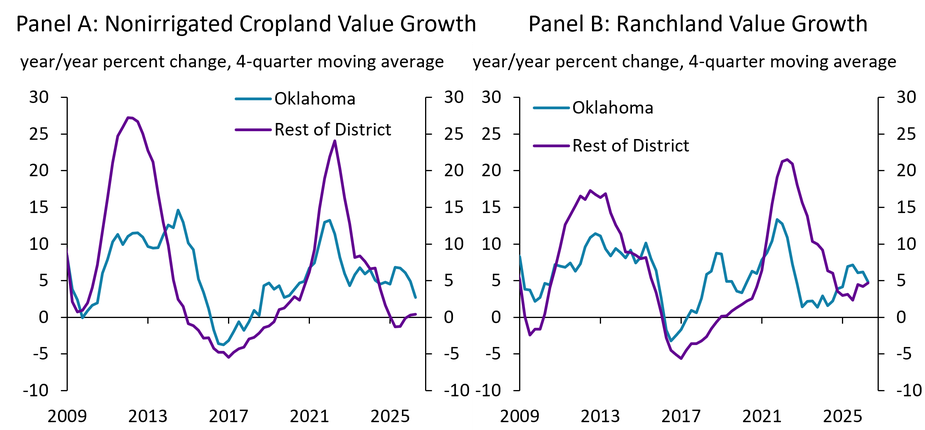
In addition, farm real estate values have been relatively more stable in Oklahoma than in other states. Farmland values in Oklahoma typically are not as volatile as in other states, and in the second half of 2025, nonirrigated cropland values in Oklahoma continued to increase by about 5% year over year, while cropland values in the rest of the district declined slightly (Chart 5, Panel A). Also, until recently, ranchland values had increased at a faster pace in Oklahoma, while growth in values for pastureland in other parts of the region slowed (Chart 5, Panel B).
Chart 5. Cropland values have held firmer in Oklahoma, but growth of ranchland values has strengthened in the rest of the District
Source: FRBKC.
Farmland values in Oklahoma and the surrounding region have continued to grow, despite declining rates of return. Over the past four years, risk-free rates of return have increased with interest rates and outpaced capitalization rates on nonirrigated cropland, which have declined to below 3% (Chart 6). This trend is a reversal from previous decades, when capitalization rates for farmland were higher than returns on other investments. Stable land values have provided some financial stability in the agricultural sector. External LinkIn the longer term, continued appreciation of values has continued to position farmland as an attractive investment for farmers and investors (Kreitman 2026b).
Chart 6. Returns on farmland remain lower than in rest of the District and below risk-free rates of return.
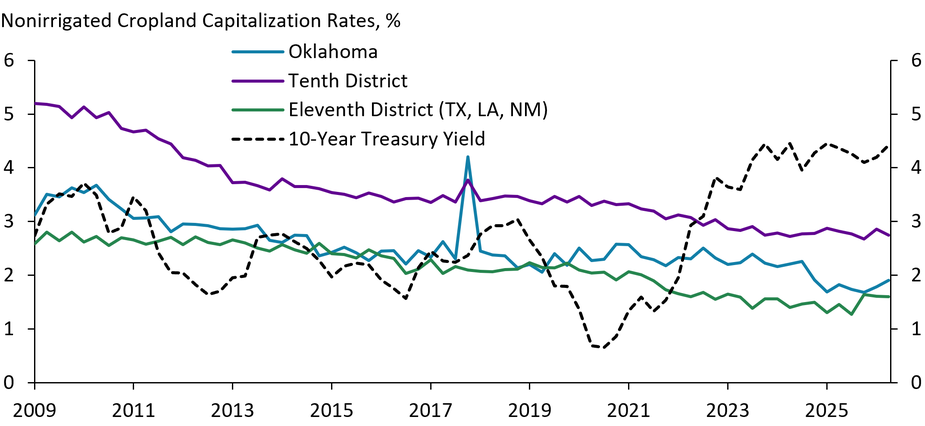
Note: Capitalization rates calculated as cash rents in $/acre as a percent of land value.
Sources: Federal Reserve Bank of Kansas City, Federal Reserve Bank of Dallas, Federal Reserve Board of Governors (FRED)
Although capital spending in Oklahoma has been stronger than in the rest of the District, trends in household spending have been comparable across all states. Household spending has continued to increase in all states, but at a slightly faster pace in Oklahoma (Chart 7). In addition, despite slowing in 2025, capital spending, which typically correlates strongly with farm income, has increased in Oklahoma in recent quarters while declining in other states.
Chart 7. Although farm household spending remains elevated in all states, capital spending has been stronger in Oklahoma than elsewhere.
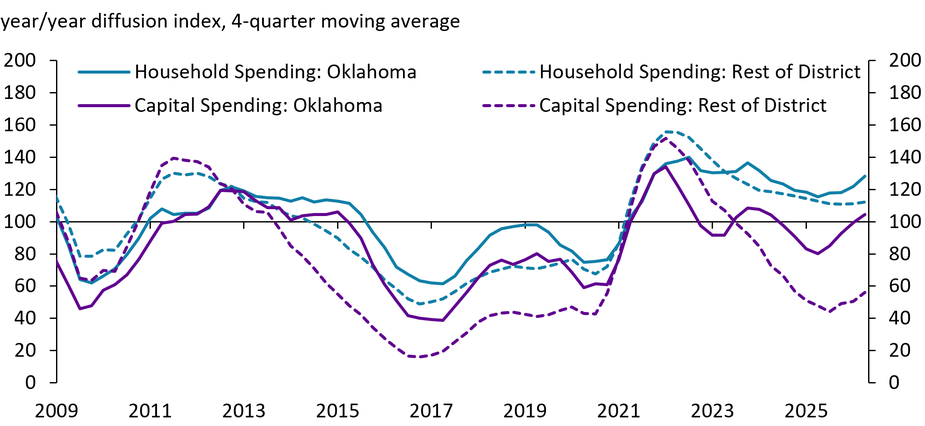
Note: The diffusion indexes represent the net percentage of firms reporting an increase from the previous year. Any value over 100 indicates net expansion.
Source: FRBKC
Despite Stronger Economic Conditions, Agricultural Credit Conditions Have Been Similar Across States
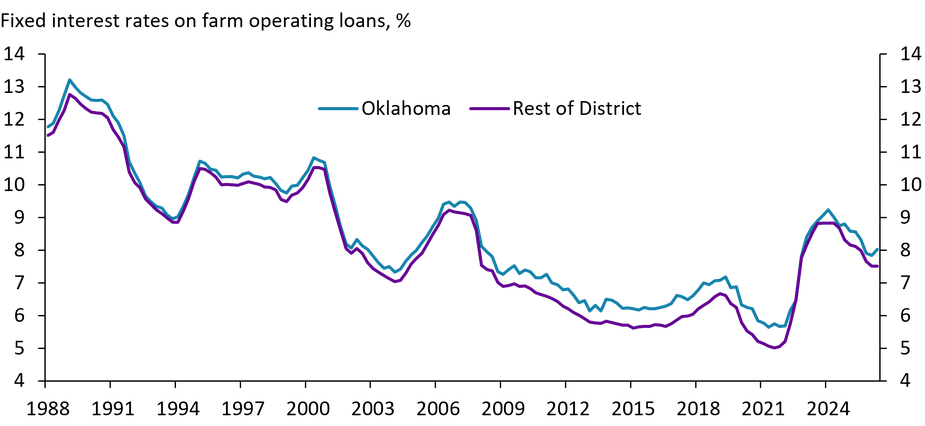
Higher interest rates may have contributed to slower capital spending in Oklahoma and in the rest of the District in 2025. Interest rates on farm loans have declined slightly since peaking in 2024 (Chart 8). Additionally, rates in Oklahoma tend to be higher than average interest rates for the rest of the District. Although rates have declined slightly, the average rate on an operating loan in Oklahoma ticked back above 8% in the second quarter of 2026. Higher interest rates make carrying credit balances forward considerably more expensive. Also, higher interest rates, together with historically high cattle prices, have limited the ability of ranchers to grow their herds and keep pace with growing domestic beef demand.
Chart 8. Interest rates on farm loans have declined since 2024 but remain elevated.
Source: FRBKC
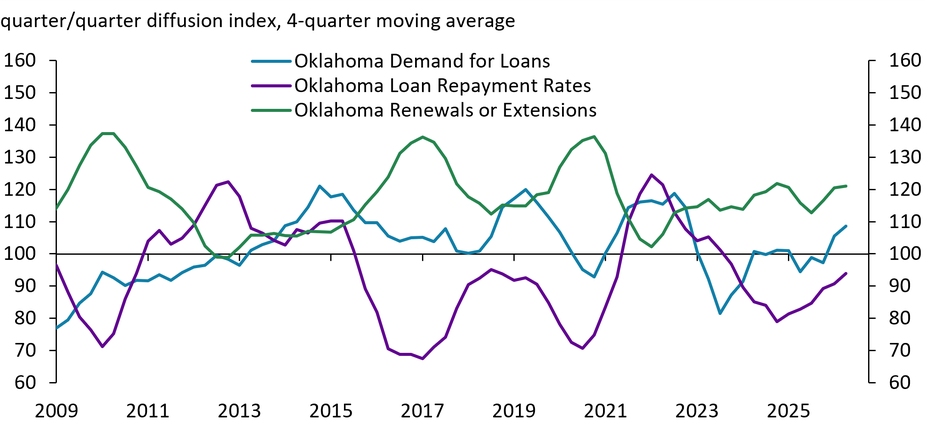
Amid higher interest rates, loan demand has stayed strong, and credit conditions in Oklahoma have continued to stabilize. Demand for loans has continued to increase in Oklahoma in 2026 (Chart 9). In fact, in the second quarter, nearly one-third of agricultural lenders reported that demand for new loans had increased relative to the same time last year. In addition, renewals and extensions on existing loans also increased sharply in the first two quarters of 2026, after declining in 2025. External LinkDespite the uptick in demand for credit, repayment issues have continued to ease in Oklahoma and across other states in the Midwest and Great Plains (Kreitman 2026a). Farm loan repayment rates continued to decline in the state but at a slower pace than in previous quarters in 2026. Only 4% of agricultural lenders in the state reported lower farm loan repayment rates in the second quarter of 2026, compared with 23% in the second quarter of 2024.
Chart 9. Demand for renewals and extensions on farm loans has increased alongside stable growth in loan demand and a slowing pace of decline in loan repayment rates
Note: The diffusion indexes represent the net percentage of firms reporting an increase from the previous quarter. Any value over 100 indicates net expansion.
Source: FRBKC
Elevated Operating Expenses and Drought Are Important Headwinds for Future Growth
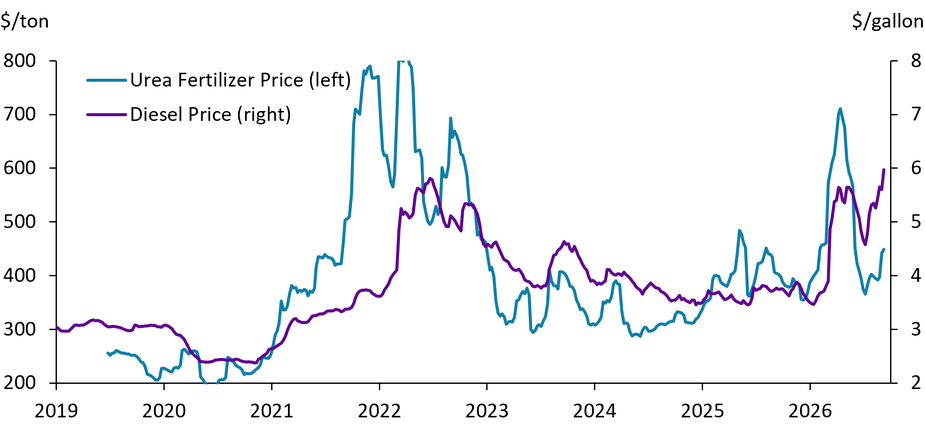
The rising cost of inputs has remained a key risk to the outlook. Prices for fertilizer and diesel have been volatile in recent years. In September 2026, the price of diesel reached record-high levels (Chart 10). According to the External LinkU.S. Energy Information Administration, the cost of crude oil accounts for more than half of retail diesel prices. External LinkFollowing disruptions related to the conflict in Iran, prices for all energy commodities spiked and have remained volatile. But prices for diesel have risen especially high due to tight global distillate supplies, low U.S. inventories, and strong seasonal demand (Farha and Cowley 2026). In addition, prices for fertilizer had declined during the first half of 2026 but have rebounded slightly in recent months.
Chart 10. Fertilizer prices shifted higher and diesel prices reached record levels in September
Note: Urea prices shown are first-expiring futures contracts.
Sources: Chicago Board of Trade (CBOT), U.S. Energy Information Administration (EIA) (Haver Analytics).
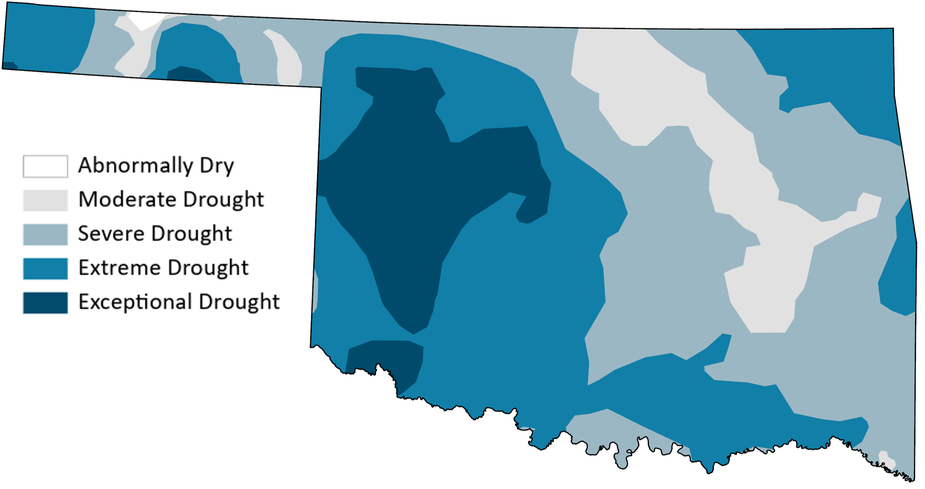
The outlook for agriculture within the state could vary greatly, depending on geography. Conditions in western Oklahoma have become increasingly dry, while drought in the eastern side of the state has remained moderate (Map 1). Counties east of Interstate-35 typically receive 20 to 30 more inches of rain per year than counties west of I-35, on average (External LinkMesonet 2026). However, this year has been especially dry in western Oklahoma and one of the hottest summers on record. As of mid-September, some counties in southwestern Oklahoma recorded nearly 60 to 90 consecutive days with less than 0.10 inches of rainfall. Most of Oklahoma’s cropland is located on the western side of the state. Therefore, drought and low crop prices have likely contributed to a weaker outlook for farmers and agricultural lenders in western Oklahoma relative to the eastern side of the state, which is more concentrated in livestock production.
Map 1. Growing conditions were drier across the state in 2026 than in 2025, with some areas in western Oklahoma in extreme to exceptional drought
Note: Map current as of September 8, 2026, release.
Sources: University of Nebraska-Lincoln Drought Monitor, NDMC, USDA, NOAA.
Summary and Conclusion
Due in large part to a relatively large concentration in cattle production, Oklahoma’s farm economy has remained solid and grown at a stronger pace than the rest of the Tenth Federal Reserve District. However, increasing input costs have made it difficult for crop producers in the state to maintain profitability. Also, although high cattle prices have contributed to strong profit margins, feed costs have increased, and External Linkhigh prices alongside elevated interest rates have created challenges for some producers looking to maintain or restock herds (Cowley, Kreitman, and Scott 2024). Moving forward, severe drought and higher diesel prices may dampen the outlook. According to the External LinkDrought Monitor, west-central Oklahoma has experienced the driest year on record, while southwest Oklahoma has had the second-driest year (Mocko and Johnson 2026). Overall, however, the agricultural economy in Oklahoma has continued to expand and has supported broader economic and business activity in the state.
References
Cowley, Cortney. 2022. “Oklahoma Ag Economy Diverges from Surrounding States.” Federal Reserve Bank of Kansas City. Oklahoma Economist. June 29.
Cowley, Cortney. 2026. “The Number of Cattle Processed into Beef Has Declined Alongside Low Inventories and Reduced Slaughter Capacity.” Federal Reserve Bank of Kansas City. Insights on Agricultural and Rural Economies. March 5.
Cowley, Cortney, Ty Kreitman, and Francisco Scott. 2024. “Not Bullish: U.S. Cattle Herds Hung Up on Higher Interest Expenses.” Federal Reserve Bank of Kansa City. Economic Bulletin. March 29.
Farha, Chase and Cortney Cowley. 2026. “Higher Oil Prices May Not Meaningfully Boost Oklahoma’s Broader Economy. Federal Reserve Bank of Kansas City. Oklahoma Economist. May 19.
Kreitman, Ty. 2026a. “Farm Finance Deterioration Eases Slightly.” Federal Reserve Bank of Kansas City. Agricultural Finance Update. August 26
Kreitman, Ty. 2026b. “Long-term Farmland Appreciation May Remain Attractive to Some Buyers.” Federal Reserve Bank of Kansas City. Insights on Agricultural and Rural Economies. August 27.
Mesonet. 2026. “Normal Annual Precipitation.” Available at External Linkhttps://www.mesonet.org/past-data/precipitation-normals/normal-annual-precipitation?ref=1842. Accessed 24 September 2026.
Mocko, David and Lindsay Johnson. 2026. “National Drought Summary for September 22, 2026.” U.S. Drought Monitor. September 22.
U.S. Department of Agriculture Economic Research Service (USDA ERS). 2026. “Farm Income and Wealth Statistics - Value added by U.S. agriculture (includes net farm income).” September 3. Available at: External Linkhttps://data.ers.usda.gov/reports.aspx?ID=4047#P2434b5b50c9d45c8a80cffe0b6ef8b99_4_109iT0R0x36. Accessed 8 September 2026.
U.S. Energy Information Administration (EIA). 2026. “Diesel fuel explained: Factors affecting diesel prices.”
The views expressed are those of the authors and do not necessarily reflect the positions of the Federal Reserve Bank of Kansas City or the Federal Reserve System.
Authors

Cortney Cowley
Assistant Vice President and Oklahoma City Branch Executive