The Iran conflict has significantly curtailed global oil supply, causing a sharp increase in prices. This edition of Oklahoma Economist examines how elevated oil prices may affect the state’s economy. It finds that higher prices have boosted oil and gas firms’ profits, but several factors may limit broader economic gains for Oklahoma. While the outlook depends on the magnitude and duration of the conflict, oil prices may not remain at levels needed for all energy firms to substantially increase drilling. Additionally, Oklahoma’s drilling revenues are more concentrated in natural gas, where prices are less affected by global developments and are currently decreasing relative to oil prices. Finally, increases in state severance tax collections from higher oil prices may be curbed by lower natural gas revenues, and job gains in the energy sector are likely to be limited by increased capital discipline and drilling productivity.
Regional producers have not yet increased drilling despite elevated oil prices following the Iran conflict.
The onset of the conflict in Iran resulted in the closure of the Strait of Hormuz, a passageway for around 20% of global oil trade flows. Prior to the conflict, global oil supply had increased to 108 million barrels per day (mmbbls/day) in 2025 as OPEC increased production, causing excess supply in the global market. The strait’s closure in late February 2026 forced the Gulf states to shut in 10.5 mmbbls/day in April (EIA 2026). As a result, global oil supply declined by 13% to 95 mmbbls/day, well below pre-conflict expectations of 107 mmbbls/day (Chart 1, left panel). Even if shipping through the strait resumes in June, global production is not currently projected to fully recover until the end of this year (EIA 2026).
Chart 1: Global oil supply fell over 13% since the start of the Iran conflict, causing prices to soar above firms’ average substantial increase price.
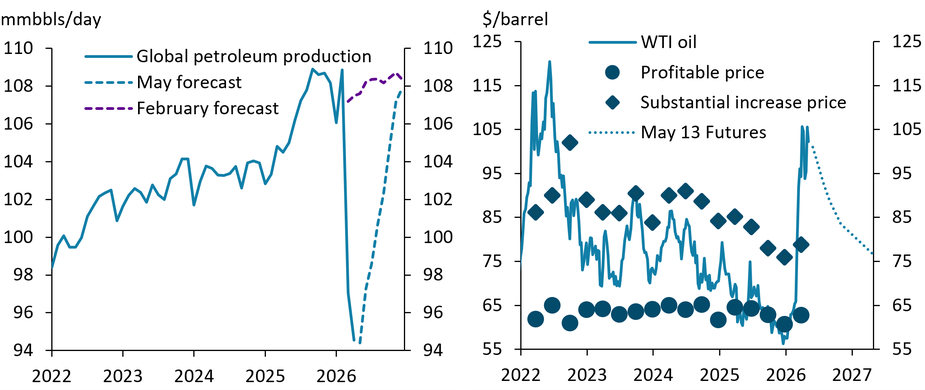
Sources: U.S. Energy Information Administration (EIA), Federal Reserve Bank of Kansas City, Chicago Mercantile Exchange (CME) (accessed via Haver Analytics).
Oil prices increased markedly following the supply disruption, but it remains unclear whether they will support a substantial increase in drilling for local producers. West Texas Intermediate (WTI) oil prices fell for most of 2025 amid increasing supply. WTI ended last year below the $61/barrel average price that Tenth District energy firms reported they needed to profitably drill for oil in Q4 (Chart 1, right panel). In early May, oil prices were up over 55% from the start of the conflict, averaging $102 last week, well above the $79 average price needed to substantially increase drilling in March. Despite elevated prices, uncertainty over the persistence of the blockade at the Strait of Hormuz has clouded the drilling outlook. Currently, futures markets anticipate oil prices will return closer to firms’ substantial increase prices—around $83—in the next six months, suggesting markets may be anticipating a shorter disruption. Consistent with past supply shocks such as Russia-Ukraine in 2022, futures prices have moved slower relative to spot prices, as expectations have taken time to adjust to new information about the magnitude and duration of the disruption (Rodziewicz 2026).
District oil and gas firms have seen increased profits resulting from higher oil prices but have yet to increase drilling activity. The drilling activity and profits indexes in the External LinkKansas City Fed’s quarterly energy survey historically have moved together (Chart 2, left panel). However, in March 2026, 53% of firms surveyed reported higher profits from last quarter, but only 16% of firms reported increased drilling. In fact, 69% of energy firms reported no change in drilling from the previous quarter. A larger share (38%) of firms expected drilling to increase in the next six months, but a majority still anticipated steady or even decreased activity (Kansas City Fed 2026). One explanation for the differences in expectations could be the range of prices required to support a substantial increase in drilling. As shown in the right panel of Chart 2, about half of firms reported price thresholds that are higher than what futures markets expect in 12 months. Survey comments suggest that some firms’ higher substantial increase prices may be reflective of industry-wide capital discipline and the potential for slower consumer demand to revert prices lower (Kansas City Fed 2026). Overall, some producers’ higher price thresholds for substantially increasing drilling may limit increases in activity if the higher oil prices are not sustained.
Chart 2: Energy firms reported higher profits on net amid elevated oil prices, but most have yet to increase drilling.
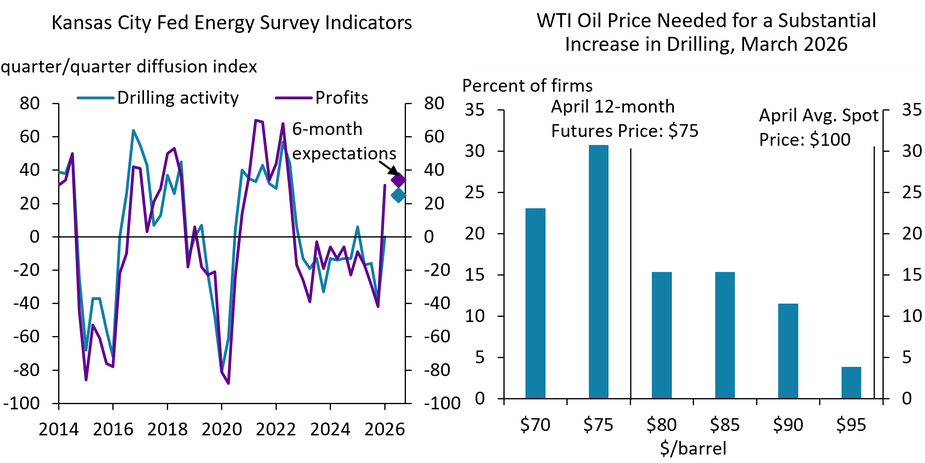
Notes: The diffusion indexes in the left panel show the percentage of firms reporting an increase in drilling activity or profits from last quarter minus the percentage of firms reporting a decrease. The share of firms in the right panel reporting a $75 price includes 4% of firms reporting a price of $78.
Sources: Federal Reserve Bank of Kansas City, U.S. EIA, CME
Oklahoma’s higher concentration of natural gas may limit additional drilling from elevated oil prices.
Although higher oil prices have supported profits for Oklahoma producers, Oklahoma’s production and revenues are more concentrated in natural gas than in oil. In Oklahoma, natural gas accounted for nearly three-quarters of fossil fuel production from 2015 to 2025, compared with 60% of aggregate U.S. production (Chart 3). Thus, any production increases related to the price shock could occur in oil-heavy basins in other parts of the country, particularly the Permian Basin in Texas and New Mexico (Dallas Fed 2026). Natural gas is produced in greater volumes, but oil is valued higher than natural gas. Accordingly, oil made up slightly more than half of implied revenues in Oklahoma from 2015 to 2025 but accounted for more than two-thirds of total U.S. revenue.
Chart 3: Oklahoma’s fossil fuel production and revenues have a higher concentration in natural gas.
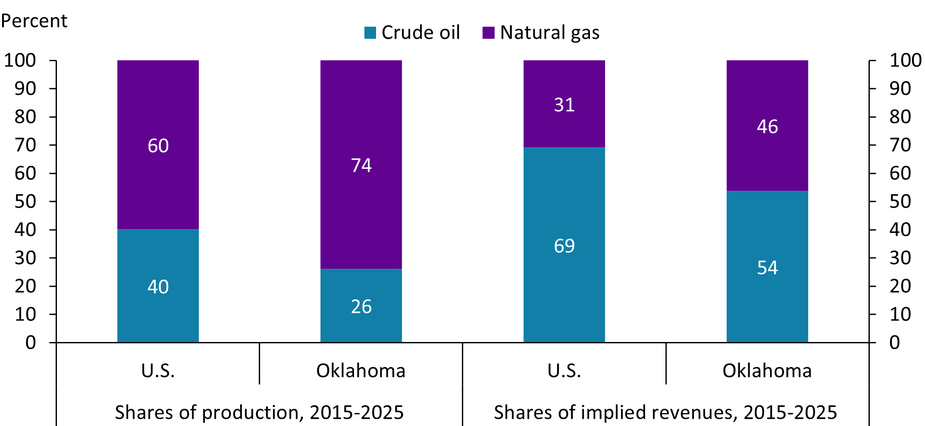
Note: Production shares are calculated by converting natural gas from thousand cubic feet (MCF) into barrels of oil equivalent (BOE), where 1 BOE = 5.8 MCF. Implied revenues for crude oil are calculated by multiplying the average price of WTI oil in a month (measured in $/barrel) by the number of barrels produced in the same month. Implied revenues for natural gas are calculated by multiplying the average price of Henry Hub natural gas in a month (measured in $/MMBTU) by natural gas production in the same month, multiplied by a conversion factor of 1.037 to convert production from MCF to MMBTU.
Sources: U.S. EIA, authors’ calculations.
Oklahoma’s concentration in natural gas can make marginal drilling activity sensitive to movements in natural gas prices, which have not seen increases from the Iran conflict as oil prices have. Oil markets are global due to the commodity’s relative ease of transportation, meaning that price increases from shortages in the Middle East, Europe, and Asia also cause price increases in the United States. By contrast, natural gas markets tend to be more regional because it can be transported only by pipeline or liquefaction for export abroad. Natural gas shortages due to the Iran conflict have caused prices to nearly double in Europe and Asia, but U.S. prices decreased by 9% in the same period due to ample domestic natural gas supply and limited ability to increase liquified natural gas (LNG) exports out of the country (Young 2026).
In recent years, drilling for natural gas has been unprofitable for producers, and Oklahoma’s drilling activity has generally decreased when oil prices increase relative to gas prices, as they have since the Iran conflict. U.S. natural gas has traded below the average profitable price most weeks since 2023, and futures markets anticipate it will continue to do so (Chart 4, left panel). Historically low natural gas prices are primarily caused by large volumes of associated gas (natural gas that is a byproduct of drilling for oil) from major oil-producing basins that increase the supply of natural gas above levels that can be easily transported (Cowley and Farha 2025). This generally occurs when oil prices increase relative to natural gas prices, incentivizing additional drilling for oil, which produces excess natural gas. When the oil-gas price ratio increased well past its 10-year average in 2023 and 2024, Oklahoma’s rig count decreased significantly, to as low as 33 active rigs (Chart 4, right panel). In 2025, the ratio decreased below its 10-year average, and the state’s drilling activity peaked at over 50 active rigs. Since the Iran conflict, the oil-gas price ratio has more than doubled, and futures markets as of May 13 expected it to remain higher than was priced in before the conflict began on February 27. Relatively higher oil prices could limit additional increases in Oklahoma’s drilling activity, as increased associated gas production from other basins in the U.S. could reduce the price of natural gas, which is important for Oklahoma producers’ revenues.
Chart 4: Oil prices are rising relative to natural gas prices, clouding the drilling outlook for Oklahoma.
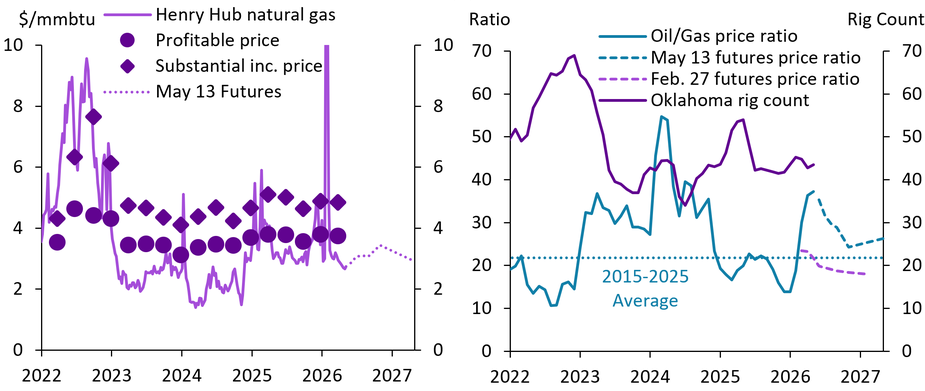
Sources: U.S. EIA, Federal Reserve Bank of Kansas City, CME, Baker Hughes (Haver Analytics).
Lower natural gas revenues and increased productivity are likely to limit broader state fiscal and employment impacts.
Increases in Oklahoma’s tax revenues from this oil price shock may be limited due to lower natural gas prices. Severance taxes—which made up 8% of Oklahoma’s total tax revenues over the past 10 years—are taxes on revenue collected from natural resource extraction. In the early 2000s before the shale oil boom, natural gas accounted for the vast majority of the state’s oil and gas revenues. Oil’s share of revenues has increased in the past two decades, but natural gas still accounted for 46% of implied revenues from 2015 to 2025 (Chart 3). As such, severance tax collections in Oklahoma are driven by revenues from both oil and natural gas production (Chart 5). Oklahoma’s severance tax collections peaked in 2008 and again in 2022, both years with historically high natural gas prices. In 2025, increases in natural gas prices drove annual severance tax collections higher to $1.1 billion, even as oil prices declined. Current price and production projections for 2026 imply that Oklahoma’s oil revenues will increase while its natural gas revenues stay mostly steady, meaning that severance tax collections will likely increase this year_. However, natural gas prices would need to be much higher than currently projected for severance tax revenues to increase anywhere near their 2022 peak of almost $2 billion.
Chart 5: Oklahoma’s severance tax collections could increase this year but are unlikely to near their 2022 peak.
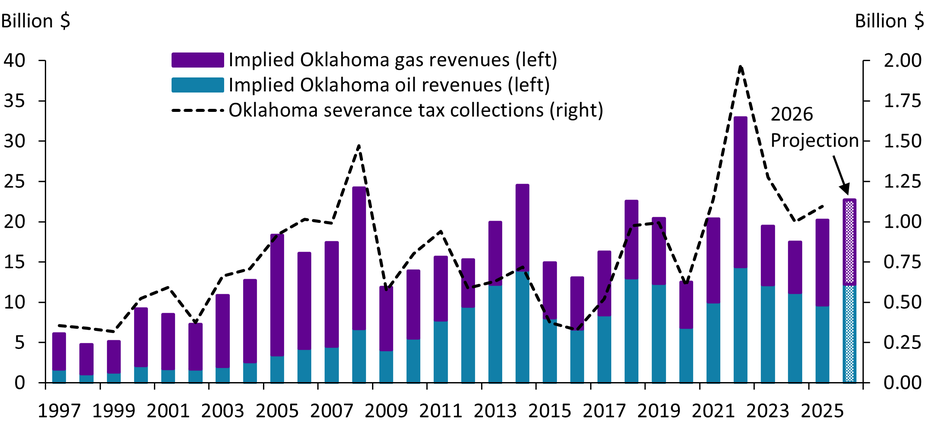
Note: Implied revenues for crude oil are calculated by multiplying the average price of WTI oil in a month (measured in $/barrel) by the number of barrels produced in the same month. Implied revenues for natural gas are calculated by multiplying the average price of Henry Hub natural gas in a month (measured in $/MMBTU) by natural gas production in the same month, multiplied by a conversion factor of 1.037 to convert production from MCF to MMBTU.
Sources: U.S. EIA, U.S. Census Bureau, authors’ calculations (Haver Analytics).
Elevated oil prices are also less likely to boost employment in Oklahoma, due to increased productivity and capital discipline in the energy sector. Historically, changes in oil and gas revenues in the state coincided with commensurate changes in the number of active rigs and employment in the mining sector, as increased cash flow allowed firms to increase investment (Chart 6). However, in recent years, oil and gas firms have tended to reinvest a smaller share of cash flows into production growth, reflecting a broader shift toward capital discipline and financial resilience. During the previous oil and natural gas price shock in 2022, Oklahoma’s oil and gas revenues nearly doubled from their 2017-19 levels, but the number of active rigs and mining employees were down 40% to 50% from the same period. This can also be explained by increased drilling productivity. New oil and gas production per foot drilled in basins across the U.S. and Oklahoma has more than doubled since the onset of the shale revolution in the 2010s, resulting in less drilling and fewer workers needed to increase production (Cowley and Farha 2025). Overall, greater capital discipline and drilling productivity likely curb drilling and employment growth in the state resulting from sustained higher oil prices.
Chart 6: The oil and gas sector has increased revenues with fewer workers and rigs.
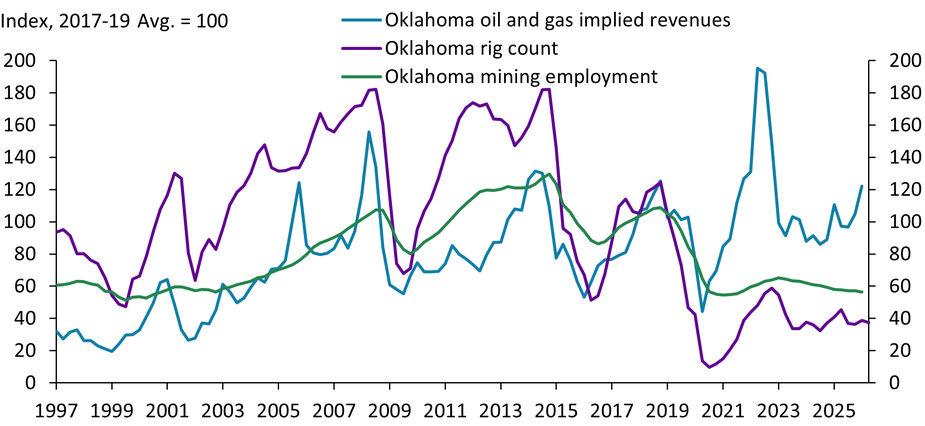
Sources: U.S. EIA, Baker Hughes, U.S. Bureau of Labor Statistics (BLS), authors’ calculations (Haver Analytics).
Summary and Conclusions
The Iran conflict's disruption to global oil supply elevated WTI oil prices above $100 per barrel, boosting profitability for Oklahoma's energy producers. However, these elevated prices may not spill over to Oklahoma's broader economy. Regional producers have not yet increased drilling on net despite higher prices, as firms have varied price thresholds for substantially increasing drilling and the persistence of the supply shock remains unclear. Oklahoma's higher concentration in natural gas further limits potential drilling increases, as natural gas prices remain depressed by ample domestic supply and limited export capacity. As a result of lower gas-related revenues, increases in state severance tax collections are likely to be more modest than during previous price shocks. Further, the oil and gas industry requires fewer workers to increase production and exercises greater capital discipline, likely curbing broader employment and investment gains. While the magnitude and duration of this oil price shock remain uncertain, Oklahoma’s energy-driven economic gains may be more modest and concentrated compared with previous shocks.
The information and data presented in this article were current as of May 14, 2026. Please be aware that circumstances, facts, figures, and other information may have changed since these dates. The views expressed are those of the authors and do not necessarily reflect the positions of the Federal Reserve Bank of Kansas City or the Federal Reserve System.
Endnotes
-
1 We project 2026 Oklahoma oil and natural gas production by scaling February 2026 levels using monthly percent changes from the EIA’s May STEO projections for Lower 48 production (excluding major basins) for March–December 2026. We then multiply the oil and gas production estimates by the May STEO price projections for WTI and Henry Hub, respectively, for each month, which are then summed to an annual estimate.
References
Cowley, Cortney and Chase Farha. 2025. “Increasingly Bullish: Oklahoma Natural Gas Rebounds on Rising Demand and Infrastructure.” Federal Reserve Bank of Kansas City, Oklahoma Economist, July 16.
Energy Information Administration (EIA). 2026. “External LinkGlobal Oil Markets.” Short-Term Energy Outlook (STEO), May 12.
Federal Reserve Bank of Dallas (Dallas Fed). 2026. “External LinkOil and gas activity rises amid elevated uncertainty.” Energy Survey, March 25.
Federal Reserve Bank of Kansas City (Kansas City Fed). 2026. “Tenth District Energy Activity Was Unchanged.” Energy Survey, April 10.
Rodziewicz, David. 2026. “Higher Oil Prices Will Likely Increase Severance Tax Revenues in Rocky Mountain States.” Federal Reserve Bank of Kansas City, Rocky Mountain Economist, May 6.
Young, Jordan. 2026. “External LinkInternational LNG prices rise amid Strait of Hormuz closure.” Energy Information Administration, Today in Energy, April 28.
The views expressed are those of the authors and do not necessarily reflect the positions of the Federal Reserve Bank of Kansas City or the Federal Reserve System.
Authors

Chase Farha
Research Associate II
