The conflict in Iran that erupted in late February represents one of the largest global energy shocks in decades. The Strait of Hormuz—a key shipping channel for energy trade—remains closed as of April 2026, disrupting roughly 20 percent of global oil trade flows and leading domestic oil prices to jump by roughly 60 percent since late February. Although global energy inventories and excess oil supply leading into the conflict have kept prices from moving even higher, these buffers have limitations. Moreover, while oil futures prices currently remain subdued, both futures and spot oil prices could move higher if the disruption to energy transportation and production persists.
Although this energy shock poses challenges for consumers and businesses nationwide, it will likely generate greater severance tax revenue for Rocky Mountain states, which are relatively large energy producers. In this edition of the Rocky Mountain Economist, we summarize the characteristics of the recent Middle Eastern energy shock, outline how current circumstances differ from the recent past, and highlight the implications for severance tax revenues in Rocky Mountain states.
Iran Conflict and Energy Shock
In late February, joint U.S.-Israeli strikes on Iran and the subsequent retaliation disrupted major energy trade routes, curtailing available energy to global markets. Chart 1 shows that vessel traffic through the Strait of Hormuz—a thoroughfare for more than 20 percent of global oil and petroleum products—dropped by more than 90 percent between February and April 2026 (EIA 2025).
Chart 1: Vessel traffic in the Strait of Hormuz is at a standstill
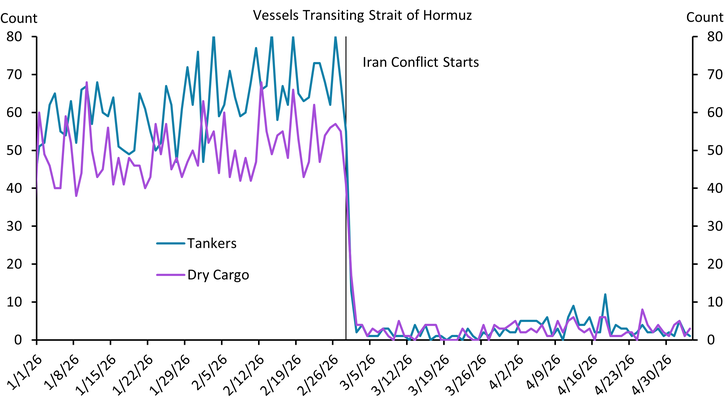
Note: Vessel transit counts are bidirectional (east and west).
Source: Bloomberg
As global oil markets have remained choked off from Middle Eastern energy supplies, both U.S. oil prices and geopolitical risk have increased. Chart 2 shows that U.S. oil prices (blue line) jumped by 60 percent since February, while a geopolitical risk (GPR) index that measures adverse geopolitical events and risks using newspaper articles (purple line) more than doubled. As of April 2026, the GPR index is the highest it has been since the early stages of the Russia and Ukraine War in 2022 and roughly comparable to levels witnessed during the first and second Iraq Wars (1991 and 2003).
Chart 2: The Iran conflict is one of the largest geopolitical and energy supply shocks in modern history
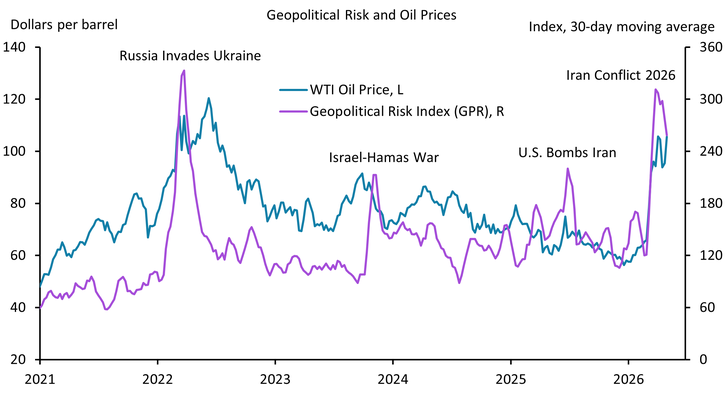
Sources: Caldara and Iacoviello (2022) and EIA (Haver Analytics).
Oil Futures Prices, Market Perceptions, and Production Responses
Despite spikes in both the spot oil prices and geopolitical risk, movements in oil futures prices have thus far remained subdued. Panel A of Chart 3 shows that the spot oil price is up nearly 60 percent from the start of the Iran conflict, but 12-month futures price is only up about 19 percent_. This limited change in oil futures suggests markets may be anticipating a short-lived disruption from the Iran conflict_. However, it may also simply reflect that markets are gradually assimilating new information about the shock. The rise in both spot oil and futures prices occurred slowly over the last few weeks, as markets adjusted to developments about the Iran conflict and recalibrated perceptions about the magnitude and duration of the shock. Movement in the futures curve in Panel A shows that the spot oil price was only up 19 percent in the first week of the conflict but rose an additional 35 percent in subsequent weeks.
Chart 3: Short-dated domestic oil prices responded rapidly to recent energy shocks, while oil futures prices are muted
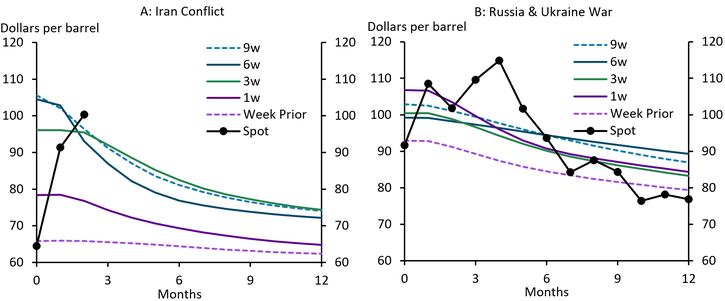
Notes: The Iran conflict began on February 28, 2026, and “week prior” prices are the average daily prices for the week ending February 27. Russia invaded Ukraine on February 24, 2022, and “week prior” prices are average daily prices for the week ending February 18. All subsequent weekly prices are average daily prices for the weeks following the events. For example, the futures curve one week following the event is “1w.” Spot prices at month “0” are the average daily prices in the month when the conflict began. Spot prices in subsequent months are the average daily prices in the months following the start of the conflict.
Sources: EIA and NYMEX (both accessed via Haver Analytics).
These sluggish movements in spot and futures prices are consistent with past geopolitical conflicts. Panel B of Chart 3 shows that similar price movements occurred in the weeks following Russia’s 2022 invasion of Ukraine. Although the spot oil price rose over 15 percent in the first week (solid purple line) following the invasion, the 12-month futures price rose only a little over 6 percent. Additionally, prices adjusted gradually to the shock, and spot oil prices (black dots) did not peak until four months after the invasion began. It typically takes several months for oil prices to peak following a negative oil supply shock (Herrera and Rangaraju 2020).
Limited movement in the oil futures curve and higher price volatility create headwinds for additional domestic oil production, which would be needed to offset the current supply shock. Producers take time to bring new oil supplies online as oil prices rise. Furthermore, oil producers often match their drilling decisions to futures prices to hedge their price risk (Chen and Linn 2017). Absent a material rise in oil futures prices or a sustained increase in spot oil prices, energy producers are less likely to add new supply—many drillers report they plan on taking a more measured approach in drilling new wells, tempering a domestic production response that could attenuate the current energy shock (Federal Reserve Bank of Kansas City Energy Survey).
In sum, with the Iran conflict and associated energy shock entering its third month, spot oil prices have climbed higher, while futures prices remain subdued. These price movements in the first several weeks of the conflict are consistent with movements during recent geopolitical events such as the 2022 Russia and Ukraine War—namely, slow adjustments to spot oil prices and moderate changes in futures prices. However, without sustained higher spot oil prices or a notable increase in futures prices, U.S. drillers are unlikely to materially ramp up oil production, limiting U.S. producers’ ability to partially offset this historic energy supply shock.
Market Conditions: Supply, Demand, and Inventories
Global oil market fundamentals may have had a moderating effect on oil price increases in the first couple of months of the Iran conflict, but this effect is likely to be limited longer-term. Chart 4 shows that global petroleum production (blue line) exceeded consumption (purple) over the last year, resulting in rising global inventories (green bars). Excess global supply and growing global inventories prior to the Iran conflict helped buffer near-term oil prices from this shock (EIA 2026). These slack market conditions leading into the Iran conflict contrast starkly with tight energy market conditions prior to the Russia and Ukraine War in 2022, when the global economy was rebounding from the COVID-19 pandemic, demand was strong, supply was lagging, and global commodity inventories were low (Cowley, Rodziewicz, and Cook 2022). While global petroleum inventories provide a temporary buffer from rising oil prices in the near-term, the magnitude of the recent energy supply shock is already causing a drawdown in inventories outside of the Middle East. The month of March witnessed the first implied petroleum inventory decline in over a year (green bars) (IEA 2026b). A continuation of the conflict and a protracted energy supply shock would further deplete global oil inventories, creating additional tailwinds for oil prices.
Chart 4: Global supply and demand balances have offset the severity of the recent energy price shock
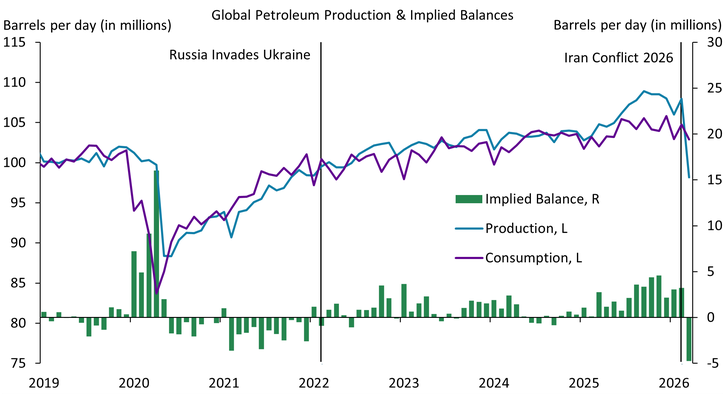
Source: EIA (Haver Analytics).
Severance Taxes and Rocky Mountain States
The recent rise in oil prices and potential for further increases will create challenges for consumers and businesses, but those higher energy prices may be a boon for Rocky Mountain state budgets. Rocky Mountain states are prolific energy producers, with state revenues that are highly dependent on conventional energy production (Farha and Rodziewicz 2025; Rodziewicz and Sly 2021). Panel A of Chart 5 shows that state severance tax revenues closely track domestic oil prices—as oil prices rise, severance taxes respond accordingly. As large energy-producing states, the Rocky Mountain region has a much higher severance tax exposure than the national average. Panel B of Chart 5 shows that on average, 14 percent of Rocky Mountain state tax revenue comes from severance taxes compared with 1.5 percent for the nation as a whole. In particular, New Mexico and Wyoming have some of the highest severance tax concentrations in the country, at 32 percent and 30 percent, respectively_. While oil production levels may be slow to respond to higher oil prices (as noted previously), Rocky Mountain states stand to benefit from higher oil prices and associated severance tax revenues, a fiscal silver lining amid a historic energy shock.
Chart 5: Severance tax receipts track oil prices closely, and Rocky Mountain states have higher severance tax exposures
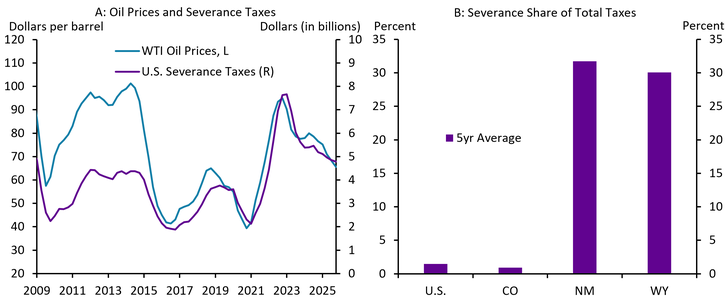
Notes: Severance taxes are collected based on the volume or value of natural resource production (for example, oil, natural gas, coal, and timber). Most severance taxes in the United States are collected from oil and gas production (EIA 2015). Colorado’s severance tax share is lower than the national average, as reported by the U.S. Census Bureau, due in part to offsetting local property tax credits/deductions (Colorado 2026). Data in Panel A are shown as a 4-quarter moving average. Data in Panel B is the 5-year average severance tax share (2021-2025).
Sources: U.S. Census Bureau and EIA (both accessed via Haver Analytics).
Conclusion
The Iran conflict that began in February 2026 marks one of the most significant geopolitical and energy shocks in recent decades. With global energy trade disrupted and energy infrastructure destroyed, domestic oil prices have risen in response. However, global energy market conditions and available petroleum inventories have offered a temporary buffer from even higher oil prices, helping to subdue price responses in the near-term.
While the Iran conflict and associated energy price shock creates challenges for consumers and many business, energy-abundant Rocky Mountain states will likely benefit in part from higher severance tax revenues, representing a fiscal silver lining for the region.
Endnotes
-
1 The change in the 12-month futures price is the difference between the blue dotted line and purple dotted line at the 12-month tick mark.
-
2 It is not uncommon that longer-dated futures prices are less responsive to near-term economic shocks, as there is more time for supply and demand to respond to a given event (higher price elasticity). While in the short-run, markets have less time to adjust to a given event (lower price elasticity). For example, subdued futures price movements could reflect potential medium-term demand destruction from high oil prices, accounting for lower future fuel demand from higher prices. Indeed, several countries have already announced energy rationing to lower energy demand and temper the consequences of the recent shock (IEA 2026a).
-
3 State severance tax revenues are primarily driven by natural resource production and commodity prices. An additional contributing factor is the severance tax rate. Each state levies its own severance tax rate for oil: 2.0–5.0 percent for CO, 3.75 percent for NM, and 4.0–6.0 percent for WY (Colorado 2026, New Mexico 2026, and Wyoming 2026).
References
Caldara, Dario, and Matteo Iacoviello. 2022. “External LinkMeasuring Geopolitical Risk.” American Economic Review, vol. 112, no. 4, pp. 1194–1225, April.
Chen, Fan, and Scott C. Linn. 2017. "External LinkInvestment and Operating Choice: Oil and Natural Gas Futures Prices and Drilling Activity." Energy Economics, vol. 66, pp. 54–68.
Colorado Legislative Council Staff (Colorado). 2026. “External LinkSeverance Tax.” Accessed April 21.
Cowley, Cortney, David Rodziewicz, and Thomas R. Cook. 2022. “Turmoil in Commodity Markets Following Russia’s Invasion of Ukraine.” Federal Reserve Bank of Kansas City, Agriculture and the Economy, May 23.
Energy Information Agency (EIA). 2015. “External LinkMajor Fossil Fuel-Producing States Rely Heavily on Severance Taxes.” Today In Energy, August 21.
———. 2025. “External LinkAmid Regional Conflict, the Strait of Hormuz Remains Critical Oil Chokepoint.” Today In Energy, June 16.
———. 2026. “External LinkGlobal Oil Markets.” Short-Term Energy Outlook (STEO), April 7.
Farha, Chase, and David Rodziewicz. 2025. “10 Years of Energy and the 10th District: A Decade in Review.” Federal Reserve Bank of Kansas City, December 19.
Federal Reserve Bank of Kansas City. 2025. Energy Survey.
Herrera, Ana María, and Sandeep Kumar Rangaraju. 2020. "External LinkThe Effect of Oil Supply Shocks on U.S. Economic Activity: What Have We Learned?" Journal of Applied Econometrics, vol. 35, no. 2, pp. 141–159.
International Energy Agency (IEA). 2026a. “External Link2026 Energy Crisis Policy Response Tracker.” Accessed April 14.
———. 2026b. External LinkOil Market Report - April 2026. April 16.
New Mexico Taxation and Revenue Department (New Mexico). “External LinkOil and Gas Severance Tax Registration and Filing.” Accessed April 21.
Rodziewicz, David, and Nicholas Sly. 2021. “Regional Investments in Renewable Energy Resources.” Federal Reserve Bank of Kansas City, Rocky Mountain Economist, October 8.
Wyoming Department of Revenue (Wyoming). 2026. "External LinkOil Severance Tax." Accessed April 21.
The information and data presented in this article were current as of May 1, 2026. Copy editing and final content review were completed as of May 4, 2026. Please be aware that circumstances, facts, figures, and other information may have changed since these dates.
The views expressed are those of the authors and do not necessarily reflect the positions of the Federal Reserve Bank of Kansas City or the Federal Reserve System.
Author