Introduction
Russia’s invasion of Ukraine, which began in February 2022, has caused broad disruptions in global commodity markets. In this analysis, Kansas City Fed researchers explore the substantial impacts of these disruptions to markets and consumers.
Russia and Ukraine are important producers and exporters of energy and agricultural products, such as oil, natural gas, wheat, and corn. The effects of disruption were felt across much of the global and U.S. economy. In February and March 2022, commodity prices responded to the crisis in Ukraine by rising at a historic pace, putting further inflationary pressures on producer inputs and consumer goods.
Reduced production and trade associated with the war and global sanctions have been the primary drivers of disruptions in commodity markets. Destruction from the war in Ukraine has hampered production and exports in critical commodities like wheat and natural gas. Moreover, several policy responses from nations worldwide have led to further and ongoing disruptions to global markets. Countries acted expediently following Russian’s invasion of Ukraine, implementing both physical and financial sanctions against Russia. These policy barriers have further disrupted global trade flows in Russian-linked commodities and products.
Several factors and historical experiences suggest that these disruptions and higher prices could persist into the medium and longer term. First, futures markets are signaling persistent effects from this on-going commodity shock. Second, inventories for key commodities, such as oil and wheat, were limited prior to the conflict, exacerbating the effects of the disruptions to production and trade of commodities. Third, disruptions in global trade flows are likely to persist and have spillovers to other markets. Lastly, as history suggests, sanctions appear likely to remain in place at least through Russia’s conflict with Ukraine and possibly for an extended period even after the conflict is resolved.
The invasion and associated disruptions will have significant implications, particularly for regions closely tied to commodity markets, and for consumers. The production of energy and agricultural commodities is important not only to the U.S. economy, but also to that of the Federal Reserve’s Tenth District._ The Tenth District accounts for more than 20% of U.S. oil, natural gas and corn production and about 40% of U.S. coal and wheat production. Although higher commodity prices may support profit margins for producers in the region, higher food, energy and input prices could squeeze budgets and balance sheets for households and businesses.
Prices
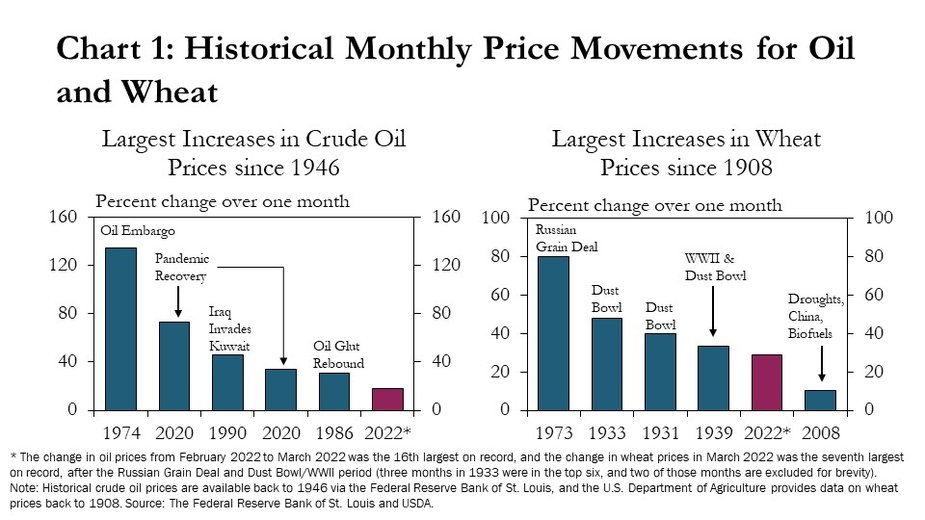
Over just a few weeks, the prices of major commodities in both energy and agricultural markets surged at a pace with few historical precedents. For example, the monthly average price of oil increased 18% from February to March, which was one of the more significant monthly increases on record (Chart 1, left). The surge in the price of wheat was perhaps even more historically significant. Wheat prices increased 29% in March, which was among the highest price increases over the past century (Chart 1, right). Other price escalations of this magnitude had not occurred since the oil embargo and Russian grain deal of the 1970s or the Dust Bowl of the 1930s._
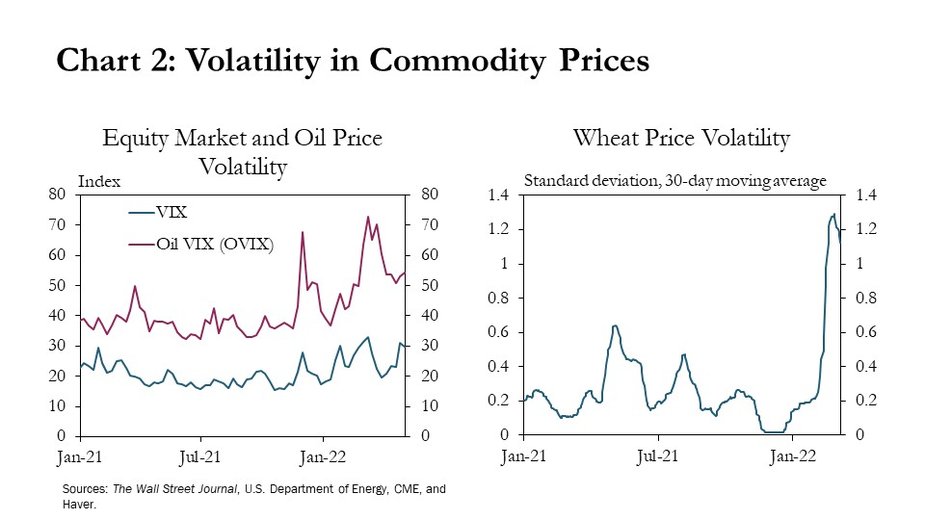
Reflecting an underlying environment of extreme uncertainty, commodity prices fluctuated wildly in the initial weeks of the conflict. Shortly after Russia invaded Ukraine on Feb. 24, the market volatility index (VIX) reached the highest level in more than a year (Chart 2, left). Although the VIX receded slightly in March, the volatility index for oil markets (OVIX) rose even more sharply and remained elevated. Markets for agricultural commodities also experienced extreme volatility. For example, although wheat prices appreciated at a near-record pace overall, they also rose and fell wildly in the weeks following the invasion (Chart 2, right).
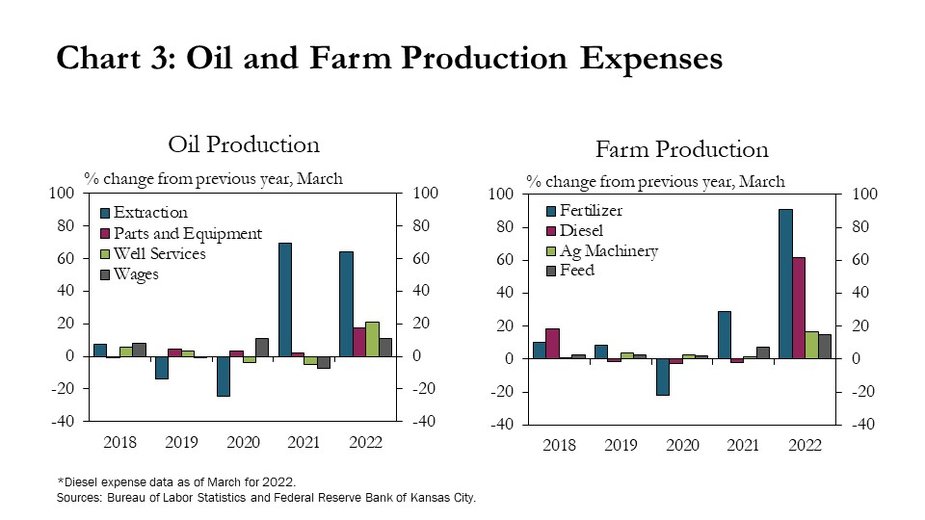
The conflict also intensified other challenges for producers, including significant cost pressures and difficulties managing supply chains (External LinkFRB). Although costs associated with extracting oil rose sharply in 2021, the pace of increase accelerated in 2022, rising almost 60% through the first quarter (Chart 3, left). Other costs associated with oil production, such as parts and equipment, well services and wages, were stagnant or declining in the previous four years but rose in the first quarter of 2022. Farm production expenses, which had already been on the rise, increased even more sharply in the first quarter (Chart 3, right). Most notably, fertilizer and diesel expenses rose 90% and 60%, respectively, from the previous year in February. Feed expenses also climbed 15% alongside higher prices for grains and oilseeds.
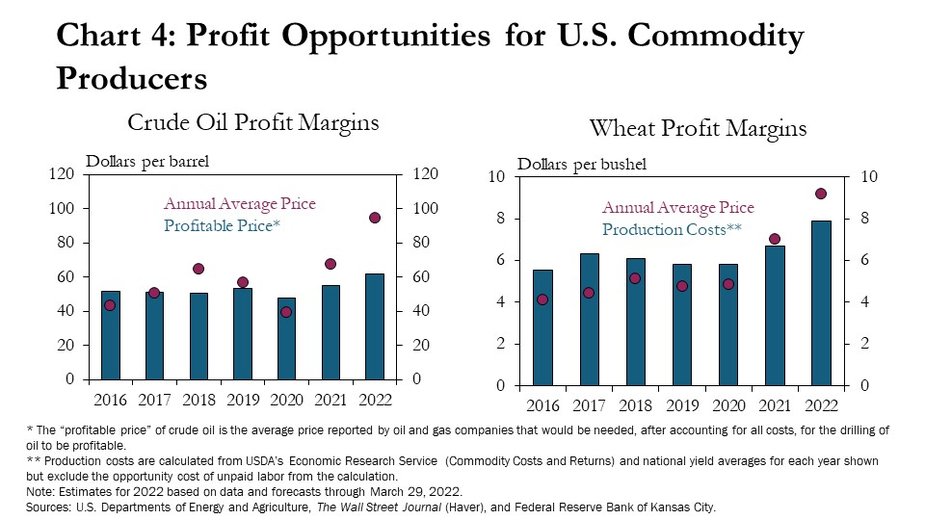
Despite the elevated uncertainty and higher production costs, higher prices have boosted profit opportunities for U.S. commodity producers. Although the costs of producing crude oil rose from $48 a barrel in 2020 to $62 a barrel in the first quarter of 2022, oil prices rose faster, creating wider profit margins for energy producers (Chart 4, left). Unlike in 2020, in the first months of 2022, the average price of oil was $95 a barrel, or 53% higher than the profitable price. Similarly, although production expenses for wheat farmers have increased, prices producers receive for their wheat were higher than the costs of production, creating better opportunities for positive profit margins (Chart 4, right).
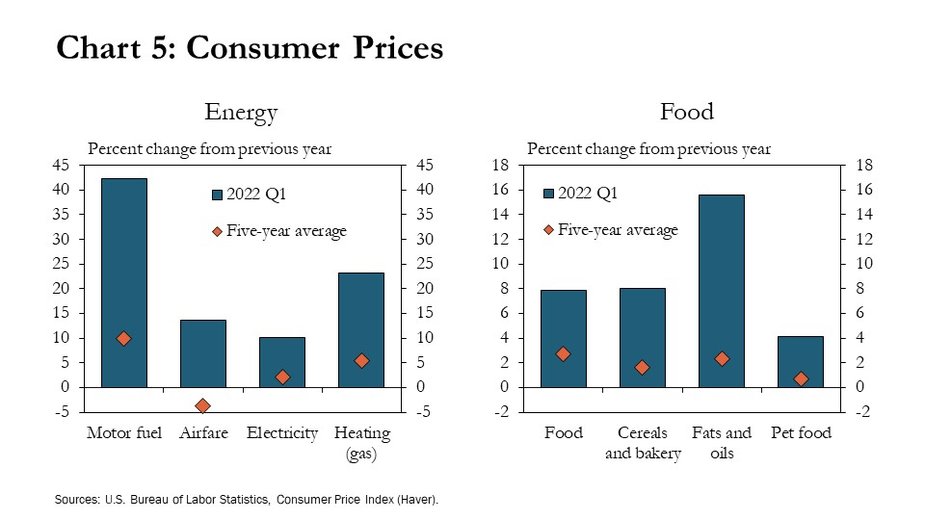
However, higher commodity prices have led to even larger increases in the prices of energy and food products important to consumers. Inflation in several energy and food categories in the first four months of 2022 was well above longer-term trends. In particular, prices increased in major categories like gasoline and cereals, but also in smaller categories like home heating and pet food (Chart 5). Furthermore, gasoline and food account for 15-21% of total household expenditures in the United States (External LinkHoltemeyer 2011). Consumers purchase gasoline and food more often than other goods, and price increases in these products can have a significant effect on household budgets and inflation expectations (External LinkKilian and Zhou 2020; External LinkD’Acunto, Malmendier, Ospina, and Weber 2021)
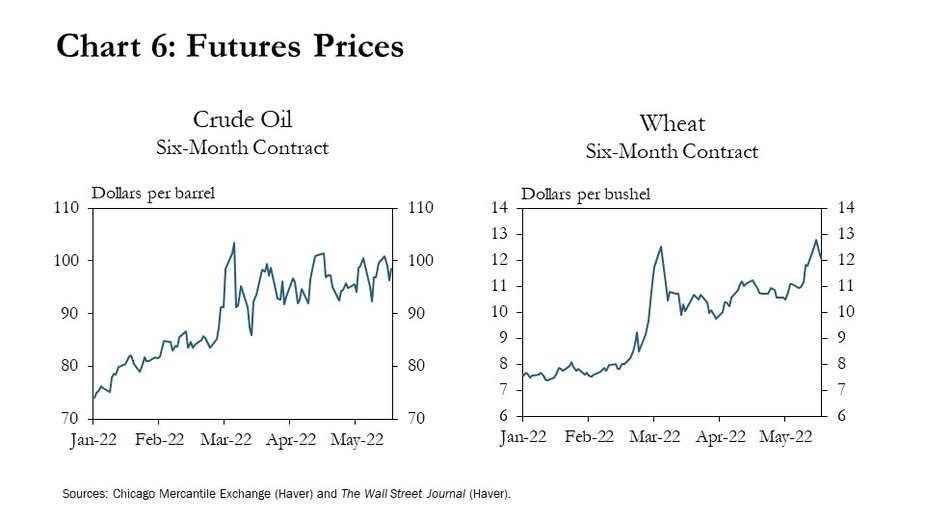
Futures markets suggest commodity prices may remain high even toward the end of 2022. In less than two weeks following Russia’s invasion of Ukraine, futures prices for crude oil and wheat rose 23% and 36%, respectively (Chart 6). Although futures prices for these commodities declined slightly through April, they are still elevated compared with pre-invasion. Additionally, forecasts for energy and agricultural commodities in 2022 also increased, suggesting higher prices through the end of the year (External LinkEIA and External LinkUSDA forecasted prices).
U.S. and Global Inventories
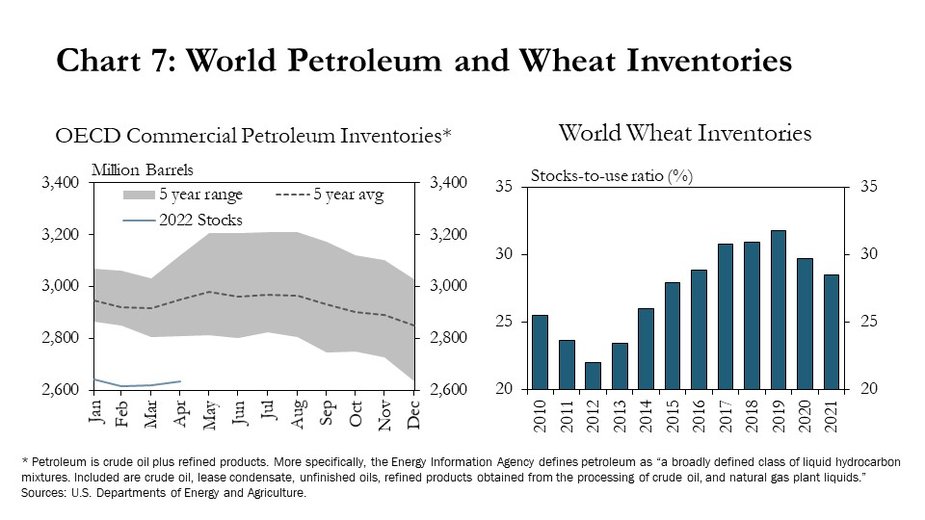
Limited inventories of energy and ag products prior to the conflict also contributed to the recent surge in prices. Inventories provide a buffer to supply shocks, so commodity markets are less able to absorb the disruption emanating from the Ukrainian conflict while inventories are low or declining. Entering 2022, world petroleum and wheat inventories were almost 10% below the previous five-year average (Chart 7). Declining global petroleum inventories have been driven by underinvestment in global oil production during the pandemic and a resurgence of demand as economies recover and reopen. Lower wheat inventories were driven by strong global demand, lower planted area in the United States, and adverse weather conditions in other parts of the world, which limited production.
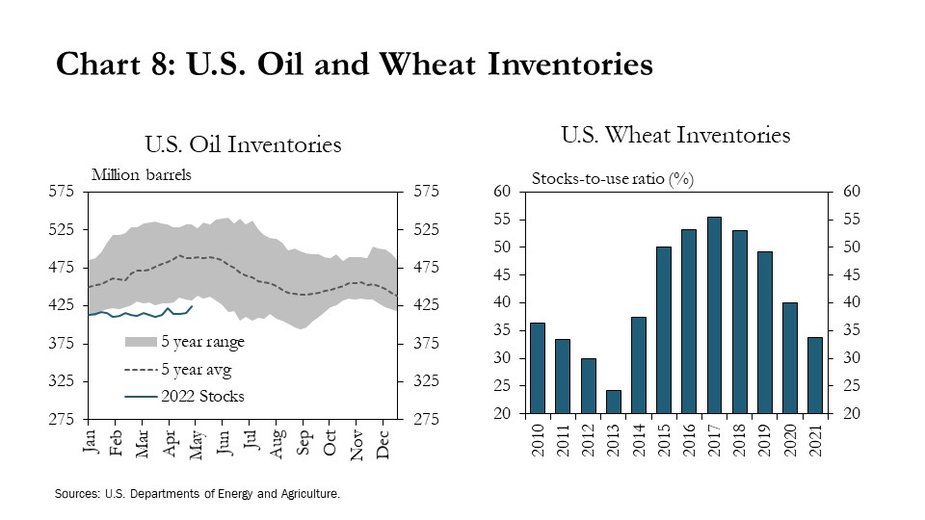
In the United States, inventories had also been somewhat depleted prior to the crisis in Ukraine and could remain at low levels. In 2022, U.S. inventories of oil were about 11% below the five-year average before Russia invaded Ukraine (Chart 8, left). Domestic wheat inventories started declining earlier and have receded more sharply than world inventories, falling more than 55% since 2017 (Chart 8, right). In addition, forecasts for 2022 winter wheat production are down 8% from last year, primarily due to adverse weather conditions, such as drought and wind events (External LinkUSDA). Lower production in the United States and strong global demand for wheat could put further downward pressure on U.S. wheat inventories.
Production and Trade Disruptions and Duration
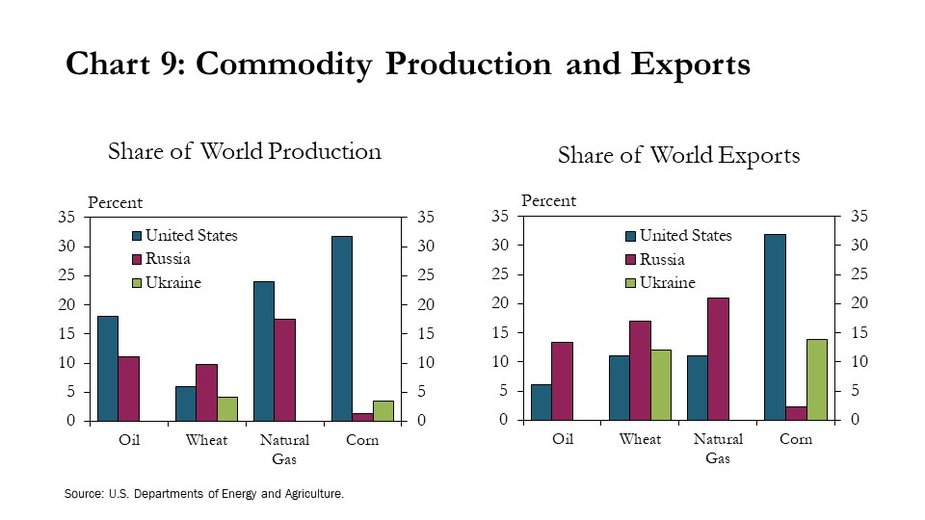
Russia and Ukraine’s concentration in both production and exports of several key commodities is another primary driver of the increases in prices and volatility in commodity markets. Russia is the world’s third largest producer of crude oil and second largest producer of natural gas, accounting for 11% of global oil production and almost 18% of natural gas production (Chart 9, left). Although Ukraine is not a major producer of energy commodities, Russia and Ukraine produce and export large quantities of agricultural products, such as wheat and corn (Chart 9, right). In fact, Russia and Ukraine combined are the second largest producers of wheat in the world (after China) and export more wheat globally than any other country, accounting for about 29% of global wheat exports.
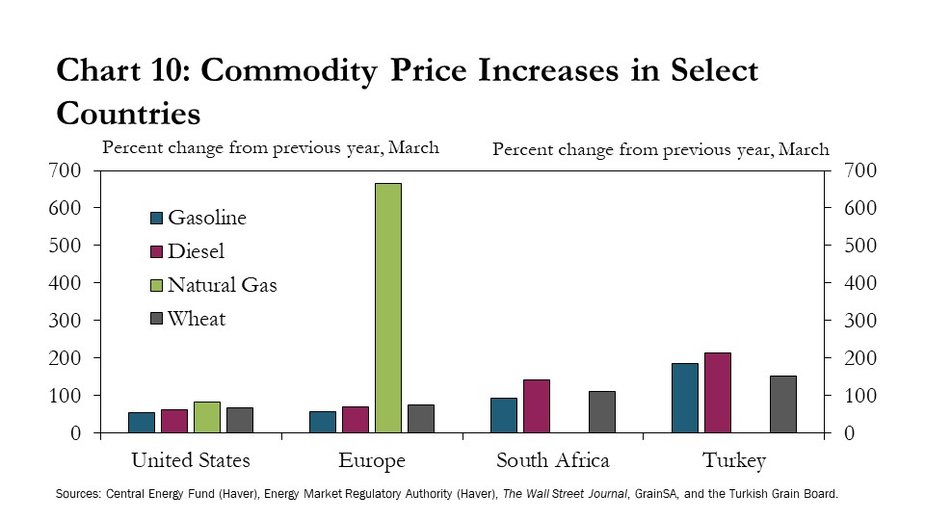
Countries with direct trade exposures to Russia and Ukraine have experienced the most substantial increases in prices in the immediate aftermath of the invasion. For example, gas prices in the European Union (EU) have increased 665% from the previous year in March, whereas U.S. natural gas prices have increased about 85% (Chart 10). Although natural gas production is distributed across the globe, markets are primarily regional. For example, more than 70% of Russian gas exports go to Europe, and Russian imports make up roughly 40% of the EU's consumption (External LinkEIA, External LinkIEA). In addition, 90% of Russian wheat exports and about 55% of wheat exports from Ukraine are typically destined for countries in Africa, the Middle East, or the EU. Therefore, wheat prices in the EU and in countries such as South Africa and Turkey rose even more sharply than wheat prices in the United States, which does not traditionally trade agricultural commodities with Russia or Ukraine.
In the longer term, higher prices in the United States and abroad may persist and will depend, in part, on (1) the duration of the conflict and (2) the duration of sanctions. The ongoing conflict places critical energy infrastructure at risk of disruption and constrains the ability of Ukraine to export agricultural products. The disruption to agricultural exports is likely to continue for the duration of open hostilities. Large-scale conflicts are rare but tend to last a long time. Since 1980, the average length of large conflicts is about two and a half years._ In addition, sanctions constrain Russian access to financial and export markets. Like conflict, sanctions tend to remain in place for lengthy periods of time._ For comparison, the sanctions imposed in response to the 2014 Russian invasion of Crimea are still in place today while the financial sanctions against Iran (which are similar to the financial sanctions against Russia) lasted four years._ Russia and Ukraine are important producers of energy and agricultural commodities, and historical precedent suggests the conflict and sanctions (and associated disruptions) could persist for an extended period.
Trade balances
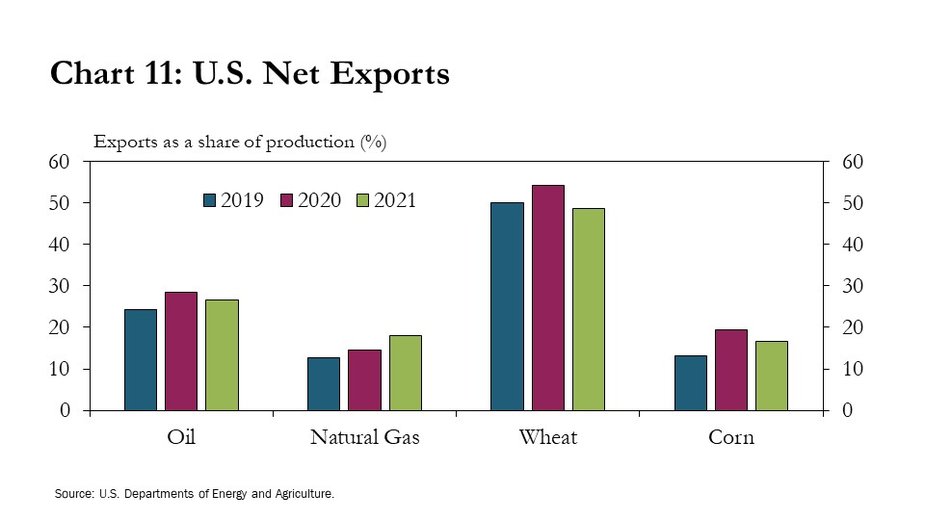
Regardless of the duration of these disruptions, the United States has been somewhat insulated from concerns surrounding commodity shortages that have prevailed elsewhere. For example, the United States produces an abundance of many energy and agricultural commodities such that it exports a portion of production to other countries (Chart 11). Most notably, the United States exports half of the wheat it produces. In addition, 30% of domestic oil production and almost 20% of natural gas and corn production are exported annually. However, although the United States may be buffered in some ways, the domestic market is not immune to disruptions. Oil and agricultural industries operate in global markets, so U.S. producers and consumers still face elevated uncertainty, volatility and higher domestic prices following foreign supply shocks.
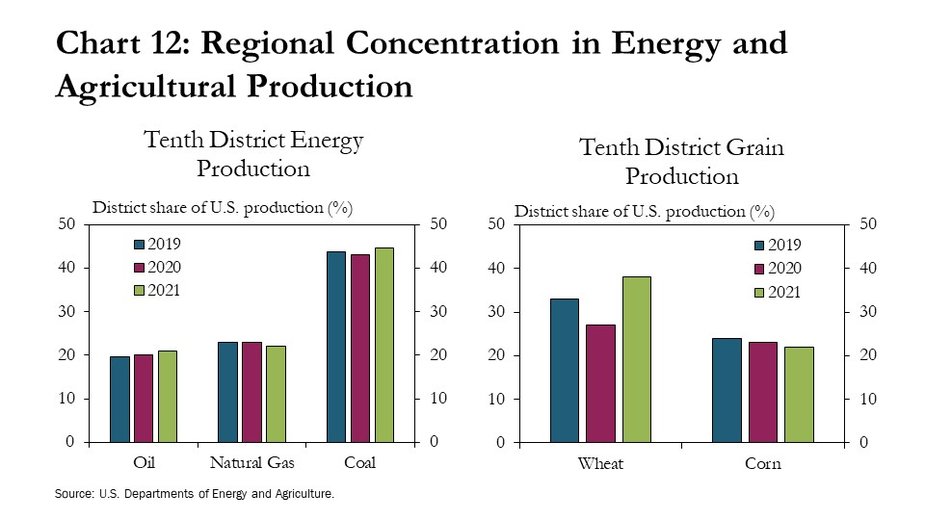
The Tenth District is particularly concentrated in the production of commodities. Combined, producers in the District make up a notable share of total U.S. energy and agricultural production (Chart 12). For example, the District accounts for around 40% of U.S. coal and wheat production and 20% of oil, natural gas and corn production. Higher commodity prices in the midst of global disruptions may adversely affect the District in several ways, but the ramifications of price inflation may be somewhat offset by higher profit margins for producers.
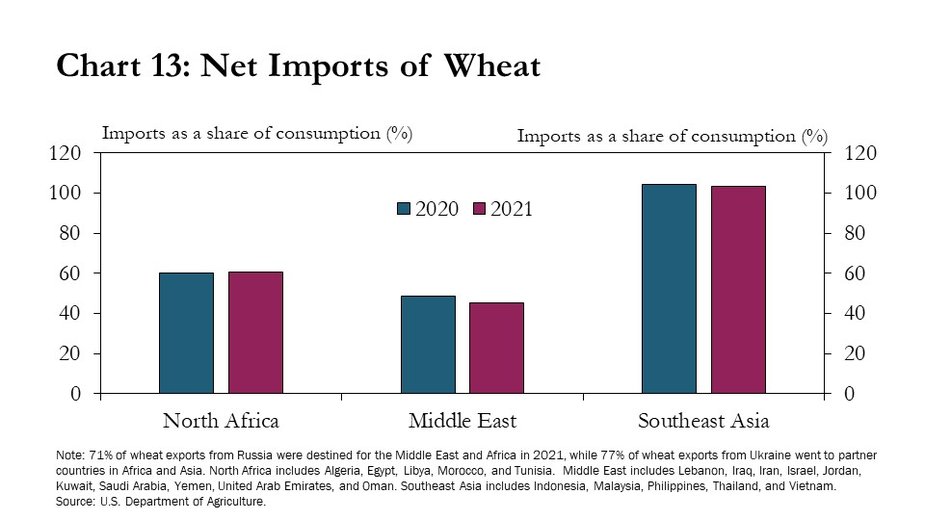
Elsewhere, however, several countries may be particularly exposed to shortages alongside import dependencies. A large share of Russian wheat exports is typically destined for countries in North Africa and the Middle East (Chart 13). Due to constraints surrounding climate and natural resources, these countries typically import more than half of the wheat they consume. Also, countries in Southeast Asia typically import large quantities of wheat and other grains from Ukraine and rely almost exclusively on imports for domestic consumption. Additionally, Europe is highly dependent on Russian energy sources, making the continent acutely at risk from conflict or sanction-induced energy supply disruptions (External LinkEIA).
Conclusion
Russia’s invasion of Ukraine has had swift and substantial effects on commodity markets that could be long-lasting. Disruptions associated with the invasion have contributed to increases in commodity prices, which could support commodity-producing regions and businesses. However, higher prices for agricultural inputs, energy and food have created additional challenges for net-importing regions, supply chains and consumers.
Outcomes of Russia’s invasion of Ukraine are shrouded with extreme uncertainty but could include persistent disruptions and elevated prices. In the coming months, higher prices could cause consumers to consider lower-cost alternatives. For example, consumers may switch from wheat to other grains like rice, or demand could increase for more energy-efficient modes of transportation (e.g., electric vehicles). In the years ahead, the magnitude of this shock, the depth and breadth of imposed sanctions, and the rise in uncertainty are likely to have ramifications across global trade flows. Businesses and countries may seek to reduce supply risks and exposures to potentially unreliable or adversarial trade partners. For example, the eurozone may diversify natural gas supplies away from Russia, and wheat buyers in the Middle East may find alternative sources of grain (External LinkGhosal and Anand 2022). Furthermore, trade reconfiguration is generally persistent and unlikely to easily revert to the previous state, even after the disruption (External LinkCowley 2020).
In sum, although the exact path of disruptions and associated adjustments is largely unknown, the shock associated with the war in Ukraine has multifaceted characteristics, affecting numerous industries and regions simultaneously, is marked with high levels of uncertainty, and could persist for years.
Endnotes
-
1 The Tenth District includes Kansas, Nebraska, Oklahoma, Wyoming, and Colorado, as well as western Missouri and northern New Mexico.
-
2 In this article, oil and wheat are the primary illustrative examples of agricultural and energy commodities that have been directly impacted by Russia’s invasion of Ukraine, and impacts on other commodities, such as natural gas and corn, are also described but in less detail.
-
3 Calculated here as the duration of militarized interstate disputes (MIDS) consisting of more than 500 battle deaths and as reported in the MIDS 5.0 dataset (Palmer, McManus, et al. 2020).
-
4 The median duration of non-military sanctions, since 1948 is about four years. Sanctions durations are author calculation using Global Sanctions Data Base (Felbermayr, Kirilakha, et al. 2021).
-
5 Russia financial sanctions (and Iran 2012-16) include SWIFT restrictions, which inhibit the ability of the country to conduct business globally. External LinkSociety for Worldwide Interbank Telecommunications (SWIFT) is global member owned cooperative and provider of secure financial messaging. SWIFT determine access to the global banking system, notably international bank transfers.
References
Cowley, Cortney. 2020. “Reshuffling in Soybean Markets following Chinese Tariffs.” Federal Reserve Bank of Kansas City, Economic Review, vol. 105, no. 1, pp. 70.
D’Acunto, Francesco, Ulrike Malmendier, Juan Ospina, and Michael Weber. 2021. “Exposure to grocery prices and inflation expectations.” Journal of Political Economy, vol. 129, no. 5, pp. 1615-1639.
Energy Information Agency (EIA). 2022. “Short-Term Energy Outlook,” May 10.
Energy Information Agency (EIA). 2022. “Europe is a key destination for Russia’s energy exports,” Today in Energy. March 14.
Federal Reserve Board (FRB). 2022. “Summary of Commentary on Current Economic Conditions by Federal Reserve District,” Beige Book. April 20.
Federal Reserve Bank of Kansas City (FRBKC). 2022. “FRBKC Energy Survey,” April 08.
Felbermayr, G., A. Kirilakha, C. Syropoulos, E. Yalcin, and Y.V. Yotov. 2020. “The Global Sanctions Data Base.” Eurpoean Economic Review. Volume 129:October.
Ghosal, Sutanuka and Shambhavi Anand. 2022. “In a first, Turkey places order for 50,000-tonne Indian wheat.” The Economic Times. May 11.
Holtemeyer, Brian. 2011. “A Primer on Consumer Spending on Food and Energy.” Federal Reserve Bank of Minneapolis. August 24.
International Energy Agency (IEA). 2022. “How Europe can cut natural gas imports from Russia significantly within a year,” March 3.
Kilian, Lutz, and Xiaoqing Zhou. 2020. "Oil Prices, Gasoline Prices and Inflation Expectations: A New Model and New Facts.” Federal Reserve Bank of Dallas. Working Paper. No. 2025.
Palmer, Glenn, Roseanne W. McManus, Vito D’Orazio, Michael R. Kenwick, Mikaela Karstens, Chase Bloch, Nick Dietrich, Kayla Kahn, Kellan Ritter, Michael J. Soules. 2020. "The MID5 Dataset, 2011-2014: Procedures, Coding Rules, and Description." Working Paper.
Sarkees, Meredith Reid, and Phil Schaefer. 2000. “The Correlates of War Data on War: An Update to 1997.” Conflict Management and Peace Science. Volume 18 (1): Fall.
The views expressed are those of the authors and do not necessarily reflect the positions of the Federal Reserve Bank of Kansas City or the Federal Reserve System.
Authors

Cortney Cowley
Assistant Vice President and Oklahoma City Branch Executive

David Rodziewicz
Advanced Economics Specialist