Larger sized operating loans continued to boost farm lending activity. The volume of non-real estate farm loans increased by more than 10% for the third consecutive quarter. Operating loans accounted for nearly all the growth, driven by a nearly 25% increase in the average size of those loans. Alongside continued growth in lending, interest rates rose sharply and pushed financing expenses to the highest level since 2019.
Strong agricultural prices continued to support the farm economy, but the rapid rise in production expenses could pressure profit margins, and has shown initial signs of pushing demand for financing higher. Prices of most major commodities remained elevated alongside favorable market conditions and supported a positive outlook for farm finances through the end of 2022. Headwinds have intensified in recent months however, as uncertainty about supply and demand for many farm products in the coming year has led to price volatility. In addition, large portions of the U.S. continued to be heavily impacted by drought which could hinder revenue prospects and has been particularly challenging for cattle producers.
Third Quarter National Survey of Terms of Lending to Farmers
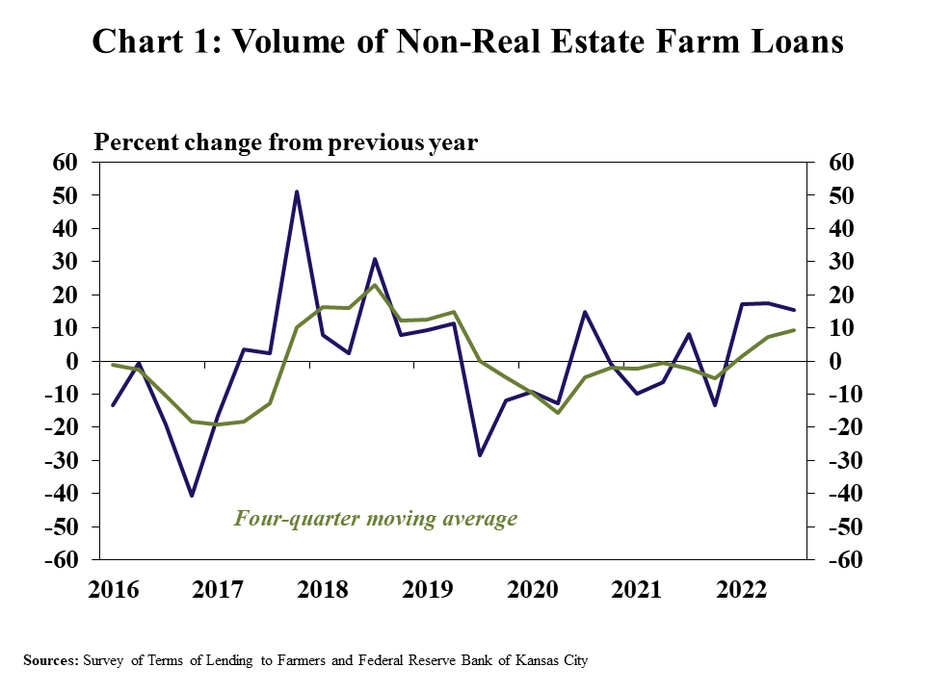
Non-real estate farm lending at commercial banks increased at a steady pace in the third quarter. The volume of farm loans increased 15% from a year ago, a rate similar to the previous two quarters (Chart 1). On a rolling four-quarter basis, non-real estate lending was about 10% higher which marked the fastest growth over a one-year span since 2019.
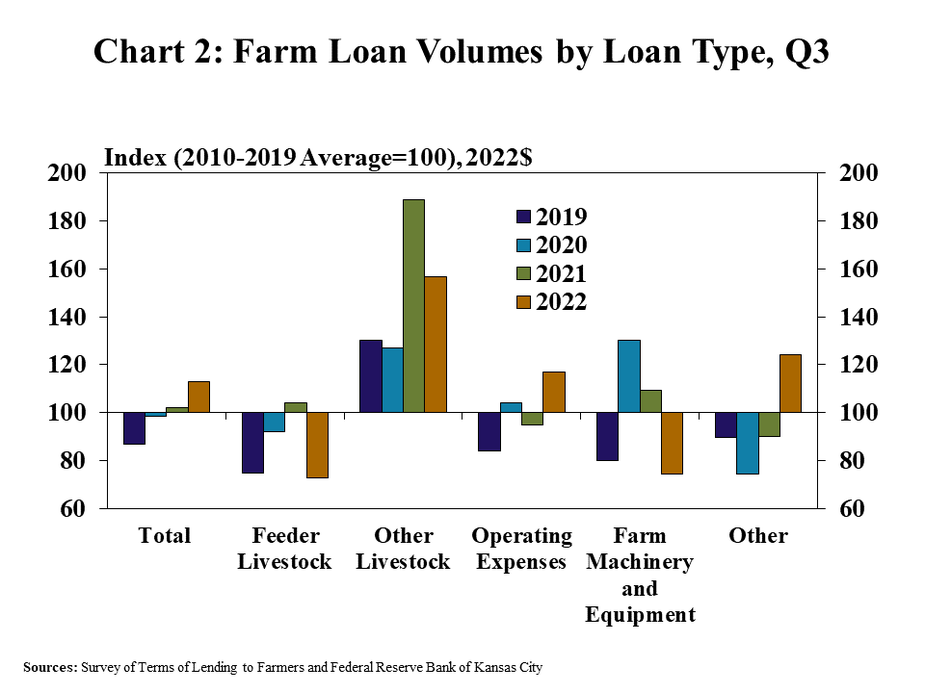
Loans for operating expenses drove the increase in overall lending activity. The volume of farm operating loans increased almost 30% from a year ago and was notably higher than recent averages for the third quarter (Chart 2). Loans for other primary purposes, including lending for livestock purchases, declined slightly and were below the 10-year average for this same time of year.
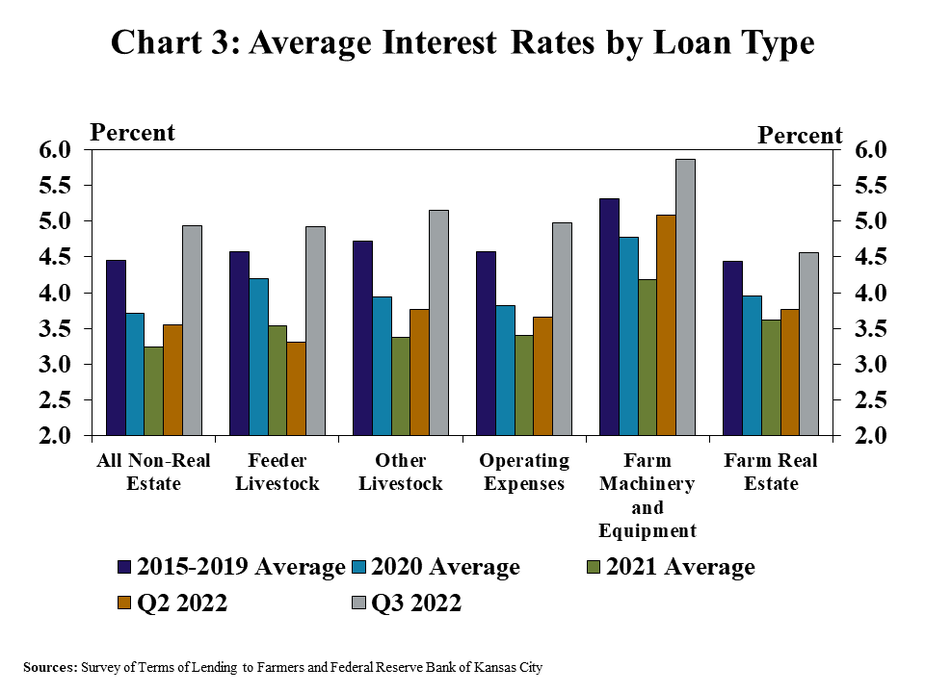
As lending grew further, interest rates on agricultural loans increased sharply alongside higher benchmark rates. The rates charged on all types of farm loans were an average of 180 basis points higher than the same time a year ago (Chart 3). The rapid rise pushed rates for all types of loans to the higher level since 2019 and slightly above the average from 2015-2019.
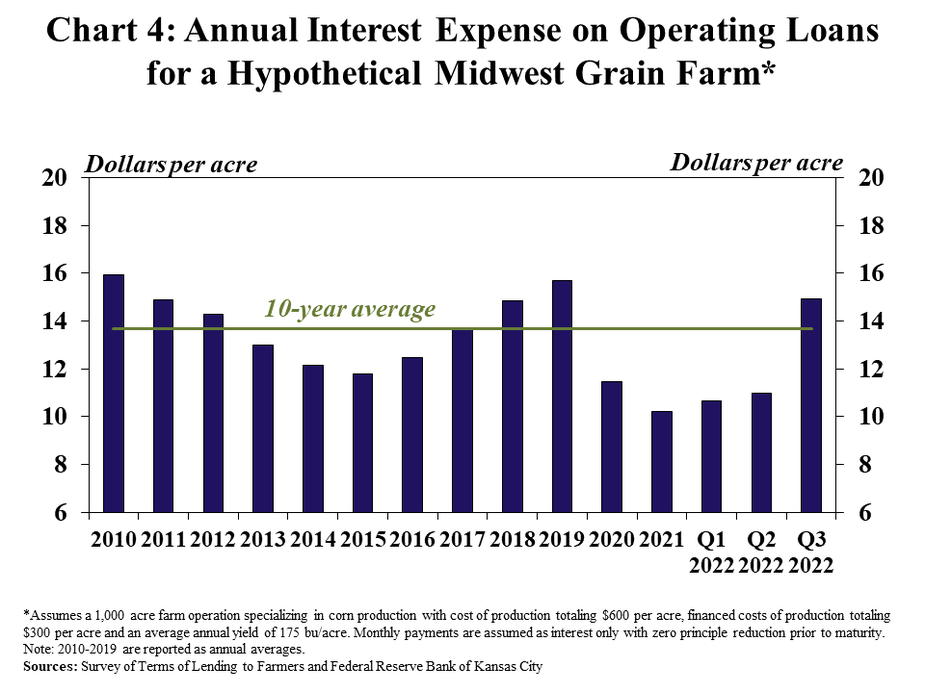
As interest rates edged higher, borrowing costs grew notably from historic lows reached in 2021. Based on current rates for an average operating note, the annual interest expense for a hypothetical mid-size grain farm in the Midwest would total about 15 dollars per acre or about 2 bushels of corn per acre at current prices (Chart 4). The notable rise in financing costs pushed interest expenses slightly above the recent historical average and could be more pronounced for operations with higher debt needs.
Data and Information
National Survey of Terms of Lending to Farmers Historical Data
National Survey of Terms of Lending to Farmers Tables
About the National Survey of Terms of Lending to Farmers
The views expressed are those of the authors and do not necessarily reflect the positions of the Federal Reserve Bank of Kansas City or the Federal Reserve System.
Authors

Nate Kauffman
Senior Vice President, Economist, and Omaha Branch Executive; Executive Director of the Center for Agriculture and the Economy
