Agricultural credit conditions remained strong in the second quarter, but slower improvement was expected in the coming months. Farm income increased further according to respondents of the Federal Reserve Surveys of Agricultural Credit Conditions, but the pace of increase slowed from recent quarters and further softening was expected going forward. Farm loan repayment rates continued to strengthen, but the pace of improvement also slowed. Following nearly two years of acceleration, farmland values also showed signs of moderating as interest rates increased more notably.

Strength in farm finances continued to support a positive outlook for agricultural credit conditions through the remainder of 2022, but risks to the farm economy have become more notable. Crop and livestock prices remained elevated, but have been volatile in recent months alongside ongoing uncertainty about the outlook for supply and demand of some major commodities. With substantial increases in production costs over the past two years, profit margins for many producers could be pressured with a sizable decline in commodity prices. Despite growing risks, balance sheets for most producers remained strong and profit opportunities during 2022 remained well in reach.

Second Quarter Federal Reserve District Ag Credit Surveys

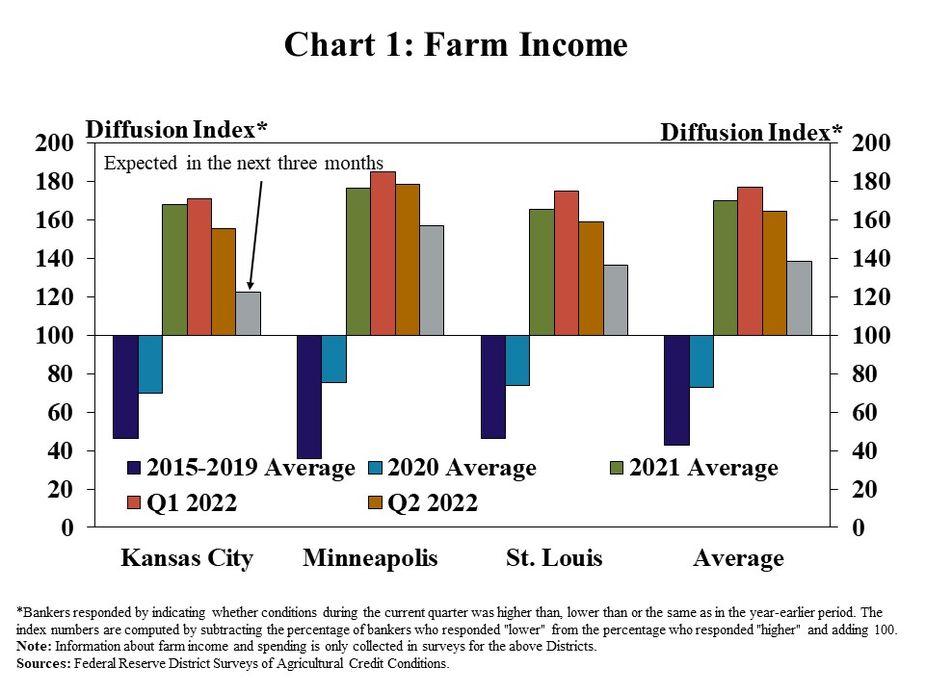
Farm income remained strong in the second quarter, but slower growth was anticipated during the months ahead in some areas. The majority of banks responding to the Federal Reserve Surveys of Agricultural Credit Conditions continued to report that farm income was higher than a year ago, but the share dropped modestly from recent quarters in the Kansas City and St. Louis regions (Chart 1). Alongside intensifying pressures from rising input costs, the share of respondents expecting incomes to continue increasing in the coming months was notably lower.

Chart 1: Farm Income – is a clustered column chart showing the diffusion index* of farm income for the Kansas City, Minneapolis and St. Louis Districts. Each of the Districts includes columns for 2015-2019 Average, 2020 Average, 2021 Average, Q1 2022, Q2 2022 and Expected in the next three months.  *Bankers responded by indicating whether conditions during the current quarter was higher than, lower than or the same as in the year-earlier period. The index numbers are computed by subtracting the percentage of bankers who responded "lower" from the percentage who responded "higher" and adding 100. Note: Information about farm income and spending is only collected in surveys for the above Districts. Sources: Federal Reserve District Surveys of Agricultural Credit Conditions.

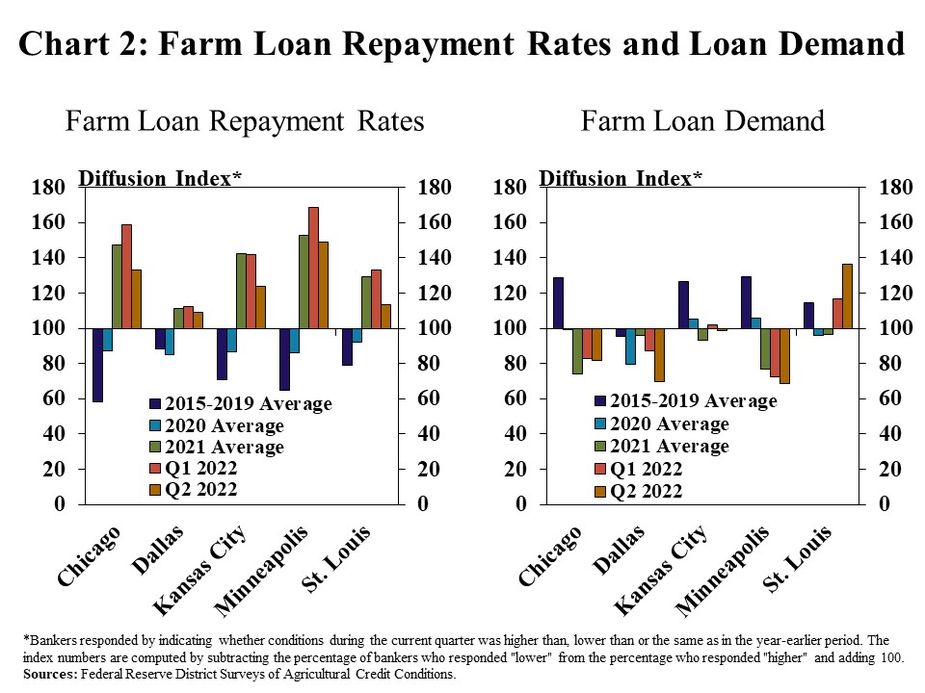
Similar to farm income, credit conditions also remained strong, but the pace of improvement slowed. Farm loan repayment rates continued to increase steadily in the second quarter, but a smaller share of banks reported that repayment was higher than a year ago (Chart 2, left panel). Demand for non-real estate farm loans remained subdued in all regions except the St. Louis District as strong farm finances provided ongoing support to working capital (Chart 2, right panel).

Chart 2: Farm Loan Repayment Rates and Loan Demand -includes two individual charts. Left, Farm Loan Repayment Rates: is a clustered column chart showing the diffusion index* of farm loan repayment rates for the Chicago, Dallas, Kansas City, Minneapolis and St. Louis Districts. Each of the Districts includes columns for 2015-2019 Average, 2020 Average, 2021 Average, Q1 2022 and Q2 2022. Right, Farm Loan Demand, is a clustered column chart showing the diffusion index* of farm loan demand for the Chicago, Dallas, Kansas City, Minneapolis and St. Louis Districts. Each of the Districts includes columns for 2015-2019 Average, 2020 Average, 2021 Average, Q1 2022 and Q2 2022.   *Bankers responded by indicating whether conditions during the current quarter was higher than, lower than or the same as in the year-earlier period. The index numbers are computed by subtracting the percentage of bankers who responded "lower" from the percentage who responded "higher" and adding 100. Sources: Federal Reserve District Surveys of Agricultural Credit Conditions.

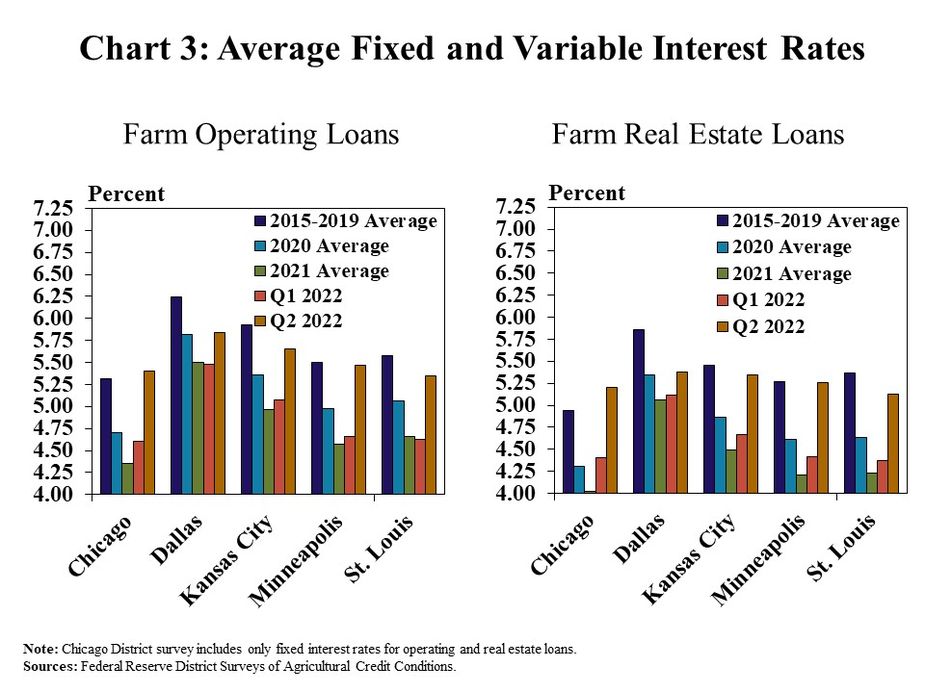
Interest rates on agricultural loans jumped higher alongside recent increases in benchmark rates. Following a 125-basis point rise in the Federal Funds Rate since the prior survey period, interest rates on farm real estate and operating loans rose by an average of nearly 70-basis points from last quarter (Chart 3). Average rates reached the highest level since 2019 across all regions and fixed rates surpassed the average from 2015-2019 in the Chicago District.

Chart 3: includes two individual charts. Left, Farm Operating Loans: is a clustered column chart showing the average interest rate on farm operating loans for the Chicago, Dallas, Kansas City, Minneapolis and St. Louis Districts. Each of the Districts includes columns for 2015-2019 Average, 2020 Average, 2021 Average, Q1 2022 and Q2 2022. Right, Farm Real Estate Loans: is a clustered column chart showing the average interest rate on farm real estate loans for the Chicago, Dallas, Kansas City, Minneapolis and St. Louis Districts. Each of the Districts includes columns for 2015-2019 Average, 2020 Average, 2021 Average, Q1 2022 and Q2 2022.  Note: Chicago District survey includes only fixed operating and real estate loans.  Sources: Federal Reserve District Surveys of Agricultural Credit Conditions.

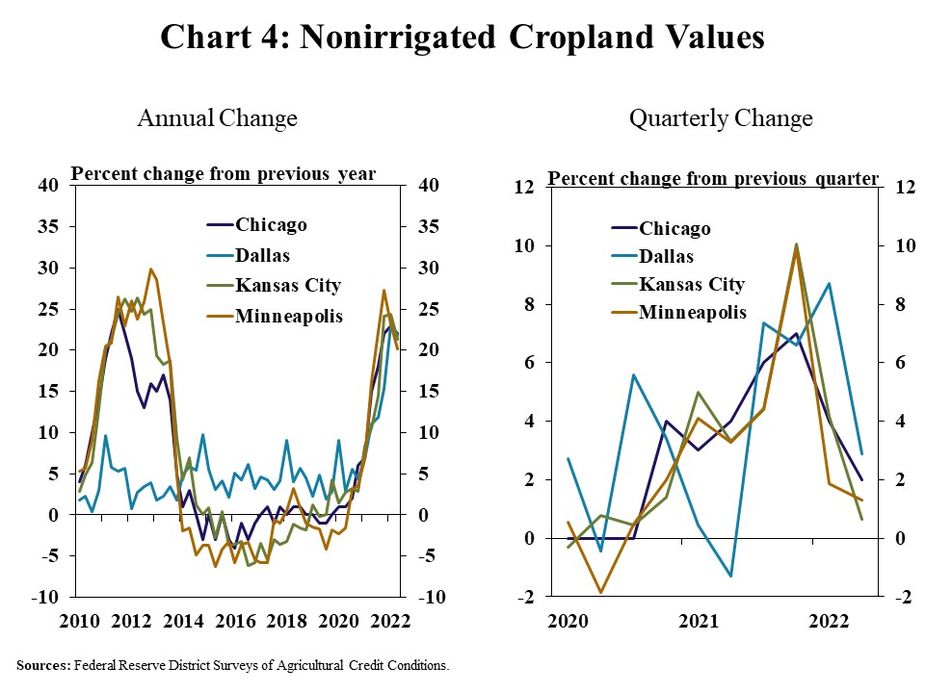
Alongside the uptick in interest rates and signs of softening in the farm economy, the acceleration in agricultural real estate values abated. The value of nonirrigated cropland was about 20% higher than a year ago across participating areas, which was a slower pace of increase than last quarter and followed two years of quickening growth (Chart 4, left panel). Land values grew by an average of about 2% from the previous quarter, which was the slowest pace of increase since early 2020 (Chart 4, right panel).

Chart 4: Nonirrigated Cropland Values – includes two individual charts. Left, Annual Change: is a line chart showing the percent change in nonirrigated cropland values from the previous year the Chicago, Dallas, Kansas City and Minneapolis Districts in every quarter from Q1 2010 to Q2 2022. Right, Quarterly Change: is a line chart showing the percent change in nonirrigated cropland values from the previous quarter the Chicago, Dallas, Kansas City and Minneapolis Districts in every quarter from Q1 2020 to Q2 2022.  *Bankers responded by indicating whether conditions during the current quarter was higher than, lower than or the same as in the year-earlier period. The index numbers are computed by subtracting the percentage of bankers who responded "lower" from the percentage who responded "higher" and adding 100.’ Sources: Federal Reserve District Surveys of Agricultural Credit Conditions.

Data and Information

Excel SpreadsheetFederal Reserve Ag Credit Surveys Historical Data

Excel SpreadsheetFederal Reserve Ag Credit Surveys Tables

txtAbout the Federal Reserve Ag Credit Surveys

Authors

Nate Kauffman

Senior Vice President, Economist, and Omaha Branch Executive

Nate Kauffman is Senior Vice President and Omaha Branch Executive at the Federal Reserve Bank of Kansas City. In his role as the Kansas City Fed's lead economist and represe…

Ty Kreitman

Associate Economist

Ty Kreitman is an associate economist in the Regional Affairs Department at the Omaha Branch of the Federal Reserve Bank of Kansas City. In this role, he primarily supports the F…