Although growth in food prices has slowed in recent months, food inflation has remained above broader measures of inflation. Chart 1 shows that although food prices closely tracked the overall consumer price index (CPI) over the last two decades, food inflation has considerably outpaced headline inflation more recently. As of March 2023, the price of a common basket of food products (green line) was nearly 9 percent higher than at the beginning of 2021.
Chart 1: Food inflation has been above headline measures of inflation since early 2022
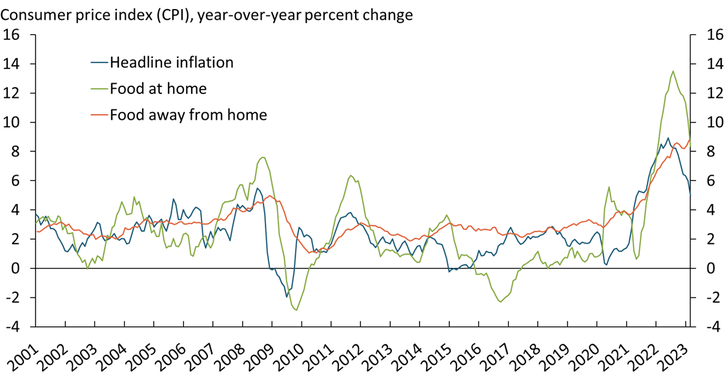
Source: Bureau of Labor Statistics (BLS).
The COVID-19 pandemic contributed to a dramatic shift in consumers’ food purchases and disrupted the balance of supply and demand. Chart 2 shows that expenditures on food away from home (blue line) declined substantially in early 2020, as the adoption of public health measures increased demand for food from grocery stores (food at home) and reduced demand for spending at restaurants and food service providers (food away from home). As public health measures began to ease in 2021, consumer spending on food away from home rebounded, surpassing its long-term trend (dotted blue line) in real terms by 2022. Over the same period, spending on food at home (green) moderated to its long-term trend (dotted green line). Although these movements suggest some softening in demand for food at home, prices for food at home have remained notably high.
Chart 2: By 2022, consumer spending on food away from home surpassed its long-term trend, while spending on food at home fell back to its long-term trend
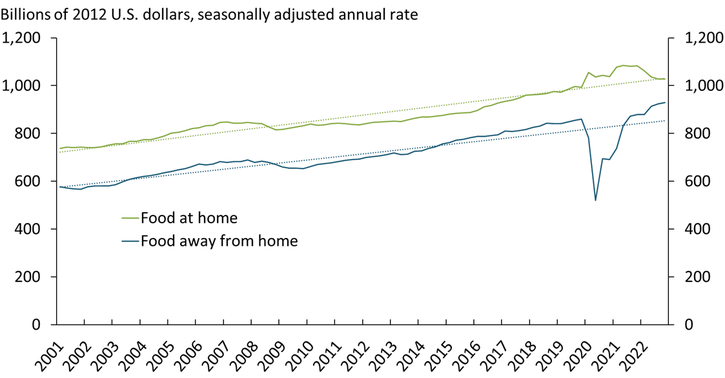
Note: Dotted lines show linear trends for food away from home and food at home from 2001 to 2022.
Source: BEA.
Labor market tightness has likely been a large contributor to the recent increases in food prices. Chart 3 shows that labor market tightness—calculated as the ratio of job vacancies (V) to unemployed workers (U)—has become more tightly correlated with the CPI for food at home over the past two years. From 2001 to 2020 (blue dots), labor markets were notably less tight, and food inflation was substantially less correlated with labor market tightness. Since the beginning of 2021, however, the price of food at home has generally increased at a faster pace alongside substantial tightening in labor market conditions (green dots).
Chart 3: Food inflation has increased alongside labor market tightness
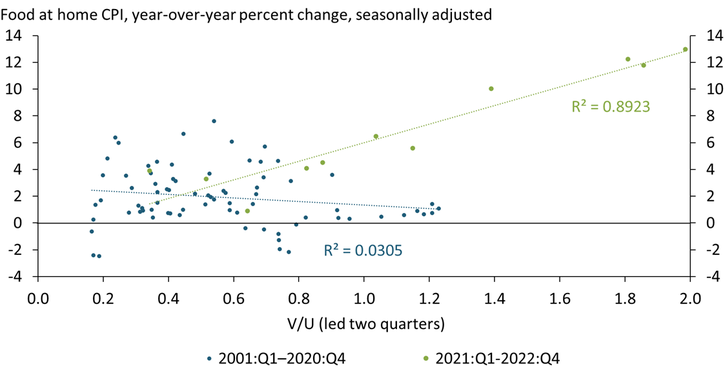
Note: The relationship is robust to a one- and three-quarters lead in V/U.
Source: BLS.
Chart 4 shows that labor market tightness has led to sharper increases in average weekly wages in sectors linked to food production and distribution since 2021._ Recent estimates suggest that salary and benefits account for about 40 percent of the total input cost of most food and can have a material effect on consumer prices (Cowley and Scott 2022). Higher wages may also drive up prices by increasing demand for some food products at local stores—similar to how wages have driven demand for housing and, subsequently, rent inflation (Bundick, Smith, and Van der Meer 2023)._
Chart 4: Wages across the food supply chain have responded more to labor market tightness since 2021
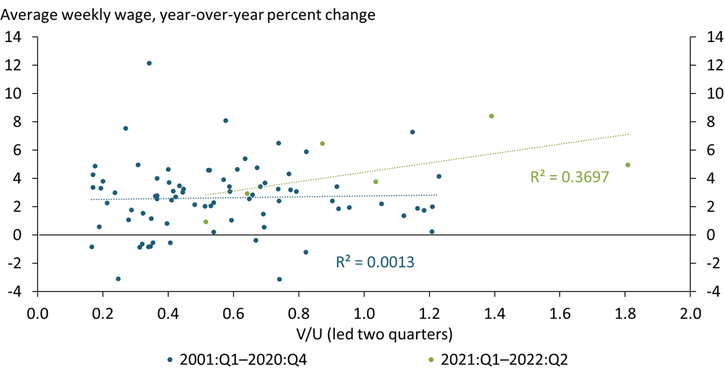
Notes: We report nominal average weekly wages. We find a qualitatively similar relationship with one or three led quarters. The outlier point at the top left of the chart is 2020:Q4, which experienced an abnormal increase in average weekly wages reported in the Quarterly Census of Employment and Wages, possibly in anticipation of end-of-the-year hiring decisions for 2021 when labor markets became very tight.
Source: BLS.
Tight labor markets and wage increases have put upward pressure on the costs of labor, production, and distribution, which have been passed on to consumers. Chart 5 shows that processed foods drove nearly three-quarters of the price increase in food at home by the end of 2022. These foods are linked to more labor-intensive segments downstream in the supply chain, such as processing, wholesaling, and retailing (Cowley and Scott 2022; Smith 2022). Supply-side cost pressures in an environment where consumers are willing to pay more for some food items at grocery stores likely explain the strong correlation of food inflation and labor market tightness since 2021.
Chart 5: Growth in the price of processed food has driven inflation for food at home since 2022
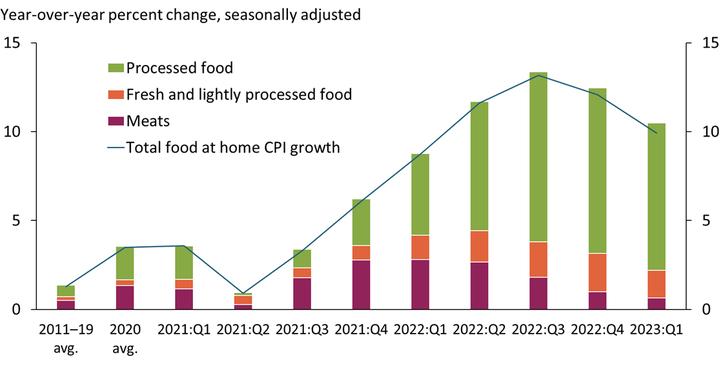
Notes: “Processed food” includes cereal and baked goods, cheese, ice cream, other dairy products, processed fruit and vegetables, beverages, and other food at home. “Fresh and lightly processed food” includes eggs, milk, and fresh produce. “Meats” include all meat products as defined by the BLS.
Sources: BLS and authors’ calculations.
Although food inflation has eased in recent months, it remains persistently high. Labor-intensive processed food items have accounted for the bulk of recent increases in grocery prices, and tight labor market conditions have put upward pressure on wages and contributed to higher food production costs. If household budgets tighten and demand for food at restaurants continues to recover, some of the price pressures at grocery stores could ease. In addition, monetary policy tightening may help ease food inflation by cooling the labor market, further bringing headline inflation back to target.
Endnotes
-
1 We include the average wage of animal food manufacturing, grain and oilseed milling, sugar and confectionery product manufacturing, fruit and vegetable preserving and specialty food manufacturing, dairy product manufacturing, animal slaughtering and processing, seafood product preparation and packaging, bakeries and tortilla manufacturing, other food manufacturing, grocery and related product merchant wholesalers, grocery and convenience retailers, and specialty food retailers in our analysis.
-
2 Higher-end food products that are slow to react to demand shocks are one example.
References
Bundick, Brent, A. Lee Smith, and Luca Van der Meer. 2023. “External LinkA Tight Labor Market Could Keep Rent Inflation Elevated.” Federal Reserve Bank of Kansas City, Economic Bulletin, March 1.
Cowley, Cortney, and Francisco Scott. 2022. “External LinkCommodity Prices Have Limited Influence on U.S. Food Inflation.” Federal Reserve Bank of Kansas City, Economic Bulletin, September 23.
Smith, Aaron. 2022. “External LinkAgricultural Prices Aren’t Driving Food Price Inflation.” October 27.
Francisco Scott is an economist at the Federal Reserve Bank of Kansas City. Cortney Cowley is a senior economist at the bank. Ty Kreitman is an assistant economist at the bank. The views expressed are those of the authors and do not necessarily reflect the positions of the Federal Reserve Bank of Kansas City or the Federal Reserve System.
Authors

Francisco Scott
Senior Economist

Cortney Cowley
Assistant Vice President and Oklahoma City Branch Executive
