To combat high inflation, the Federal Reserve has raised the federal funds rate by 500 basis points over the last 14 months. Although demand has since slowed substantially in sectors sensitive to interest rates, inflation has declined more modestly. Inflation in core personal consumption expenditures (PCE) declined from 5.4 percent in March 2022 to 4.7 percent in April 2023, well above the Fed’s 2 percent target. With mixed signals from labor markets and recent stress in the financial sector, economists have turned to assessing the stance, or effective tightness, of monetary policy to determine whether these recent rate hikes are sufficient to return inflation to target.
Assessing the relative tightness of monetary policy requires a measure that can account for both inflation expectations (which influence households’ savings or investment decisions) and the natural rate of interest—a long-run benchmark rate known as r*, which is commonly defined as the real interest rate consistent with 2 percent inflation and steady output growth._ Accordingly, we assess the stance of monetary policy by taking the difference between the federal funds rate and one-quarter-ahead inflation expectations and then subtracting r*. A value above zero signals a restrictive stance of monetary policy, while a value below zero signals an accommodative stance._
Chart 1 shows that the stance of monetary policy (blue line) and the federal funds rate (green line) typically move together, though the levels differ substantially. In the 1970s and early 1980s, for example, the federal funds rate was frequently above 10 percent. However, the policy stance was not necessarily restrictive, as elevated inflation expectations and a high r* mitigated effects from higher interest rates. In the current tightening cycle, rate hikes had to initially catch up to rising inflation, and the stance did not start to grow more restrictive until the second half of 2022. Thus, although the Fed has hiked interest rates since March 2022, the stance of monetary policy has only been restrictive since 2023:Q1.
Chart 1 also sheds light on the relationship between the monetary policy stance and inflation (orange line). In the 1970s, inflation increased until the policy stance became sufficiently tight in 1982. At that time, a stance above 6 percent was necessary to meaningfully reduce inflation over longer periods. Although the current stance of 1.7 percent is much lower, so is inflation relative to the 1970s and early 1980s.
Chart 1: Although federal funds rate hikes began in 2022:Q1, the stance of monetary policy did not become restrictive until 2023:Q1
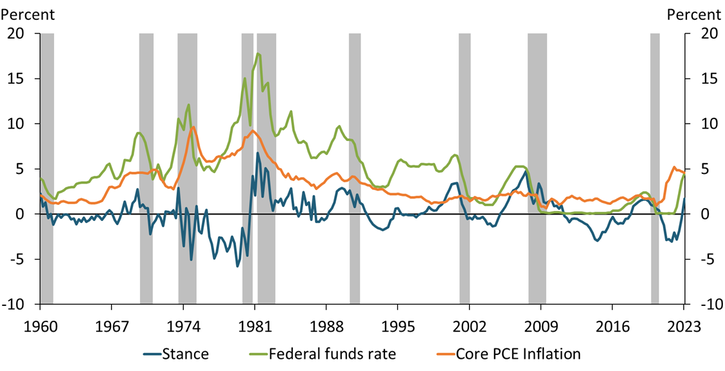
Notes: A stance value above zero signals restrictive monetary policy, while a stance value below zero signals accommodative monetary policy. Shaded areas denote National Bureau of Economic Research (NBER)-defined recessions.
Sources: Federal Reserve Bank of Kansas City (Haver Analytics), NBER, and authors’ calculations.
A restrictive stance of policy has historically brought about slower growth and lower inflation. For example, Chart 2 shows how growth and inflation respond to a restrictive monetary policy stance based on a statistical model and historic data since 1960._ The blue and green lines show the expected paths for core PCE inflation and real GDP, respectively, over the next five years (20 quarters). A tightening in the stance of policy of a similar magnitude to what has occurred over the past year is expected to slow inflation gradually and modestly, lowering year-over-year core PCE inflation by 80 basis points by the end of 2026._ At the same time, the decline in inflation is expected to coincide with a 1.2 percent cumulative reduction in real GDP over the next two years. However, the uncertainty around these projected effects is unusually high given the unique state of labor markets and household balance sheets. For example, given the unusual shortage of workers in the labor market and excess household savings, the decline in GDP, and perhaps inflation, could be more muted._
Chart 2: The current policy stance is expected to slow the economy and gradually reduce inflation
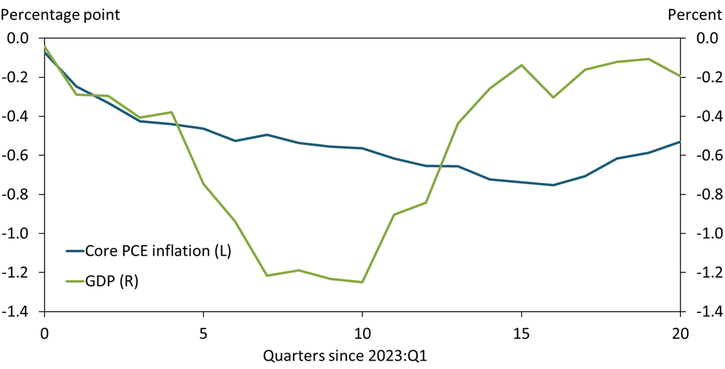
Note: The chart shows the cumulative effect of the change in stance over the last year on the time path of each variable relative to the time path without any changes in stance.
Sources: Federal Reserve Bank of Kansas City (Haver Analytics) and authors’ calculations.
Given that core PCE inflation is currently running at 4.7 percent, the reduction in inflation projected in Chart 2 would not bring inflation close to 2 percent by the end of the forecasting horizon. However, the overall tightness of monetary policy depends not only on the increase in the stance, but also on how long the restrictive stance of policy is maintained.
In past episodes when the FOMC has tightened policy with a direct intent to lower inflation, the stance of monetary policy has remained restrictive for several years. In May 1981 and December 1988, for example, the FOMC tightened policy with the intent of bringing down the rate of inflation (Romer and Romer 2023). Chart 3 shows that during both episodes, it was necessary to maintain a restrictive stance of policy for 12 quarters to bring about the intended reduction in inflation. During the 1981 cycle, inflation fell from 8.7 to 4.5 percent; during the 1988 cycle, inflation declined from 4.4 percent to about 2.5 percent by the early 1990s.
Chart 3: In past efforts to combat inflation, the FOMC has kept policy restrictive for several years
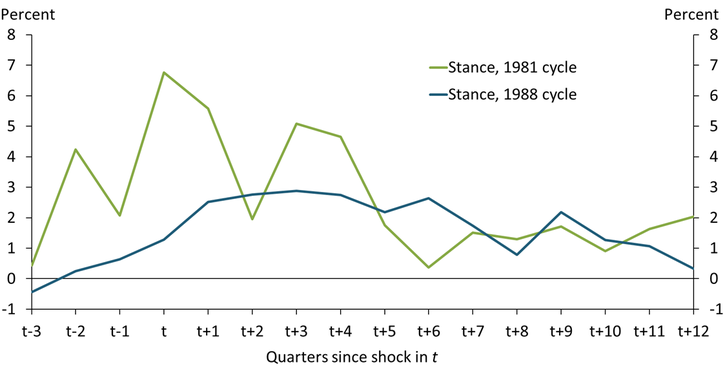
Notes: The chart shows the evolution of stance after two narratively identified contractionary monetary policy shock at time t intended to reduce inflation.
Sources: Federal Reserve Bank of Kansas City (Haver Analytics), Romer and Romer (2023), and authors’ calculations.
We conclude that although monetary policy has recently become restrictive, inflation tends to be sticky, and monetary policy may need to remain restrictive for some time to bring inflation back to the 2 percent target.
Endnotes
-
1 R* is slow-moving and determined by long-run trends in macroeconomic factors, such as productivity or demographics, as well as financial factors, such as financial integration or preferences for safe assets. R* is an unobserved variable. We estimate r* based on the methods developed in Laubach and Williams (2003) and Jordà and Taylor (2019). The underlying model is a standard New Keynesian framework. We cast the model in state space form and use the Kalman Filter to extract r*. We use quarterly data since 1960. One-quarter-ahead inflation expectations are based on the mean projection from the Survey of Professional Forecasters when available. Otherwise, we estimate an AR(1) model on observed inflation.
-
2 The stance measure relies on an estimate for r*. Estimates for r* are accompanied by considerable uncertainty. Consequently, there is also uncertainty around the stance of monetary policy.
-
3 We estimate the effect of the recent increase in stance on inflation, real GDP, and stance itself based on a series of Local Projections. For each variable, we regress cumulative changes over the next quarters on stance and four lags of stance. The displayed responses are then calculated based on the observed change in stance over the last year, multiplied by the estimated regression coefficients.
-
4 A recent working paper by Blanco, Ottonello, and Ranosova (2022) examines historic inflationary episodes across advanced and emerging markets. Typically, inflation surges within a year—such as the hike in U.S. inflation from mid-2021 to mid-2022—and is then followed by prolonged disinflation of up to six years until inflation reaches the same level as prior to the surge. The rather modest effect of the recent tightening in the stance of policy on inflation is in line with these findings.
-
5 A tight policy may primarily reduce job openings, without creating a large negative effect on output, facilitating a “soft landing.”
References
Blanco, Andrés, Pablo Ottonello, and Tereza Ranosova. 2022. “External LinkThe Dynamics of Large Inflation Surges.” National Bureau of Economic Research, working paper no. 30555, October.
Jordà, Òscar, and Alan M. Taylor. 2019. “External LinkRiders on the Storm.” National Bureau of Economic Research, working paper no. 26262, September.
Laubach, Thomas, and John C. Williams. 2003. “External LinkMeasuring the Natural Rate of Interest.” Review of Economics and Statistics, vol. 85, no. 4, pp. 1063–1070.
Romer, Christina D., and David H. Romer. 2023. “External LinkPresidential Address: Does Monetary Policy Matter? The Narrative Approach after 35 Years.” American Economic Review, vol. 113, no. 6, pp. 1395–1423.
Johannes Matschke is an economist at the Federal Reserve Bank of Kansas City. Sai A. Sattiraju is a research associate at the bank. The views expressed are those of the authors and do not necessarily reflect the positions of the Federal Reserve Bank of Kansas City or the Federal Reserve System.
Author