Through the pandemic and the years that followed, Nebraska’s labor market has remained steady, though some new challenges have emerged and others have intensified. Although unemployment has remained low, only some industries have consistently contributed to job growth. In recent months, elevated policy uncertainty may have contributed to weaker growth in some industries, such as those more exposed to international trade. Despite a reduced pace of growth in some industries, labor scarcity has remained an ongoing challenge, with reduced immigration potentially also restricting the supply of available workers.
The employment situation in Nebraska in recent months has remained near long-term averages. Though the unemployment rate in the state has increased steadily in recent years, it was still slightly below its long-run average of 3.1 percent through April 2026 (Chart 1, Panel A). Similarly, though job growth has weakened in 2026, it has remained near its 1990-2026 average and growth rates leading up to the pandemic (Chart 1, Panel B). Although near-term developments may suggest some softening in the labor market, the softening has followed a period of significant strength, and has been a return to historical norms.
Chart 1. Employment situation
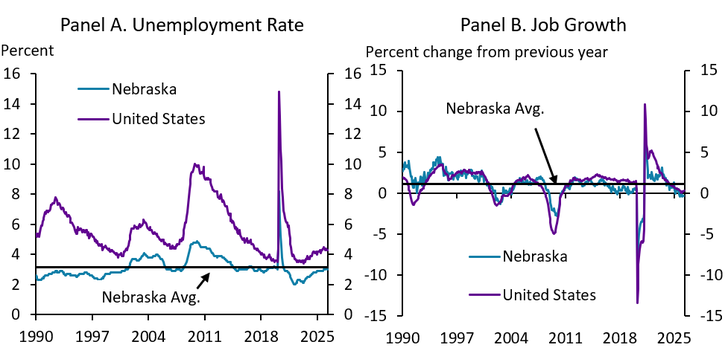
Sources: BLS, Haver Analytics.
A Subset of Industries Comprises Most Job Growth in Nebraska
Employment gains in Nebraska may fluctuate slightly from year to year, but long-running sectoral trends have remained steady for some time. Specifically, service-providing industries have generally grown steadily since 1990, with employment falling during recessions but recovering quickly. As of April 2026, employment at service-providing businesses was nearly 50 percent higher than in 1990 (Chart 2). In contrast, employment at goods-producing businesses has been weaker, falling significantly between 2001 and 2008 and only recovering to pre-2001 levels by early 2022.
Chart 2. Nebraska employment growth by sector
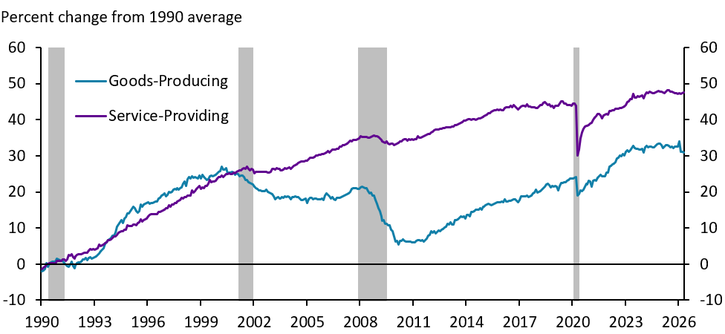
Note: Gray bars indicate NBER-defined recessions.
Sources: BLS, Haver Analytics.
Over the years, the construction industry has accounted for nearly all of the growth in goods-producing employment while service-providing employment has been more broad-based. As of 2026, construction employment in Nebraska was more than 140 percent higher than in 1990 and more than 20 percent higher than in 2020 (Table 1). In contrast, employment in the other major goods-producing industry (manufacturing) was only 1 percent higher in 2026 than in 1990, and less than 1 percent higher than in 2020. In service-providing industries, health care and leisure and hospitality account for a large portion of job growth since 1990 and even since 2020. While employment growth in other service sectors has been less pronounced in recent years, all industries except the information sector are larger than in 1990.
Table 1. Nebraska employment growth by major industry
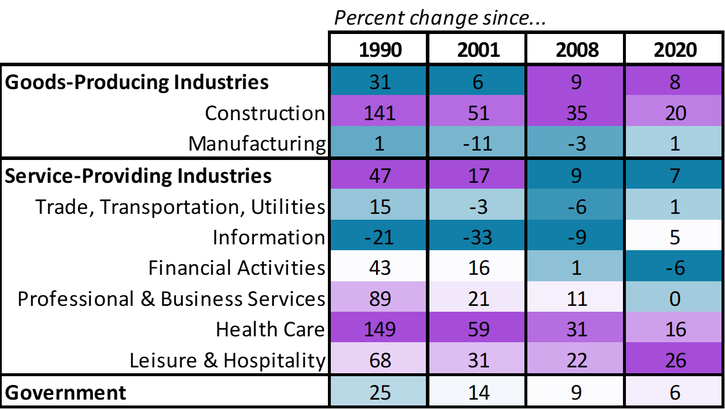
Sources: BLS, Haver Analytics.
Trade Exposure Has Potentially Affected Job Growth
Policy uncertainty has increased over the past several years. Since 2025, aggregate measures of uncertainty have been at or near levels only previously observed during the pandemic (Chart 3). In the Federal Reserve’s May 2025 External LinkBeige Book, a narrative of regional economies across the country, the word “uncertainty” appeared 76 times. At the time, a significant portion of uncertainty was related to trade policy and, while trade policy uncertainty has lessened somewhat, it has remained elevated relative to both the overall uncertainty index and previous instances of trade policy uncertainty.
Chart 3. Policy uncertainty
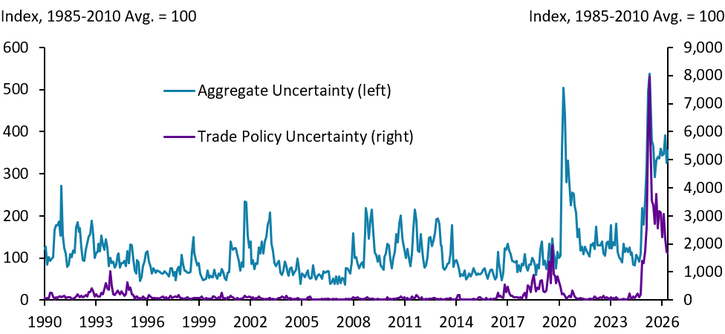
Note: policy uncertainty indexes quantify newspaper coverage of economic uncertainty. Aggregate uncertainty incorporates several sub-indexes measuring uncertainty in specific policy areas including, monetary policy, fiscal policy, health care, national security, entitlement programs, regulation, financial regulation, trade policy, and sovereign debt and currency crises.
Sources: PolicyUncertainty.com, Haver Analytics.
The cost of tariffs and elevated uncertainty surrounding their implementation may have weighed on employment in industries highly exposed to international trade in Nebraska. Throughout 2025 and 2026, employment in these industries was lower than the previous year (Chart 4). The effect of tariffs and trade policy uncertainty in Nebraska mirrors national conditions where exposure to imports has been associated with greater reductions in hiring (Matschke and Dzholos 2025). In contrast, industries with lower exposure to trade added jobs in Nebraska throughout 2025 until a major meatpacking plant closure in Lexington, Nebraska (not directly related to trade issues) significantly reduced employment in these industries in January 2026.
Chart 4. Nebraska goods-producing employment by exposure to international trade
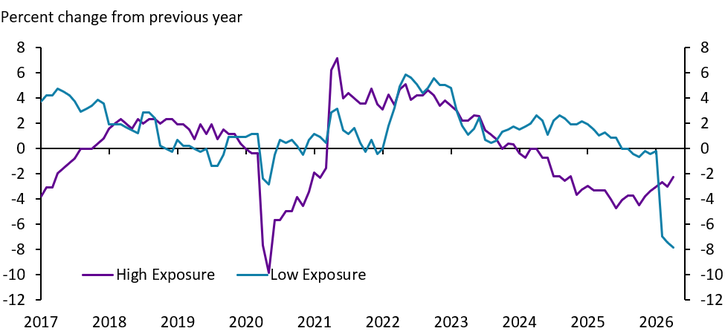
Note: the chart employs establishment survey data rather than QCEW data for the sake of timeliness. The establishment survey does not include agricultural employment. Exposure to international trade follows the procedure in the April 2025 Nebraska Economist.
Sources: BLS, Haver Analytics.
Labor Scarcity Concerns Remain and are Influenced by Immigration
Though job growth has slowed in recent months, labor scarcity has remained a concern in Nebraska. For the past decade, the number of job openings has exceeded the number of individuals who are unemployed (Chart 5). While labor scarcity improved in Nebraska from the post-pandemic peak in 2022, there were still more open jobs in 2025 than unemployed people available to fill them. Nebraska has tended to have a much lower unemployment rate and much higher labor force participation rate than other states, meaning that most of the available labor in the state is already employed (Kauffman and McCoy 2023). Thus, to increase workforce availability, more people would have needed to move to the state to meet labor demand.
Chart 5. Job openings relative to the number of unemployed people
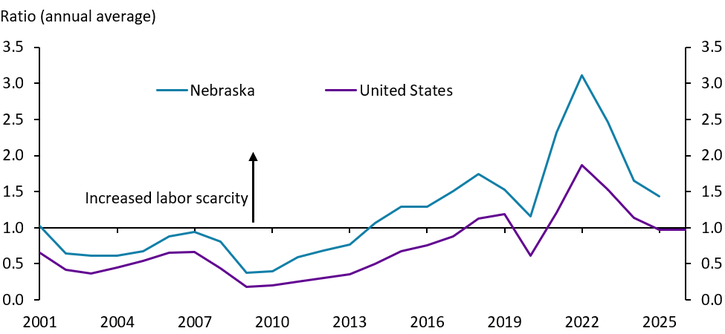
Sources: BLS, Haver Analytics.
Historically, immigration to Nebraska has contributed to reducing labor scarcity. In fact, immigration has accounted for nearly all of the working-age population growth in Nebraska since 2010 (Gonzales 2026). On average, approximately 2,900 people moved to the state from foreign locations between 1991 and 2019 (Chart 6). Since 2022, the average number of immigrants moving to Nebraska per year has surged to more than 9,600 per year. Without the increase in immigration that began in 2022, labor scarcity – which reached historic levels in 2022 – would likely have been more severe.
Chart 6. Annual international migration to Nebraska
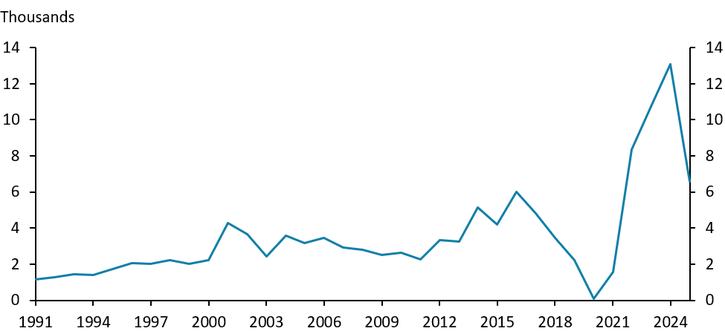
Sources: Census Bureau, author’s calculations.
Looking forward, the potential for job growth in Nebraska will likely continue to be constrained by labor scarcity. Demographic challenges underpinning the limited supply of labor in Nebraska are likely to be significant issues facing policymakers and business leaders in the coming years. While some industries have consistently added jobs in Nebraska, maintaining a steady pace of job gains in the future could be challenging in a labor market marked by persistent scarcity.
References
Gonzalez, Cindy. 2026, January 27. External LinkNebraska population rises slightly as international growth reverses. Nebraska Examiner.
Matschke, Johannes and Mariia Dzholos. 2025. Higher Tariffs Might Have Created Headwinds to Employment Growth in 2025. Economic Bulletin.
The views expressed are those of the authors and do not necessarily reflect the positions of the Federal Reserve Bank of Kansas City or the Federal Reserve System.
Author