
Growth in farm debt remained strong in the first half of 2026 and helped boost financial performance at agricultural banks. According to commercial bank Reports of Condition and Income, growth in non-real estate farm debt continued to be concentrated at agricultural banks through the second quarter of 2026 and growth in farm real estate debt was more consistent across all types of commercial lenders. Persistent strength in farm loan demand supported profitability and capital ratios at agricultural banks while liquidity for those lenders tightened gradually. Despite ongoing challenges in the crop sector, farm loan delinquency rates were unchanged from a year ago. Aggregate farm financial conditions have been resilient with support from government payments, strong cattle revenues and stable farm real estate values. Crop prices increased considerably in recent weeks, but the outlook for profitability remained relatively subdued as higher prices for key inputs also increased and prospects for crop yields in some areas have deteriorated.
Second Quarter 2026 Commercial Bank Call Report Data
Recent trends in farm debt across agricultural and non-agricultural banks continued in the second quarter. Similar to last quarter, growth in outstanding non-real estate farm loans at agricultural banks was strong and balances at non-agricultural banks declined slightly (Chart 1, left panel). Real estate debt was higher across both categories of lenders and the pace of growth also increased (Chart 1, right panel). While farm real estate debt balances have risen, the pace of growth remained modest and continued to signal only gradual deterioration in aggregate farm financial conditions.
Chart 1: Farm Debt Outstanding at Commercial Banks
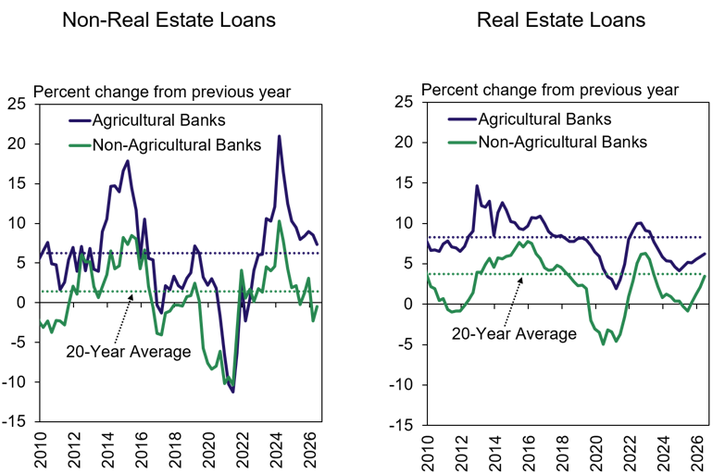
Note: Agricultural banks are defined as banks with total agricultural loans comprising at least 25% of total loans. Figures above are calculated using the same group of 881 agricultural banks from Q2 2026 in every quarter.
Sources: Reports of Condition and Income and Federal Reserve Board of Governors
As loan balances grew, farm loan delinquency rates were stable and relatively low. The share of farm debt past due 30 days or more was unchanged from the same time a year ago at both agricultural and non-agricultural banks (Chart 2, left panel). About half of all agricultural banks had minimal or zero past due farm loans and only a quarter had a farm loan delinquency rate above 1.4% (Chart 2, right panel).
Chart 2: Farm Loan Delinquency Rates at Commercial Banks, Q2
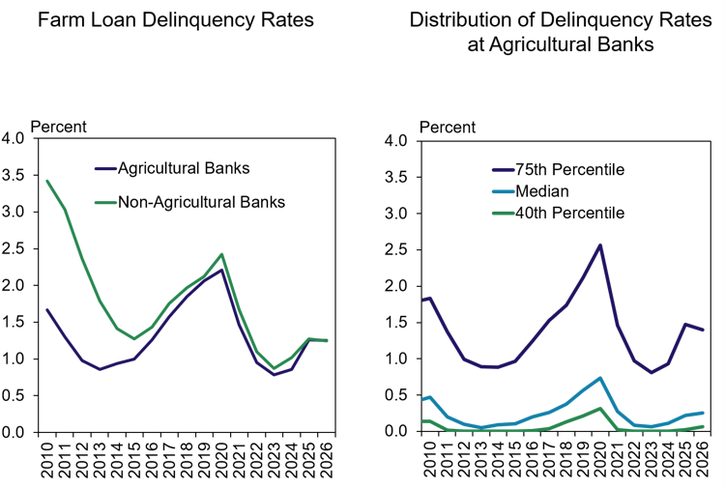
Note: Delinquent farm loans include all agricultural loans past due 30 or more days or non-accruing. Agricultural banks include all banks with farm loans comprising at least 25% of total loans.
Sources: Reports of Condition and Income and Federal Reserve Board of Governors
Strong loan growth and solid loan performance boosted earnings at agricultural banks as liquidity tightened slightly. With support from higher net interest margins, the return on average assets at agricultural banks increased notably from recent quarters and was the highest since the data was first recorded in 1984 (Chart 3, left panel). The loan-to-deposit ratio increased slightly as loan balances grew and reached the highest level for any quarter since 2019 (Chart 3, right panel).
Chart 3: Earnings and Liquidity at Agricultural Banks
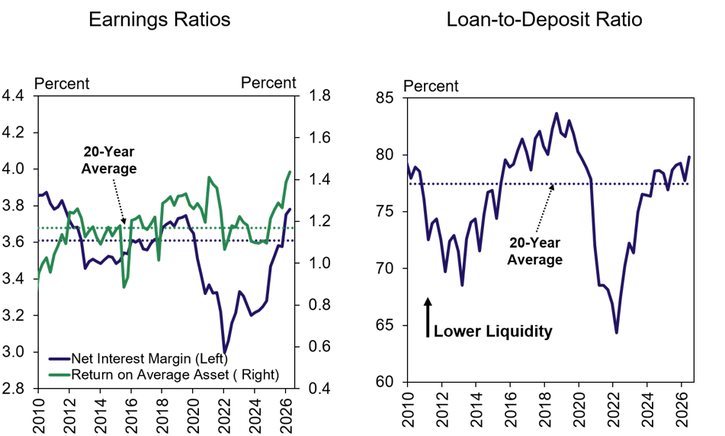
Note: Agricultural banks are defined as banks with total agricultural loans comprising at least 25% of total loans.
Sources: Reports of Condition and Income and Federal Reserve Board of Governors
Strong profitability has supported capital accumulation for many lenders. The Tier 1 Leverage Capital Ratio at agricultural banks continued to rise and reached the highest level since 2019 (Chart 4). After being pressured by unrealized losses on available for sale securities in recent years, the equity capital ratio at agricultural banks has also rebounded and ended the second quarter closer to the 20-year average.
Chart 4: Capital Ratios at Agricultural Banks
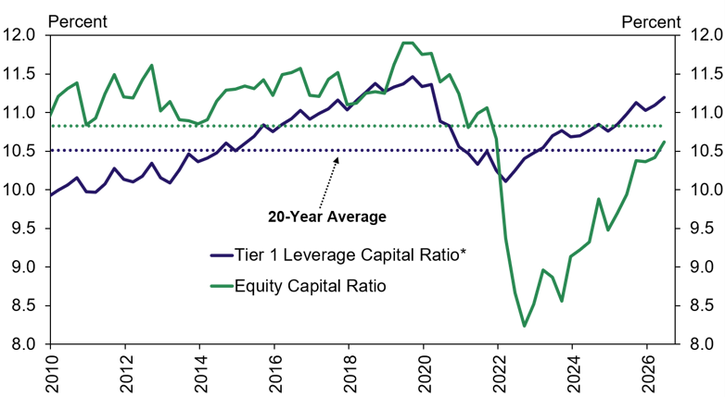
*This capital ratio excludes unrealized gains (losses) and is not reported in Ag Finance Update tables. Banks may elect to “opt-out” of including AOCI in the calculation of Tier 1 Leverage Capital utilized for regulatory purposes. However, these amounts are included in the calculation of the equity capital variable utilized in the Ag Finance Update – Commercial Bank Call Report data tables.
Note: Agricultural banks are defined as banks with total agricultural loans comprising at least 25% of total loans.
Sources: Reports of Condition and Income and Federal Reserve Board of Governors
Commercial Bank Call Report Historical Data
Commercial Bank Call Report Data Tables
About the Commercial Bank Call Report Data
The views expressed are those of the authors and do not necessarily reflect the positions of the Federal Reserve Bank of Kansas City or the Federal Reserve System.
Author