Weakness in the U.S. crop sector has continued to raise concerns about farm financial conditions. Over the past three years, profit opportunities for key U.S. crops have been narrow alongside elevated production costs and low prices, and recent volatility in energy and fertilizer markets have increased uncertainty for many producers (Cooray 2026; Scott 2026).
Nevertheless, farm-level estimates of solvency and liquidity suggest that most farms remain in a sound financial position. Panel A of Chart 1 shows that the share of farms with low, moderate, or high leverage—measured by their debt-to-asset ratios—remains similar to historical averages._ Panel B of Chart 1 shows that average liquidity for these farms has similarly remained in line with historical averages. The average current ratio—measured as current assets divided by current liabilities—remained exceptionally strong in 2025 for low-leverage farms (dark blue line). Although liquidity for moderate (light blue line) and high-leverage farms (green line) has declined in recent years, it remains above the average from 2015 to 2019, when crop profits were similarly compressed. This more modest decline in liquidity may partly reflect the strength of conditions for beef cattle producers and for crop and dairy farms diversified with beef cattle, as cattle prices during this period have been strong (USDA 2026).
Chart 1: The distribution of farm leverage is near historic norms, and liquidity is strong for many operations
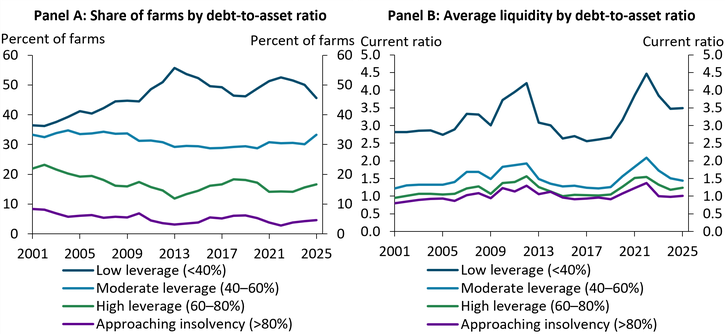
Note: Current ratio captures the extent to which current farm assets would pay off the farm’s current liabilities.
Sources: FINBIN (2026), Center for Farm Financial Management: University of Minnesota, and author’s calculations.
Although the most highly leveraged crop farms remain exposed to financial stress, their income and liquidity have been supported by government payments and steady non-farm income. Panel A of Chart 2 shows that when excluding income from non-farm sources and government payments, the average high-leverage crop farm had a loss of about $33,000 dollars in 2025 (blue bar). However, when including all income sources (purple and green bars), average net income in 2025 was more than $100,000 (black line), a considerable increase from 2024. While farms may still see differences in profit by region or commodity specialization, government assistance from various programs has provided notable support in recent years, and income from non-farm employment has remained steady for the average crop farm.
Chart 2: Government payments and non-farm income have limited stress for high-leverage crop farms and farmland is a primary asset for all types of operations
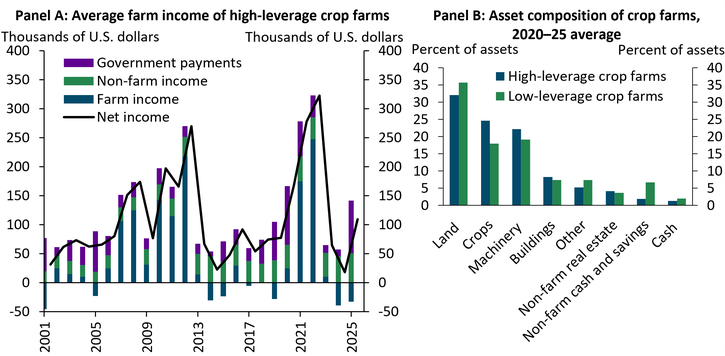
Notes: The crops category in Panel B includes the value of crops, prepaid expenses, and receivables. The other category includes miscellaneous farm and non-farm assets.
Sources: FINBIN (2026), Center for Farm Financial Management: University of Minnesota, and author’s calculations.
In addition to government payments and non-farm income, strong farm real estate values have provided support to many farms. A vast majority of operators own at least a portion of the land they farm. In the 2022 USDA Agricultural Census, about 72 percent of all U.S. farmers were full owners, 22 percent were part-owners, and 6 percent rented all operated land. Indeed, Panel B of Chart 2 shows that the asset composition of high- and low-leverage crop farms (blue and green bars) is comparable, with land comprising an average of about 30 percent of all assets and machinery valuations comprising another 20 percent. Current assets such as prepaid expenses, crops, and receivables are key determinants of liquidity, while long-term assets such as land and machinery are key determinants of solvency.
Farmland and machinery values are also particularly important in determining farms’ capacity to refinance or restructure debt during periods of negative profits. Prudent underwriting standards for agricultural lenders typically require losses or unpaid balances from preceding year operating lines to be collateralized against existing assets in a manner that allows the borrower to continue making payments over a longer period (Board of Governors of the Federal Reserve System 2021). Chart 3 shows that most farms would only become exposed to financial stress if increased collateralization of losses corresponded with rapid declines in asset values. The median farm had a debt-to-asset ratio near 45 percent in 2025 (black dot); for those farms to reach high leverage, land values and machinery would need to decline by 35 percent and intermediate and long-term debt would also need to increase by 35 percent (dotted line crossing into light green area). The average high-leverage farm had a 70 percent debt-to-asset ratio in 2025; to approach insolvency, these farms would need to see a 20 percent decline in land and machinery values combined with a 20 percent increase in intermediate and long-term debt (solid black line crossing into dark green area). Such a rapid pace of debt accumulation and asset depreciation has not been seen since the 1980s farm crisis, when prolonged and severe losses drove rapid debt accumulation and widespread asset liquidation (FDIC 2023).
Chart 3: Most farms would only be exposed to financial stress with a combination of substantial debt accumulation and rapid asset depreciation
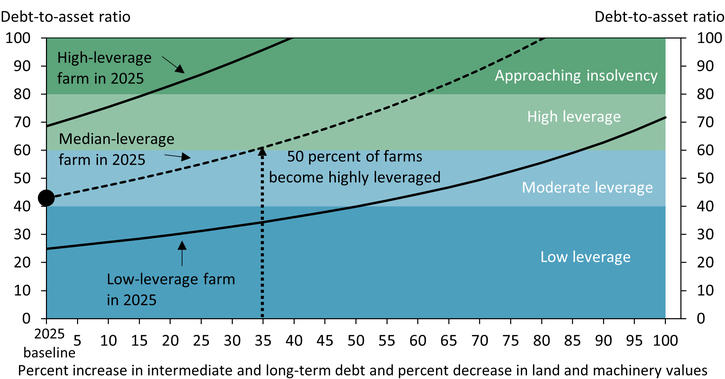
Notes: Scenarios assume an equal percent increase in intermediate and long-term debt and decrease in land and machinery values. For example, a value of 35 on the x-axis indicates a 35 percent increase in intermediate and long-term debt and a 35 percent decrease in land and machinery values. Scenarios assume no change to other balance sheet items, including current assets, current liabilities, and non-farm items. Baseline values are 2025 averages.
Sources: FINBIN (2026), Center for Farm Financial Management: University of Minnesota, and author’s calculations.
Monitoring the relationship between more timely changes in farmland values and growth in farm real estate debt can also help indicate the current degree of aggregate stress in the sector. Chart 4 shows that cropland markets softened over the past year, but valuations remained stable (purple line). At the same time, the pace of growth in farm real estate debt balances at commercial banks (dark blue line), agricultural banks (light blue line), and the Farm Credit System (green line) has been modest compared with historical averages and previous downturns in the agricultural economy. Through the end of 2025, gradual growth in farmland debt and stable land values have signaled that deterioration in financial conditions remains gradual.
Chart 4: When farm finances are weaker, the pace of debt accumulation can signal the degree of stress
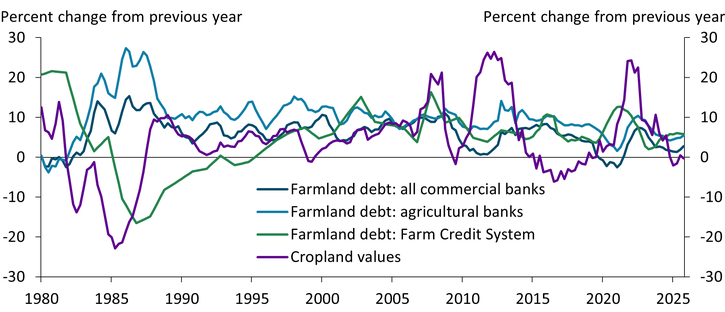
Note: Agricultural banks are commercial banks with agricultural loans totaling 25 percent or more of total loans.
Sources: Survey of Agricultural Credit Conditions, Commercial Bank Reports of Condition and Income, Farm Credit Administration, USDA, and author’s calculations.
Despite ongoing challenges for many crop producers, aggregate financial stress in the agricultural sector is limited. Government payments, non-farm income, and strong cattle revenues in many regions have supported incomes and liquidity, while farm real estate values continue to support solvency. However, prolonged weakness in crop profitability could weigh further on farm finances, making the stability of farmland values critical for the sector.
Endnotes
-
1 The External LinkFINBIN database from the University of Minnesota Center for Farm Financial Management is a collection of farm-level data from farm management education programs that use FINPACK as their farm business analysis and summary program. Contributing programs include several states and a comprehensive distribution of farm types and sizes. Results for 2025 are currently only available for Minnesota farm business management programs.
Article Citation
Kreitman, Ty. 2026. “Deterioration in Farm Financial Conditions Remains Gradual.” Federal Reserve Bank of Kansas City, Economic Bulletin, May 13.
References
Board of Governors of the Federal Reserve System. 2021. “External LinkSR 11-14: Supervisory Expectations for Risk Management of Agricultural Credit Risk.” Supervision and Regulation Letters, February 26.
Cooray, Ayesha. 2026. “Disruptions in the Strait of Hormuz Pressure Fertilizer Prices Ahead of the U.S. Growing Season.” Federal Reserve Bank of Kansas City, Center for Agriculture and the Economy, Insights on Agricultural and Rural Economies, March 26.
FDIC (Federal Deposit Insurance Corporation). 1997. “External LinkAn Examination of the Banking Crises of the 1980s and Early 1990s.” History of the Eighties – Lessons for the Future, vol. 1, chapter 8.
Scott, Francisco. 2026. “Crop Farmers Could Face Slight Profit Margin Compression After Disruptions in the Strait of Hormuz.” Federal Reserve Bank of Kansas City, Center for Agriculture and the Economy, Insights on Agricultural and Rural Economies, April 2.
USDA (U.S. Department of Agriculture). 2026. “External LinkFarm Sector Income & Finances: Farm Sector Income Forecast.” Economic Research Service, February 5.
Ty Kreitman is an associate economist at the Federal Reserve Bank of Kansas City. The views expressed are those of the author and do not necessarily reflect the positions of the Federal Reserve Bank of Kansas City or the Federal Reserve System.
Author
