Strong growth in farm real estate debt pushed agricultural loan balances higher at commercial banks in the second quarter. Outstanding farm debt increased about 5% from the previous year, the fastest pace in nearly six years. While agricultural real estate loans continued to build, production lending rose modestly following subdued demand in recent years. Loan performance also improved further. Recent loan growth supported a slight improvement in interest margins and income at agricultural banks from last quarter, but bank liquidity remained abundant.
The agricultural economy remained steady over the past quarter, providing ongoing support to farm finances. The price of most major commodities remained elevated and the outlook for profit opportunities across the sector in 2022 was positive despite heightened volatility in some markets. With substantially higher production costs and weather risks, incomes could be pressured if commodity prices drop more notably, and credit needs could also be pushed higher. Despite growing risks, farm balance sheets remained strong alongside high liquidity, and a sharp increase in farm real estate values also continued to support agricultural credit conditions.
Second Quarter Commercial Bank Call Report Data
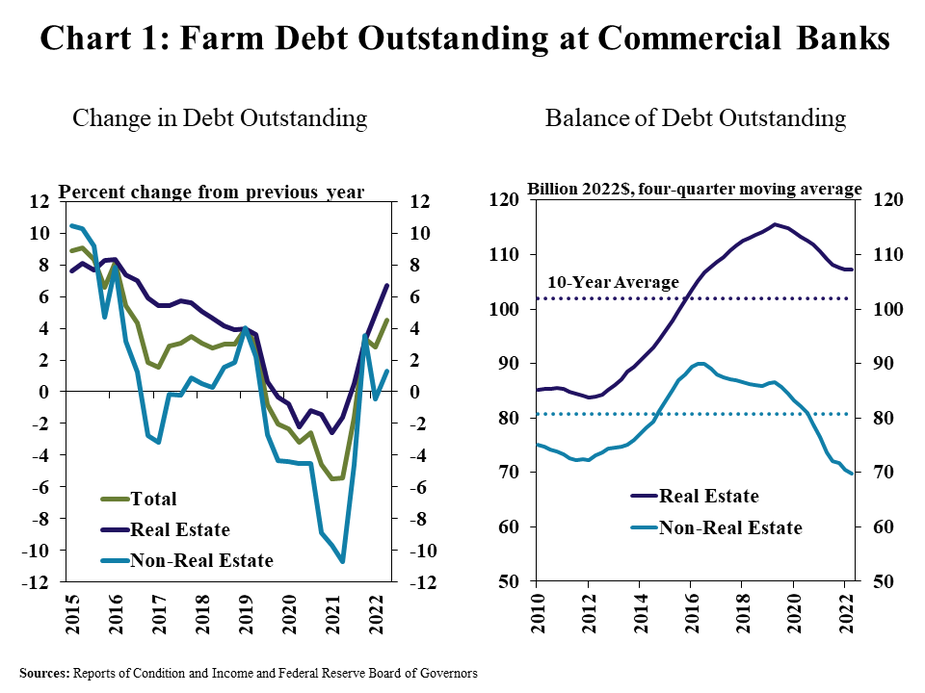
An acceleration of farm real estate debt drove further growth in agricultural loan balances. Agricultural real estate loans grew by almost 7% from a year ago and outstanding balances remained above the average of the past 10 years (Chart 1). Non-real estate farm debt showed additional signs of rebounding, increasing modestly following nearly two years of considerable retraction; but balances remained well below the recent average.
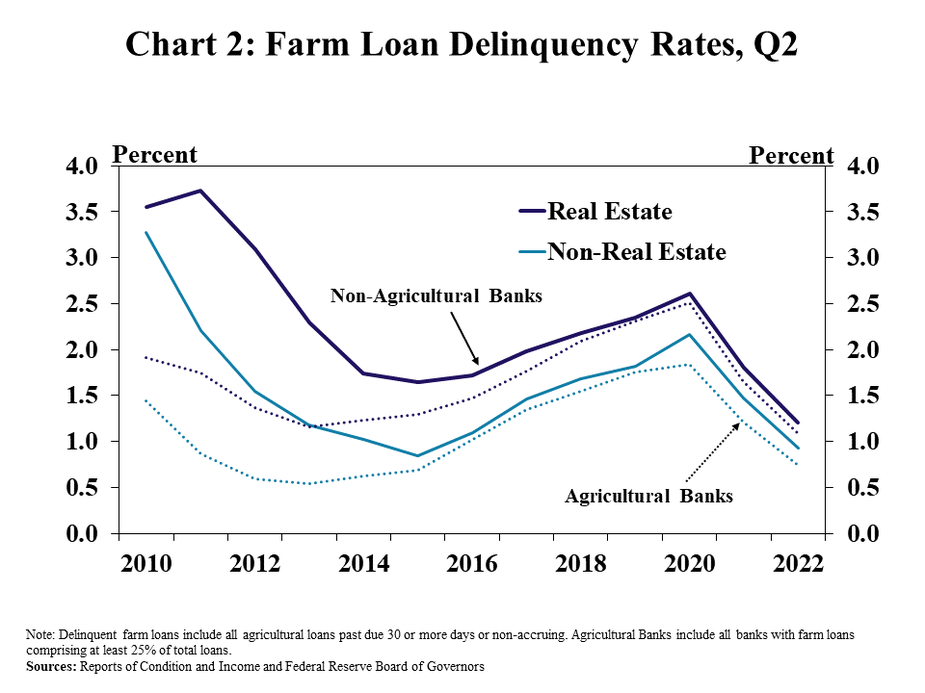
As debt balances grew, loan performance continued to improve alongside strength in farm finances. The delinquency rate on real estate and non-real estate farm loans at both agricultural and non-agricultural banks declined for the seventh consecutive quarter (Chart 2). Problem loan rates on real estate loans reached a historic low and delinquencies on production loans also edged towards all-time lows.
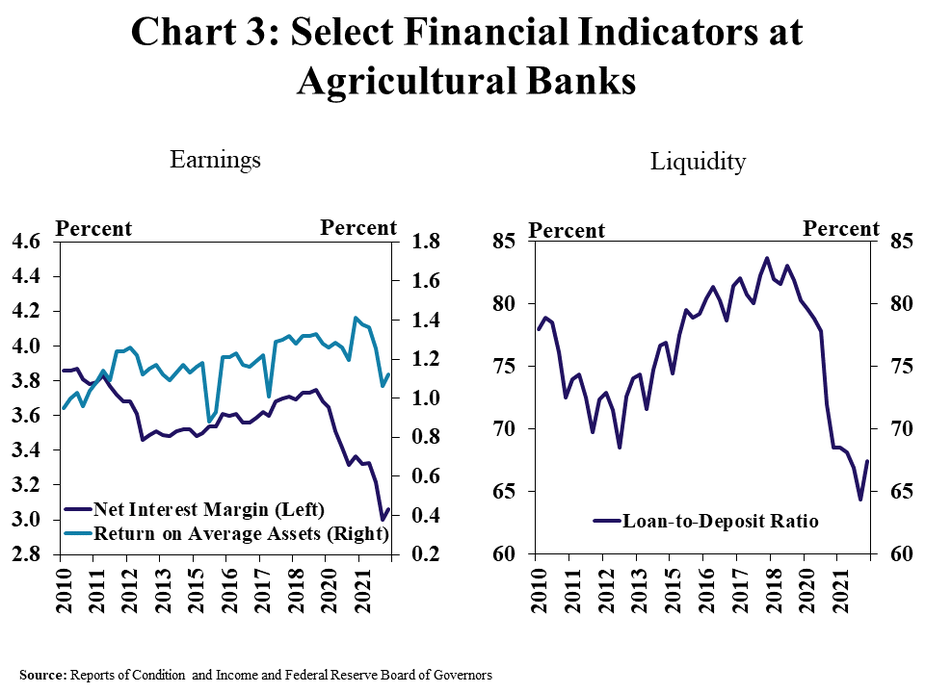
Earnings performance at agricultural banks improved slightly alongside recent growth in lending and an increase in interest rates. Following two years of steady contraction, the net interest margin increased slightly during the quarter and supported a modest improvement in bank profits (Chart 3, left panel). The uptick in interest income coincided with growth in loan balances, but liquidity among farm lenders remained ample (Chart 3, right panel).
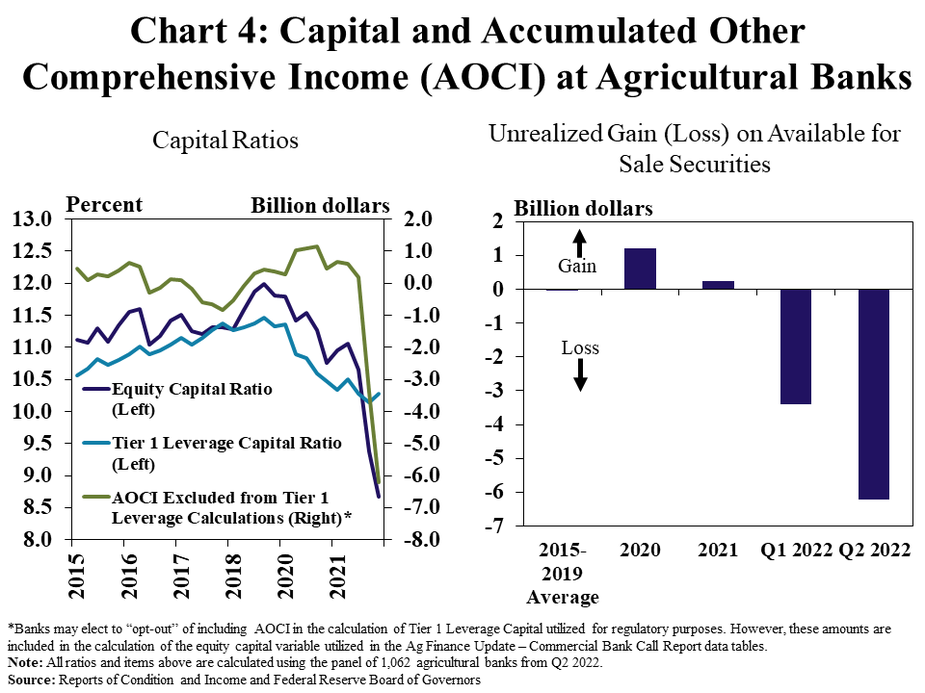
Capital ratios at agricultural banks monitored for regulatory purposes steadied, but some measures of equity dropped considerably due to recent developments in securities markets. The Tier 1 Leverage Capital ratio remained sound and increased slightly from the previous quarter, but the equity capital ratio dropped sharply (Chart 4). Substantial accumulated loss that is excluded in the measure of Tier 1 Leverage Capital accounted for the difference between the two measures. The losses were attributed to significant downward adjustments to the value of longer-term investment securities held by banks that would only affect income following a sale and are typically excluded from measures of capital used to gauge overall conditions at most banks.
Data and Information
Commercial Bank Call Report Historical Data
Commercial Bank Call Report Data Tables
About the Commercial Bank Call Report Data
The views expressed in this article are those of the authors and do not necessarily reflect the views of the Federal Reserve Bank of Kansas City or the Federal Reserve System.
Authors

Nate Kauffman
Senior Vice President, Economist, and Omaha Branch Executive; Executive Director of the Center for Agriculture and the Economy
