Agricultural real estate values continued to increase at a rapid pace across farm country through the end of 2021. The increase in the value of farmland has accelerated in recent quarters alongside elevated commodity prices that have boosted profit opportunities and supported broad strength in the U.S. farm economy. Adding support to agricultural real estate markets, farm finances and credit conditions have improved drastically from recent years and interest rates on farm loans remained near historic lows.

The outlook for agricultural credit conditions remained strong looking out to the year ahead. Elevated commodity prices and robust support from government aid programs throughout the pandemic have supported rapid improvement in farm income and credit conditions. Despite concerns about the impact of higher input costs and intensifying drought in some regions, markets for most major commodities remained strong and producers throughout the agricultural sector were poised for sound profit opportunities in 2022.

Fourth Quarter Federal Reserve District Ag Credit Surveys

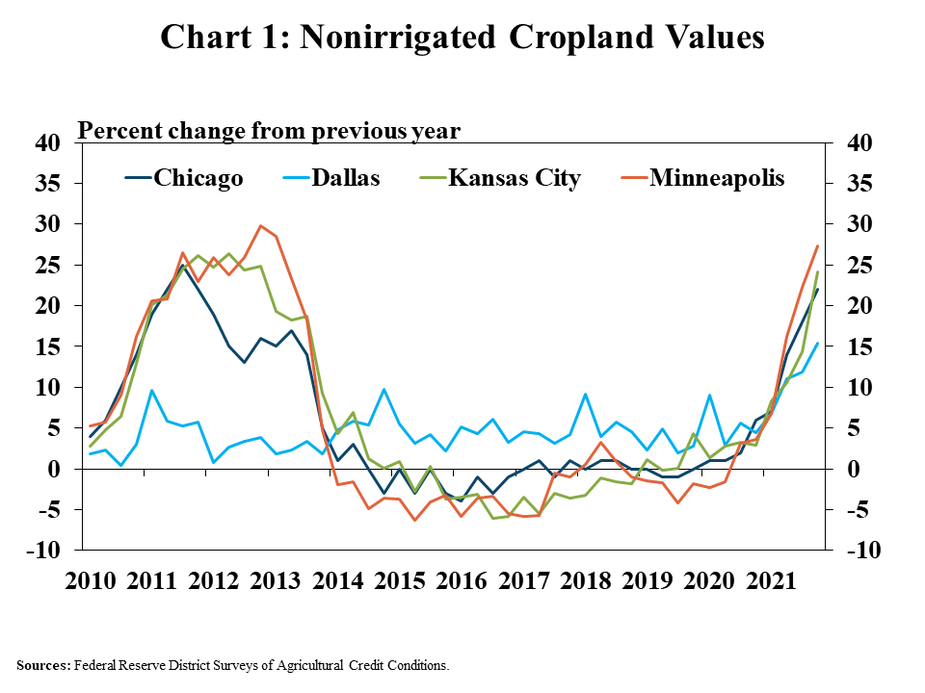
Farm real estate values continued to increase at a rapid pace. The value of nonirrigated cropland was nearly 25% higher than a year ago in all Districts except Dallas (Chart 1). The pace of growth also increased from previous quarters throughout the U.S., accelerating to the fastest rate of growth since 2012 and 2013 in all Districts.

Chart 1: Nonirrigated Cropland Values - is a line chart showing the percent change in nonirrigated cropland values from the previous year the Chicago, Dallas, Kansas City and Minneapolis Districts in every quarter from Q1 2010 to Q4 2021.  Sources: Federal Reserve District Surveys of Agricultural Credit Conditions.

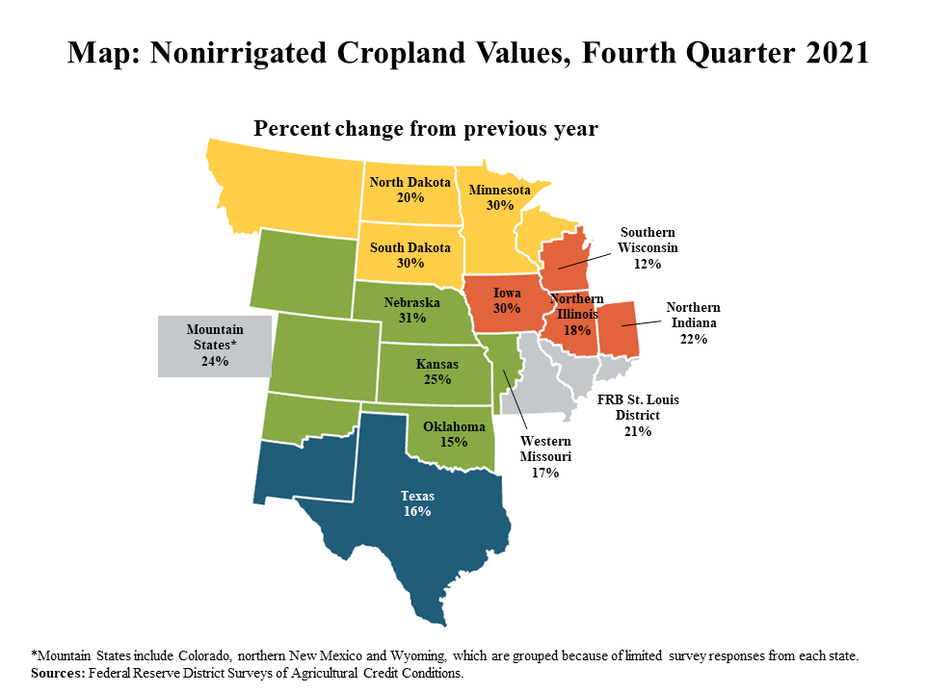
The strength in farm real estate values also remained consistent across all states. Nonirrigated cropland values increased sharply in all states within Districts participating in the survey (Map). The pace of growth was most rapid in Nebraska, Iowa, Minnesota and South Dakota.

Map: Nonirrigated Cropland Values, Fourth Quarter 2021 - is a map showing the percent change in nonirrigated cropland values from the previous in Q4 2021 for the following individual states from north to south: North Dakota, Minnesota, South Dakota, Southern Wisconsin, Nebraska, Iowa, Northern Illinois, Norther Indiana, Mountain States*, Kansas, Western Missouri, FRB St. Louis District, Oklahoma and Texas.   *Mountain States include Colorado, northern New Mexico and Wyoming, which are grouped because of limited survey responses from each state. Sources: Federal Reserve District Surveys of Agricultural Credit Conditions

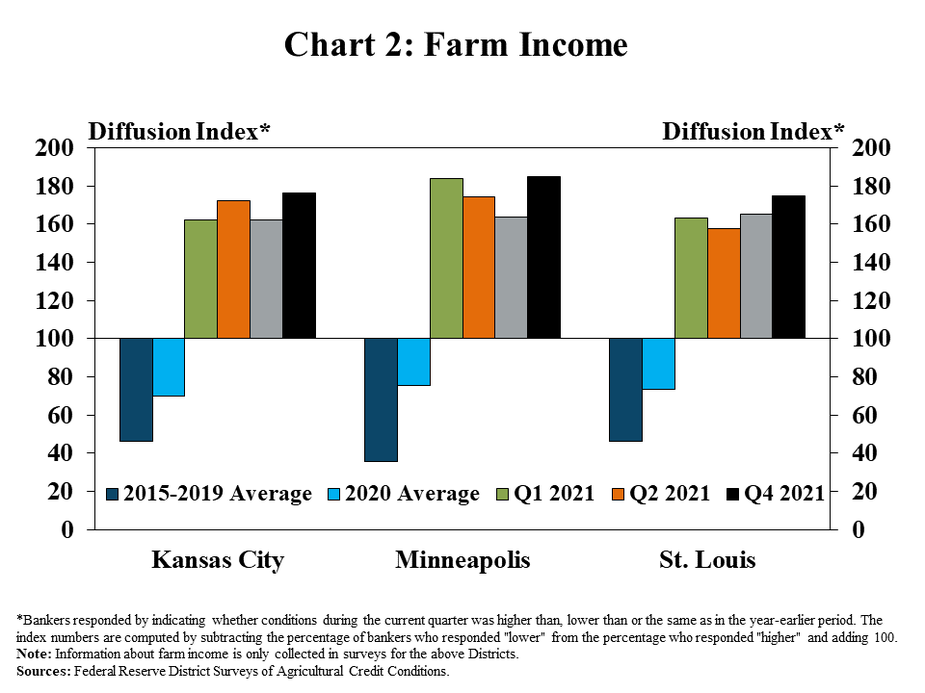
Strong agricultural real estate markets coincided with consistent improvement in farm finances. Alongside elevated commodity prices, bankers in regions participating in the survey reported that farm income was higher than a year ago for the fifth consecutive quarter (Chart 2). The pace of increase was the fastest on record for both the Kansas City and St. Louis Districts and only slightly less than the record for the Minneapolis District.

Chart 2: Farm Income - is a clustered column chart showing the diffusion index* of farm income rates for the Kansas City, Minneapolis and St. Louis Districts. Each of the Districts includes columns for 2015-2019 Average, 2020 Average, Q1 2021, Q2 2021, Q3 2021 and Q4 2021.  *Bankers responded by indicating whether conditions during the current quarter was higher than, lower than or the same as in the year-earlier period. The index numbers are computed by subtracting the percentage of bankers who responded "lower" from the percentage who responded "higher" and adding 100.’ Note: Information about farm income is only collected in surveys for the above Districts. Sources: Federal Reserve District Surveys of Agricultural Credit Conditions.

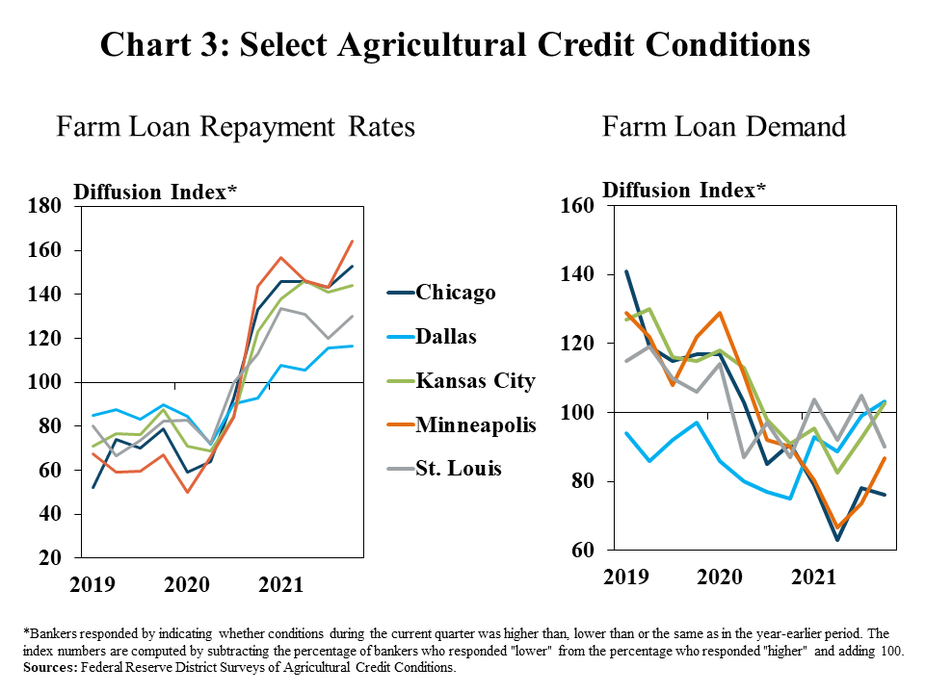
The strength in farm finances also supported further improvement in credit conditions. Farm loan repayment rates continued to increase at a steady pace in all regions (Chart 3, left panel). Higher farm incomes also continued to limit credit needs for some producers and demand for farm loans remained subdued across all areas (Chart 3, right panel).

Chart 3: Chart 3: Select Agricultural Credit Conditions- includes two individual charts. Left, Farm Loan Repayment Rates: is a line chart showing the diffusion index* of farm loan repayment rates for the Chicago, Dallas, Kansas City, Minneapolis and St. Louis Districts in every quarter from Q1 2019 to Q4 2021. Right, Farm Loan Demand: is a line chart showing the diffusion index* of farm loan demand for the Chicago, Dallas, Kansas City, Minneapolis and St. Louis Districts in every quarter from Q1 2019 to Q4 2021.  *Bankers responded by indicating whether conditions during the current quarter was higher than, lower than or the same as in the year-earlier period. The index numbers are computed by subtracting the percentage of bankers who responded "lower" from the percentage who responded "higher" and adding 100. Sources: Federal Reserve District Surveys of Agricultural Credit Conditions.

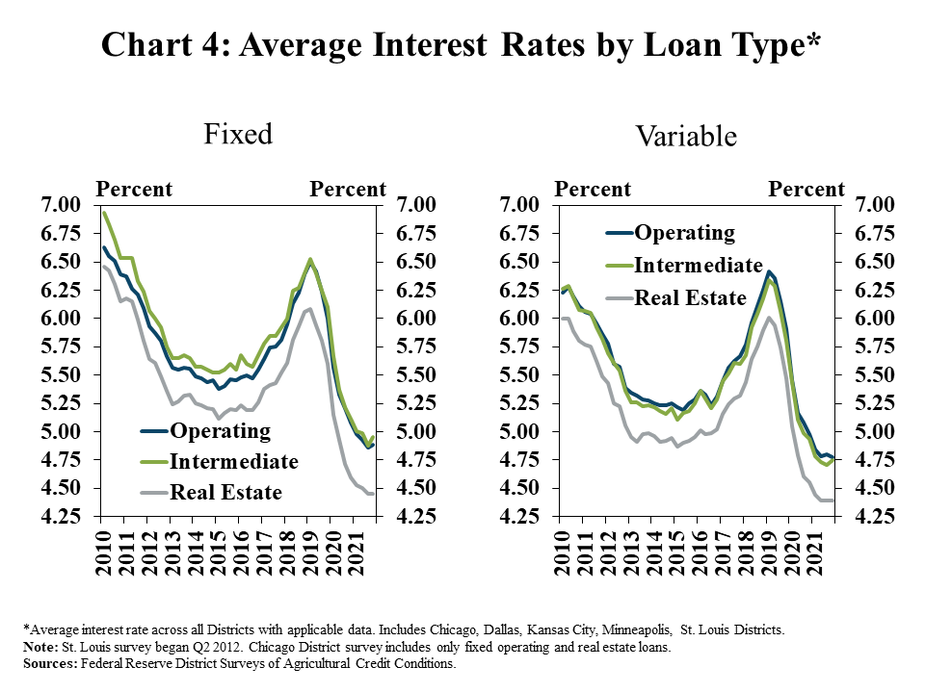
Providing additional support to farm real estate markets, interest rates remained low. Despite increasing slightly from the previous quarter, the average rate charged on all types of farm loans was well below the historical average (Chart 4). Fixed and variable rates on all loan types remained about 190 basis points and 170 basis points less than the average of the last 20 years, respectively.

Chart 4: Average Interest Rates by Loan Type*- includes two individual charts. Left, Fixed: is a line graph showing the average fixed interest rate in all applicable Districts in all quarters from 2010 to 2021, with individual lines for operating, intermediate and real estate loans. Right, Variable is a line graph showing the average variable interest rate in all applicable Districts in all quarters from 2010 to 2021, with individual lines for operating, intermediate and real estate loans.  *Average interest rate across all Districts with applicable data. Includes Chicago, Dallas, Kansas City, Minneapolis, St. Louis Districts. Note: St. Louis survey began Q2 2012. Chicago District survey includes only fixed operating and real estate loans.  Sources: Federal Reserve District Surveys of Agricultural Credit Conditions.

Data and Information

Excel SpreadsheetFederal Reserve Ag Credit Surveys Historical Data

Excel SpreadsheetFederal Reserve Ag Credit Surveys Tables

txtAbout the Federal Reserve Ag Credit Surveys

The views expressed in this article are those of the authors and do not necessarily reflect the views of the Federal Reserve Bank of Kansas City or the Federal Reserve System. 

Authors

Nate Kauffman

Senior Vice President, Economist, and Omaha Branch Executive

Nate Kauffman is Senior Vice President and Omaha Branch Executive at the Federal Reserve Bank of Kansas City. In his role as the Kansas City Fed's lead economist and represe…

Ty Kreitman

Associate Economist

Ty Kreitman is an associate economist in the Regional Affairs Department at the Omaha Branch of the Federal Reserve Bank of Kansas City. In this role, he primarily supports the F…