Larger sized loans continued to boost lending activity in the second quarter while farm loan interest rates edged higher. The volume of non-real estate agricultural loans grew at a steady pace alongside an increase in the number and average size of loans. Interest rates remained historically low but continued to increase from recent quarters on nearly all types of farm loans, as benchmark rates rose further. The average maturity of some types of loans, particularly real estate loans, also increased during the quarter and were above recent historic averages.
Farm lending activity showed signs of rebounding from the pullback in recent years and could grow further in the coming months as the higher costs of many major inputs become more fully realized. Despite recent declines, agricultural commodity prices remained elevated through the first half of 2022 and continued to support revenue and income prospects across the farm sector. However, persistent pressure from higher production expenses could squeeze profit margins going forward and drive higher demand for credit.
Second Quarter National Survey of Terms of Lending to Farmers
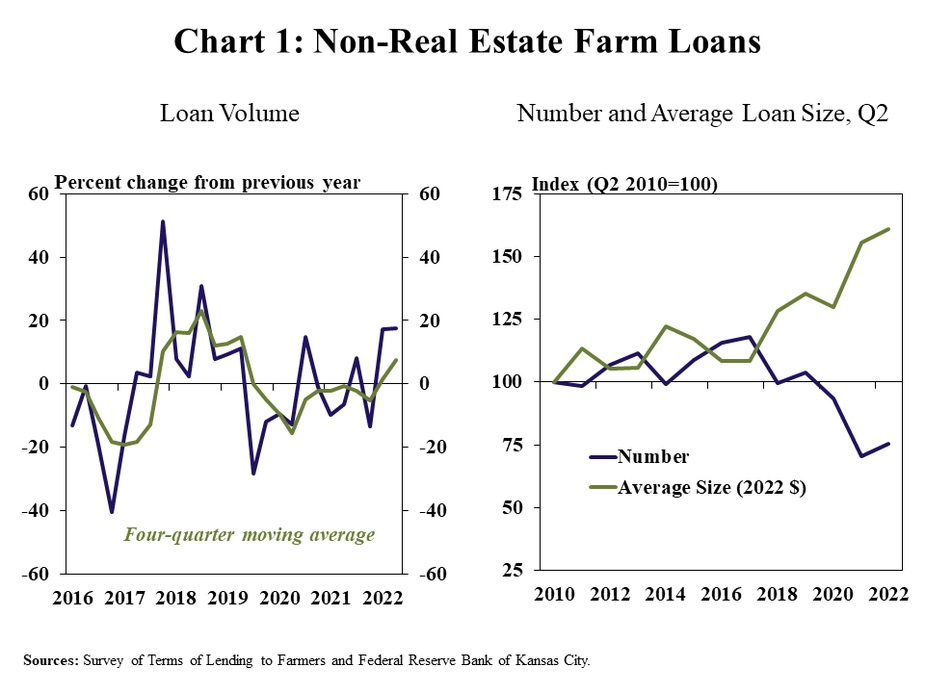
Farm lending activity at commercial banks continued to expand in the second quarter. Data from the second quarter National Survey of Terms of Lending to Farmers show that total non-real estate farm loan volumes increased by about 17% for the second consecutive quarter (Chart 1, left panel). The increase in lending was driven by growth in both average loan size and the number of new loans (Chart 1, right panel). According to the survey, the average size of non-real estate farm loans at commercial banks has increased nearly 50% over the past 10 years alongside significant increases in costs and, in some cases, an increase in the size and scale of farm operations.
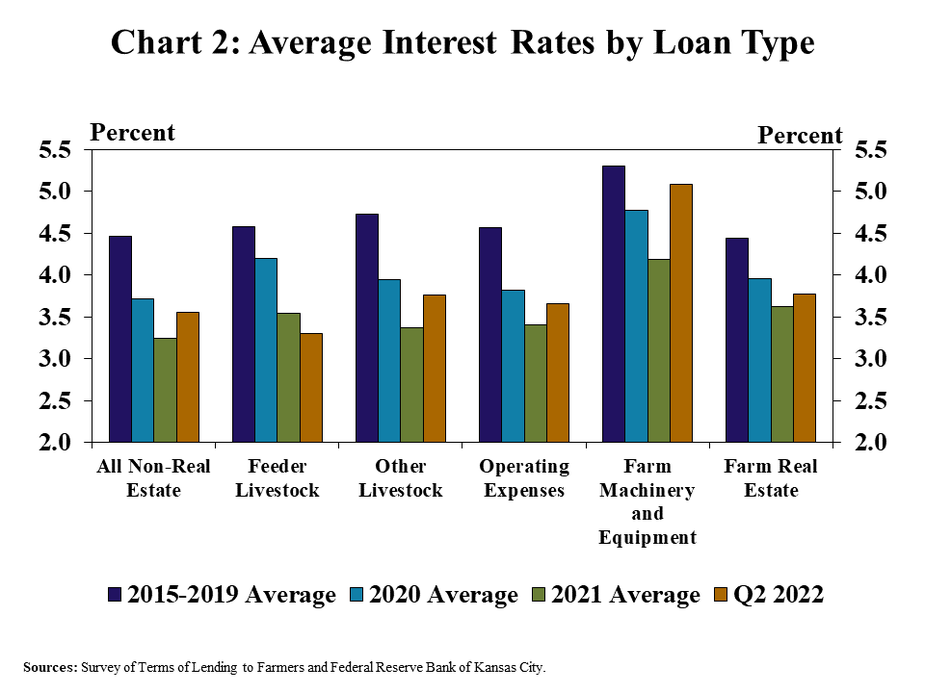
Lending activity rose despite modest increases in interest rates on farm loans. The average rate on nearly all types of loans grew during the survey period in early May, prior to an increase in benchmark rates in June 2022 (Chart 2). Despite the recent increase, interest rates on farm loans remained historically low and were still, on average, about 75 basis points less than the 5 years preceding the pandemic.
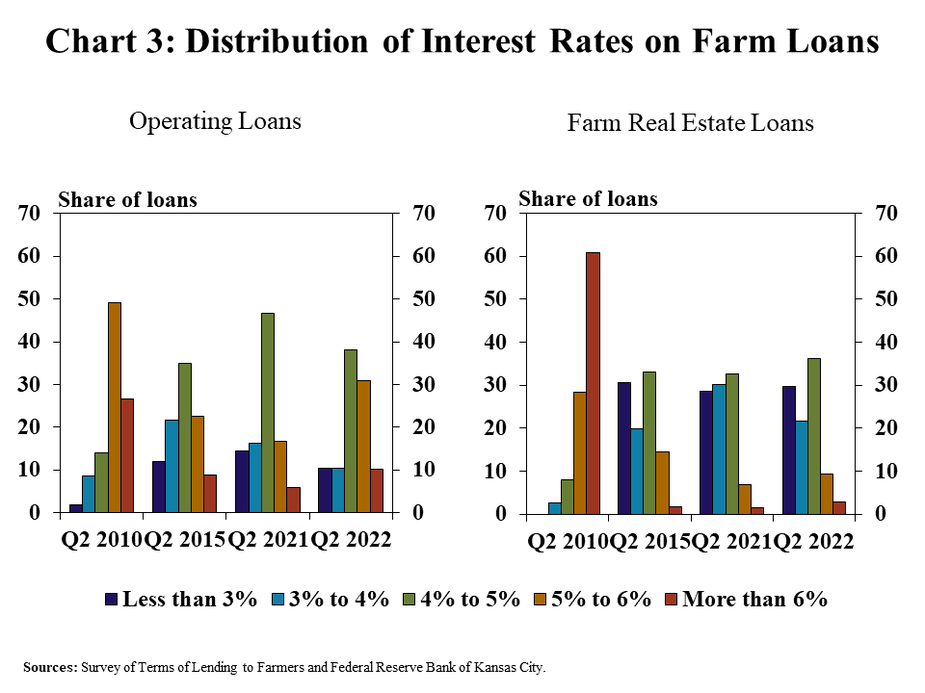
The range of rates charged to borrowers also shifted upward as benchmark rates increased. The share of operating loans with a rate above 5% nearly doubled from the same time a year ago and was higher than the same time in 2015 (Chart 3, left panel). Similarly, only 20% of new operating loans were originated with an interest rate of less than 4%, in contrast to about 30% a year ago. The share of farm real estate loans carrying a higher interest rate also grew considerably from a year ago, but remained less than 2015 (Chart 3, right panel).
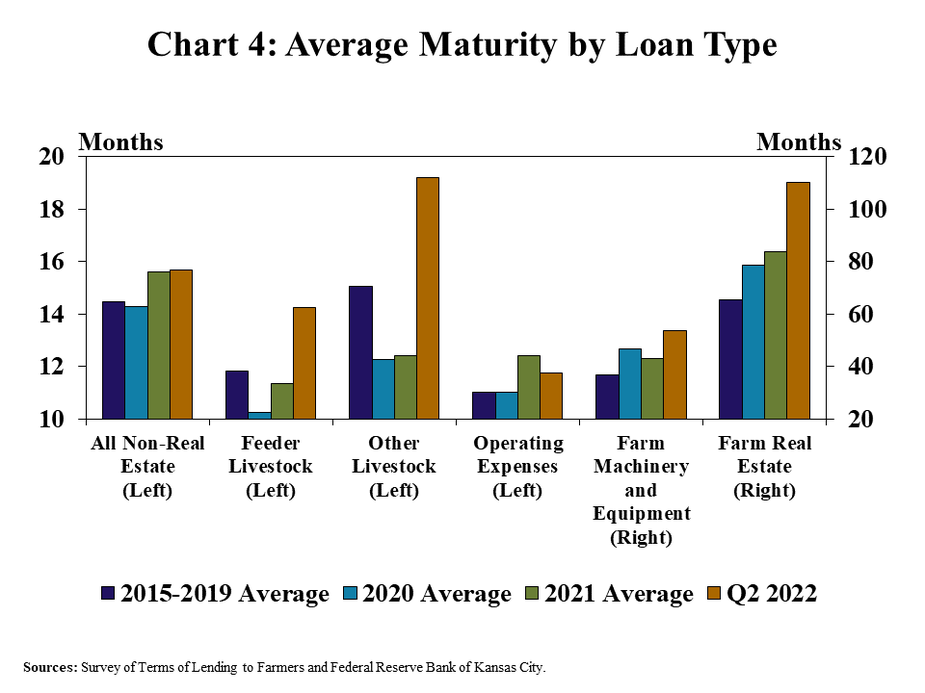
The maturity of most types of loans, particularly those for farm real estate, increased alongside higher interest rates and larger-sized loans. The average duration of farm real estate loans was nearly two years longer than in 2021 and was well above the average from 2015-2019 (Chart 4). Average maturities on livestock and farm equipment loans also increased notably from last year and were above the recent historical average, while maturities on operating loans remained steady.
Data and Information
National Survey of Terms of Lending to Farmers Historical Data
National Survey of Terms of Lending to Farmers Tables
About the National Survey of Terms of Lending to Farmers
The views expressed are those of the authors and do not necessarily reflect the positions of the Federal Reserve Bank of Kansas City or the Federal Reserve System.
Authors

Ty Kreitman
Associate Economist
