
Agricultural credit conditions continued to deteriorate gradually in the second quarter of 2026, but the level of financial stress was modest, and farmland values remained strong. According to survey respondents in the Tenth Federal Reserve District, farm incomes remained subdued, but the pace of decline slowed slightly from previous months. Credit conditions continued to tighten steadily, and lenders reported that financial conditions were relatively weaker on average for smaller farms and farms that are majority renters, but most loan repayment issues remained minor. Despite ongoing challenges in the crop sector and softer farm finances, cropland values remained strong and ranchland values grew to new record highs.
Strength in the cattle sector has boosted incomes in many areas but ongoing challenges in the crop sector continued to weigh on the outlook for the farm economy. Profit opportunities for crop producers remained narrow despite slightly higher prices during the second quarter. Persistent challenges in the crop sector could continue weighing on credit conditions in the coming months but government payments and strong land valuations have supported farm balance sheets and have helped keep aggregate financial conditions resilient.
Section 1: Farm Income and Credit Conditions
Deterioration in farm incomes eased alongside an increase in crop prices during recent months. Profit opportunities for crop producers remained narrow, but the pace of decline in farm borrower income slowed in the second quarter as corn, soybean, and wheat prices rose slightly. Cattle prices reached new record highs and also continued to boost incomes across many portions of the District.
Chart 1: Tenth District Farm Income and U.S. Agricultural Commodity Prices
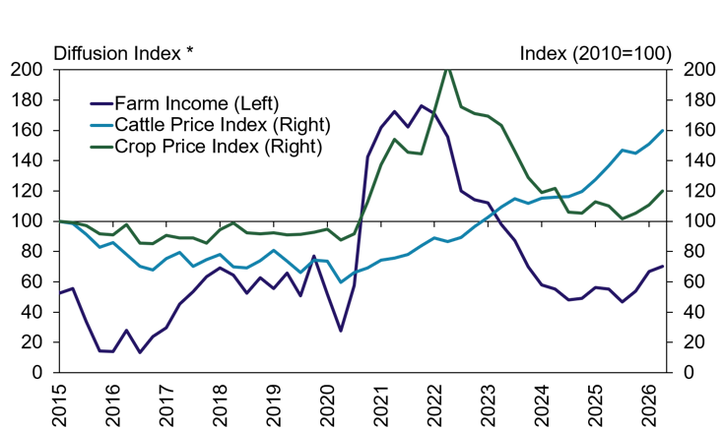
Note: The crop price index is the average index of prices for corn, soybeans and wheat.
*The index numbers are computed by subtracting the percentage of respondents who responded "lower" from the percentage who responded "higher" and adding 100.
Sources: Wall Street Journal, CME Group, Haver Analytics and Federal Reserve Bank of Kansas City staff calculations
Deterioration in farm finances continued to be less pronounced in areas most concentrated in cattle production. The pace of decline in farm income remained notably slower in the Mountain States and incomes increased gradually in Oklahoma according to lenders (Chart 2, left panel). The share of lenders reporting that farm income was lower than the same time a year ago declined in recent months across all states except the Mountain States where drought has been particularly severe (Chart 2, right panel).
Chart 2: Farm Borrower Income by State
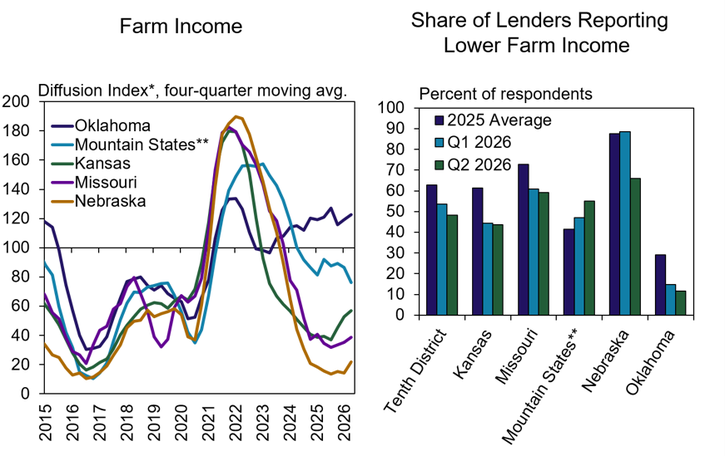
*The index numbers are computed by subtracting the percentage of respondents who responded "lower" from the percentage who responded "higher" and adding 100.
** Mountain States include Colorado, northern New Mexico and Wyoming, which are grouped because of limited survey responses from each state.
Financial conditions also remained weaker for farms operating primarily on rented land. Half of lenders reported that financial conditions for majority renter-operators were modestly weaker than conditions for majority owner-operators. A smaller portion of about 10% observed significantly weaker conditions for renters and a third indicated that finances for those groups were about the same.
Chart 3: Financial Conditions of Majority Renter-Operators vs. Majority Owner-Operators
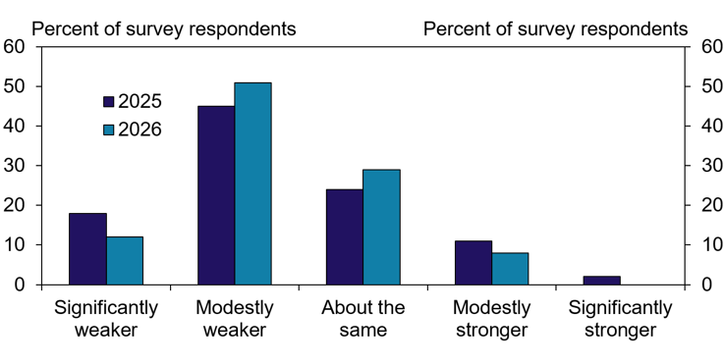
Note: Respondents answered the following question: How do overall financial conditions for majority owner-operators compare with overall financial conditions for majority renter-operators in your lending area?
Finances were comparatively weaker for smaller farms as well. About 35% of lenders reported that financial conditions for farms operating less than 1,000 acres were modestly weaker than larger farms (Chart 4). About 10% thought conditions were significantly weaker while a third observed similar finances and around 15% reported modestly stronger performance for smaller farms.
Chart 4: Financial Conditions of Small vs. Large Farms
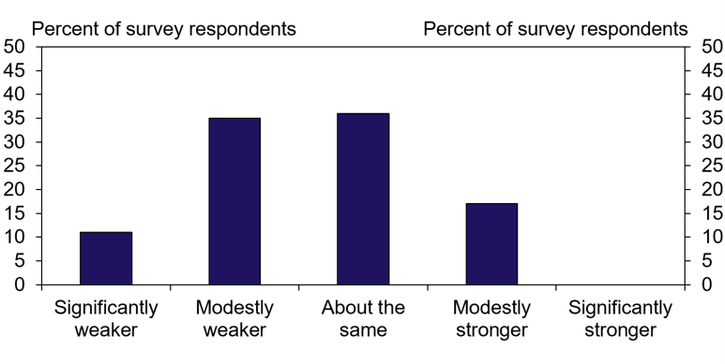
Note: Respondents answered the following question: How do overall financial conditions for smaller farms (less than 1,000 acres) compare with overall financial conditions for larger farms (more than 1,000 acres) in your lending area?
With ongoing softening in farm finances, credit conditions also continued to deteriorate gradually. The pace of decline in farm loan repayment rates was similar to recent quarters but less rapid than a year ago (Chart 5, left panel). The share of lenders reporting that farm loan repayment rates were lower than the same time a year ago declined from last year and last quarter across all states except Missouri (Chart 2, right panel).
Chart 5: Tenth District Farm Loan Repayment Rates
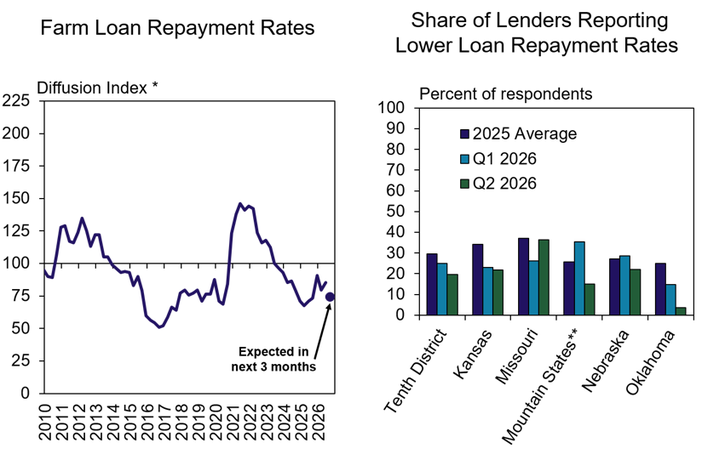
*The index numbers are computed by subtracting the percentage of respondents who responded "lower" from the percentage who responded "higher" and adding 100.
**Mountain States include Colorado, northern New Mexico and Wyoming, which are grouped because of limited survey responses from each state.
Credit conditions have tightened alongside softer financial conditions, but most repayment issues remained relatively minor. On average across the region, less than 10% of farm loan balances had major or severe repayment problems while about 15% had minor troubles (Chart 6, left panel). Repayment issues were similar to a year ago and were slightly more pronounced in Kansas and Nebraska (Chart 6, right panel).
Chart 6: Degree of Farm Loan Repayment Problems, Q2
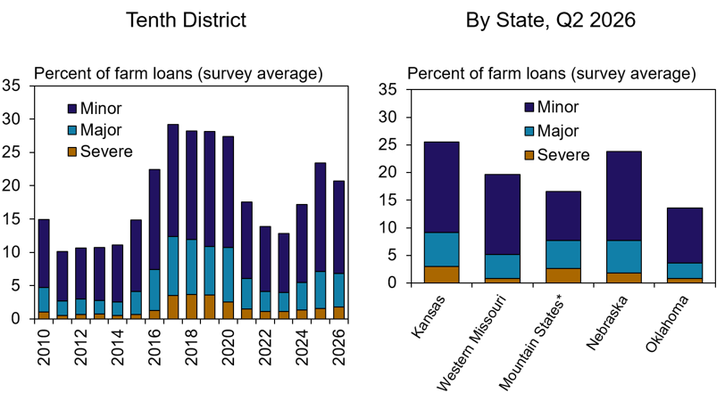
Note: Respondents answered the following question: Please indicate the percentage of the dollar amount of your bank's farm loan portfolio that currently falls within each of the following repayment classifications (None, minor, major or severe).
*Mountain States include Colorado, northern New Mexico and Wyoming, which are grouped because of limited survey responses from each state.
Section 2: Farmland Values and Interest Rates
Despite steady deterioration in farm income and credit conditions, farm real estate values remained strong. The average value of nonirrigated and irrigated cropland in the District increased about 1% and 4% from a year ago, respectively, during the second quarter while ranchland values grew more than 7% (Chart 7, left panel). Looking ahead to the next three months, lenders expected steady cropland values and additional growth in ranchland valuations (Chart 7, right panel).
Chart 7: Tenth District Farmland Values
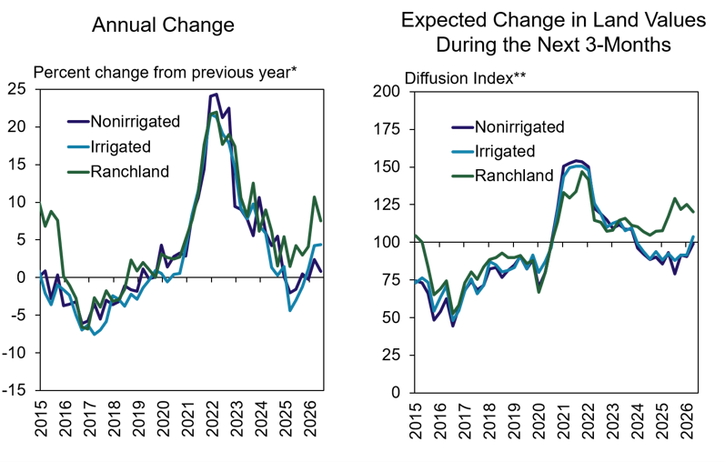
*Percent changes are calculated using responses only from those banks reporting in both the past and the current quarters.
**The index numbers are computed by subtracting the percentage of lenders who responded "lower" from the percentage who responded "higher" and adding 100.
Cash rents declined slightly for cropland and increased for ranchland. Average rents dropped by about 2% from a year ago for irrigated and nonirrigated cropland but increased about 6% for ranchland (Chart 8, left panel). Similar to the outlook for land values, lenders expected steady rents for cropland over the next three months and some upward pressure for ranchland (Chart 8, right panel).
Chart 8: Tenth District Farmland Cash Rents
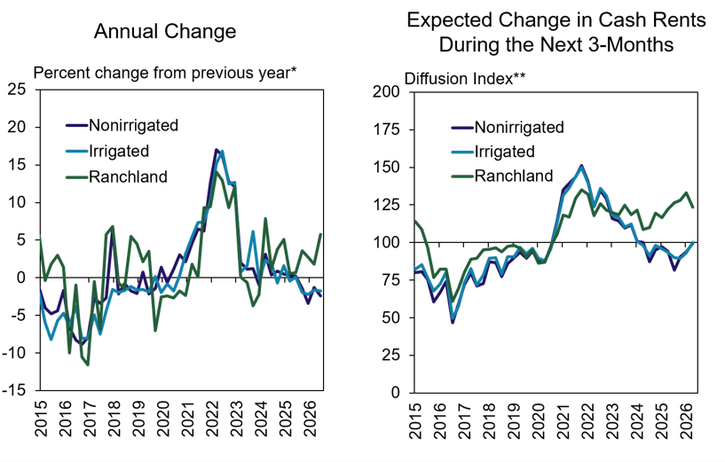
*Percent changes are calculated using responses only from those banks reporting in both the past and the current quarters.
**The index numbers are computed by subtracting the percentage of lenders who responded "lower" from the percentage who responded "higher" and adding 100.
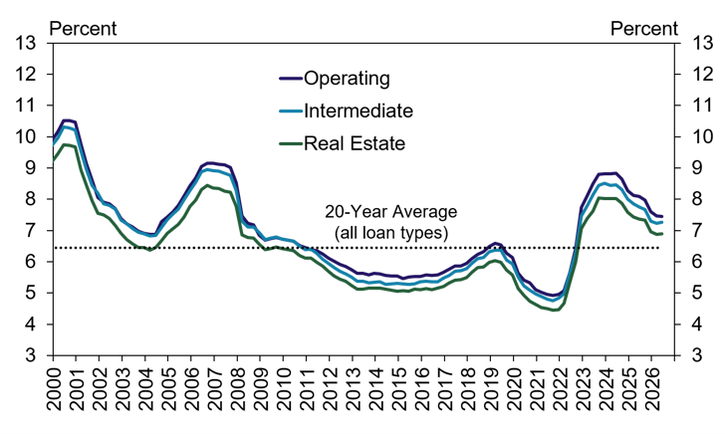
Farm loan interest rates were flat over the past quarter but declines over the past year may have provided some support to land markets. The average rate on all major types of farm loans was nearly unchanged from the previous quarter (Chart 9). Interest rates remained slightly above the average of the past two decades but were 50 basis points lower than the same time a year ago and 120 basis points lower than the same time in 2024.
Chart 9: Tenth District Average Interest Rates
Note: Average rates are calculated as the average of fixed and variable rates for each loan category
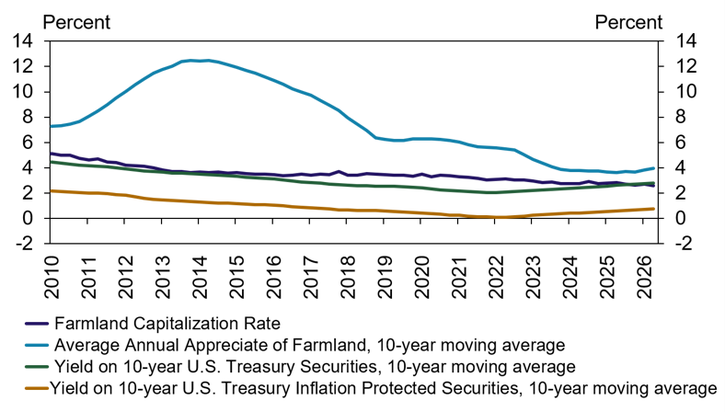
The expected rate of return on farmland dropped further alongside lower cash rents, but long-term trends suggest that land has remained desirable relative to alternative investment options. The capitalization rate on nonirrigated cropland (cash rents divided by land values) dropped slightly below the 10-year moving average yield on long-term U.S. bonds. However, the 10-year moving average of annual appreciation in land values remained more than 100 basis points higher (Chart 10). Farmers have remained the primary buyers of land and the long-term prospects have likely remained attractive, particularly when compared with bond yields adjusted for inflation.
Chart 10: Average Long-Term Farmland Appreciation and Yields on U.S. Government Securities
Note: Farmland values are based on annual changes in the value of nonirrigated cropland. The capitalization rate is calculated as cash rent on nonirrigated cropland divided by the value of nonirrigated cropland.
Banker Comments Q2 2026
“Government ad hoc disaster payments are keeping conditions manageable for most producers. Without these funds, there would be a larger number of producers with significant financial challenges.”– Kansas
“Margins for all crops except soybeans are a concern. Operations diversified with cattle are doing well.”– Kansas
“While high cattle prices have certainly helped operations, crop farmers are very squeezed right now.”– Kansas
“Everything is expensive, farm product prices are volatile, margins remain tight, and weather continues to weigh on planting and crop prospects”– Missouri
“This survey is hard to answer as there is a significant difference between the farmers and ranchers. Farmers are struggling significantly while ranchers are doing well this year.”– Nebraska
“….Many of our row crop heavy producers have shown significant losses recently with very strained cash flows for 2026.”– Nebraska
“Extremely dry conditions as growing season progresses could dramatically change financial performance of operations.”– Nebraska
“Farming and ranching is profitable in 2026 but then add on government payments and the farm economy for most producers is very robust.” – Nebraska
“Our area is basically cow/calf based and as long as the consumer will continue to eat beef, we will be okay.”– Oklahoma
“Our biggest issue is the drought. Hay is very expensive if you can find it. Livestock prices are historically high which is helping producers weather this storm.”– Wyoming
“Drought conditions continue to worsen however most producers should be able to get through the summer.”– Wyoming
A total of 142 lenders responded to the Second Quarter Survey of Agricultural Credit Conditions in the Tenth Federal Reserve District—an area that includes Colorado, Kansas, Nebraska, Oklahoma, Wyoming, the northern half of New Mexico and the western third of Missouri. Please refer questions to Ty Kreitman at 1-800-333-1040.
The views expressed are those of the authors and do not necessarily reflect the positions of the Federal Reserve Bank of Kansas City or the Federal Reserve System.
Author