
Second quarter results from the energy survey showed that Tenth District energy activity increased moderately, while expectations cooled from last quarter but remained expansionary. Firms reported that oil prices needed to be on average $66 per barrel for drilling to be profitable, and $83 per barrel for a substantial increase in drilling to occur. Natural gas prices needed to be $3.61 per million Btu for drilling to be profitable on average, and $4.53 per million Btu for drilling to increase substantially.
Summary of Quarterly Indicators
Tenth District energy activity increased moderately in the second quarter of 2026, as indicated by firms contacted between June 15, 2026, and June 30, 2026 (Tables 1 & 2). The quarter-over-quarter drilling and business activity index was 18 in Q2, up from 0 in Q1 and from -39 in Q4 (Chart 1). All quarter-over-quarter indexes posted positive readings, with the revenues and profits indexes increasing further to multi-year highs. Employment and access to credit increased as well, to 13 and 15 respectively.
Drilling activity grew somewhat from this time last year, with the year-over-year drilling/business activity index rising from 0 to 9 in Q2, its first positive reading since Q1 2023. All year-over-year indexes increased and posted positive readings. Capital expenditures increased from -9 to 15 amid higher oil prices.
Six-month expectations cooled from last quarter but remained expansionary. The drilling activity, revenues, profits, and capital expenditures indexes all eased from elevated readings as 73% of firms expected oil prices to decline in the next six months. The drilling activity index cooled from 25 to 12; however expected employment growth accelerated from a reading of 6 to 15. The average firm expects WTI oil to be $75/barrel in the next six months, below the $83/barrel price the average firm reports needing to support a substantial increase in drilling.
Chart 1. Drilling/Business Activity Indexes
Skip to data visualization table| Quarter | Vs. a Quarter Ago | Vs. a Year Ago |
|---|---|---|
| Q2 22 | 57 | 77 |
| Q3 22 | 44 | 78 |
| Q4 22 | 6 | 56 |
| Q1 23 | -13 | 17 |
| Q2 23 | -19 | -16 |
| Q3 23 | -13 | -23 |
| Q4 23 | -33 | -33 |
| Q1 24 | -13 | -26 |
| Q2 24 | -14 | -25 |
| Q3 24 | -13 | -29 |
| Q4 24 | -13 | -16 |
| Q1 25 | 6 | -18 |
| Q2 25 | -17 | -17 |
| Q3 25 | -16 | -24 |
| Q4 25 | -39 | -50 |
| Q1 26 | 0 | 0 |
| Q2 26 | 18 | 9 |
Summary of Special Questions
Firms were asked what oil and natural gas prices were needed on average for drilling to be profitable across the fields in which they are active. The average oil price needed was $66 per barrel (Chart 2), while the average natural gas price needed was $3.61 per million Btu (Chart 3). Firms were also asked what prices were needed for a substantial increase in drilling to occur across the fields in which they are active. The average oil price needed was $83 per barrel (Chart 2), and the average natural gas price needed was $4.53 per million Btu (Chart 3).
Firms reported what they expected oil and natural gas prices to be in six months, one year, two years, and five years. The average expected WTI prices were $75, $72, $73, and $80 per barrel, respectively. The average expected Henry Hub natural gas prices were $3.38, $3.53, $3.90, and $4.47 per million Btu, respectively. Firms were asked how certain constraints might hinder business activity in the next 12 months. Just over half of firms reported that labor and/or supply chain issues might constrain activity slightly, while another 15% (6%) reported the supply chain (labor) could constrain activity significantly. Nearly half of firms reported financing conditions would have no impact on activity, while 36% expect them to slightly constrain activity and another 15% expect them to significantly constrain activity. Additionally, a quarter of firms expected regulatory policy to have no impact, while 31% expected a slight constraint and 44% expected a significant constraint.
Contacts were also asked how capital expenditures plans changed from the beginning of the year. Over half of firms (53%) reported no change in their planned capital expenditures, while 32% increased their plans for the remainder of the year and another 6% increased them significantly. Only 9% of contacts reported lowering planned capital expenditures.
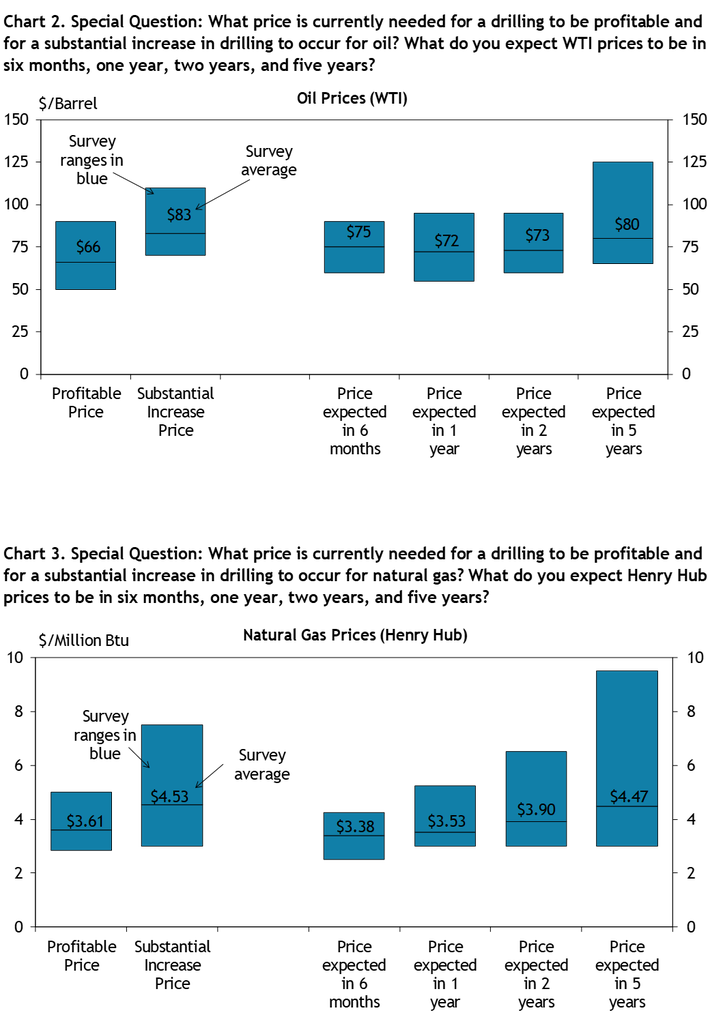
Chart 4. Special Question: To what extent might the following constraints hinder your firm's business activity in the next 12 months?
Skip to data visualization table| Category | Significant Constraint | Slight Constraint | No Impact |
|---|---|---|---|
| Labor | 6 | 55 | 39 |
| Equipment, Supply Chain, or Physical Capital Availability | 15 | 52 | 33 |
| Financing Conditions or Financial Capital Availability | 15 | 36 | 49 |
| Policy/Regulatory | 44 | 31 | 25 |
Chart 5. Special Question: Compared to the beginning of the year, how have your planned capital expenditures changed for the remainder of 2026?
Skip to data visualization table| Category | Percent |
|---|---|
| Significantly Lower | 3 |
| Lower | 6 |
| No Change | 53 |
| Higher | 32 |
| Significantly Higher | 6 |
Selected Energy Comments
“Spending will continue to be conservative due to commodity price volatility that is expected due to geopolitical conflict, especially in the Mideast.”
“Uncertain price environment is causing our drilling customers to take a ‘wait and see’ approach.”
“Crude oil price reaction has not been anticipated. There is still a possibility of higher crude oil prices once SPR release has ceased.”
“Current futures environment shows that the market expects a quick recovery. Futures prices less than 2 years forward are not significantly changed in spite of shortages in parts of the world.”
“We expect a balanced market over the next several years.”
“Current efforts to open the Strait of Hormuz and releasing sanctions on Iran oil sales will place downward pressure on oil prices.”
“Stabilizing oil prices post Iran War.”
“US storage levels are very low. Higher prices aren't causing demand destruction but rather demand curtailment.”
“Demand increasing moderately and smooth post war recovery.”
“There is a disconnect between the tight physical market and the perceived looseness of the Strait of Hormuz opening. We believe it will be hard to replace the 1.5 billion barrel loss of crude without some higher pricing to displace demand.”
“Once the oil market rebalances there appears there will be a modest over supply of crude oil. Longer term $75 is an amount that works for the full cycle return of the oil business but not too high for consumers.”
“High domestic production will continue to place downward pressure on gas prices.”
“Ultimately, the US has substantial gas reserves that are stuck in the US. Without additional LNG permitting and exporting, the Henry Hub price will remain dislocated from TTF and JKM.”
Additional Resources
Current Release
Download Historical Data
About the Energy Survey
The views expressed are those of the authors and do not necessarily reflect the positions of the Federal Reserve Bank of Kansas City or the Federal Reserve System.
Authors

Cortney Cowley
Assistant Vice President and Oklahoma City Branch Executive