
Center for Agriculture and the Economy
Leveraging expertise from the Kansas City Fed, the Center provides timely analysis of industry developments and conducts ongoing research on the agricultural economy.
Fuel Costs Pressure Margins, but Mitigated by Higher Crop Prices
By Ty Kreitman
September 29, 2026
The recent surge in diesel prices has increased fuel costs for all types of farming operations, but the rise in expenses has also coincided with higher crop prices. Diesel accounts for most overall fuel costs for crop producers and prices in late September were over 75% higher than last year, representing a notable increase in costs alongside fall harvest. However, this amounts to only about $0.11 more per bushel in fuel costs for corn at national average yields, compared to a more than $0.80 increase in corn prices over the same period. Fuel costs for rice are notably higher and that same rise in diesel prices would increase per hundredweight cost by over $1.00, but rice prices have increased by nearly $4.00.
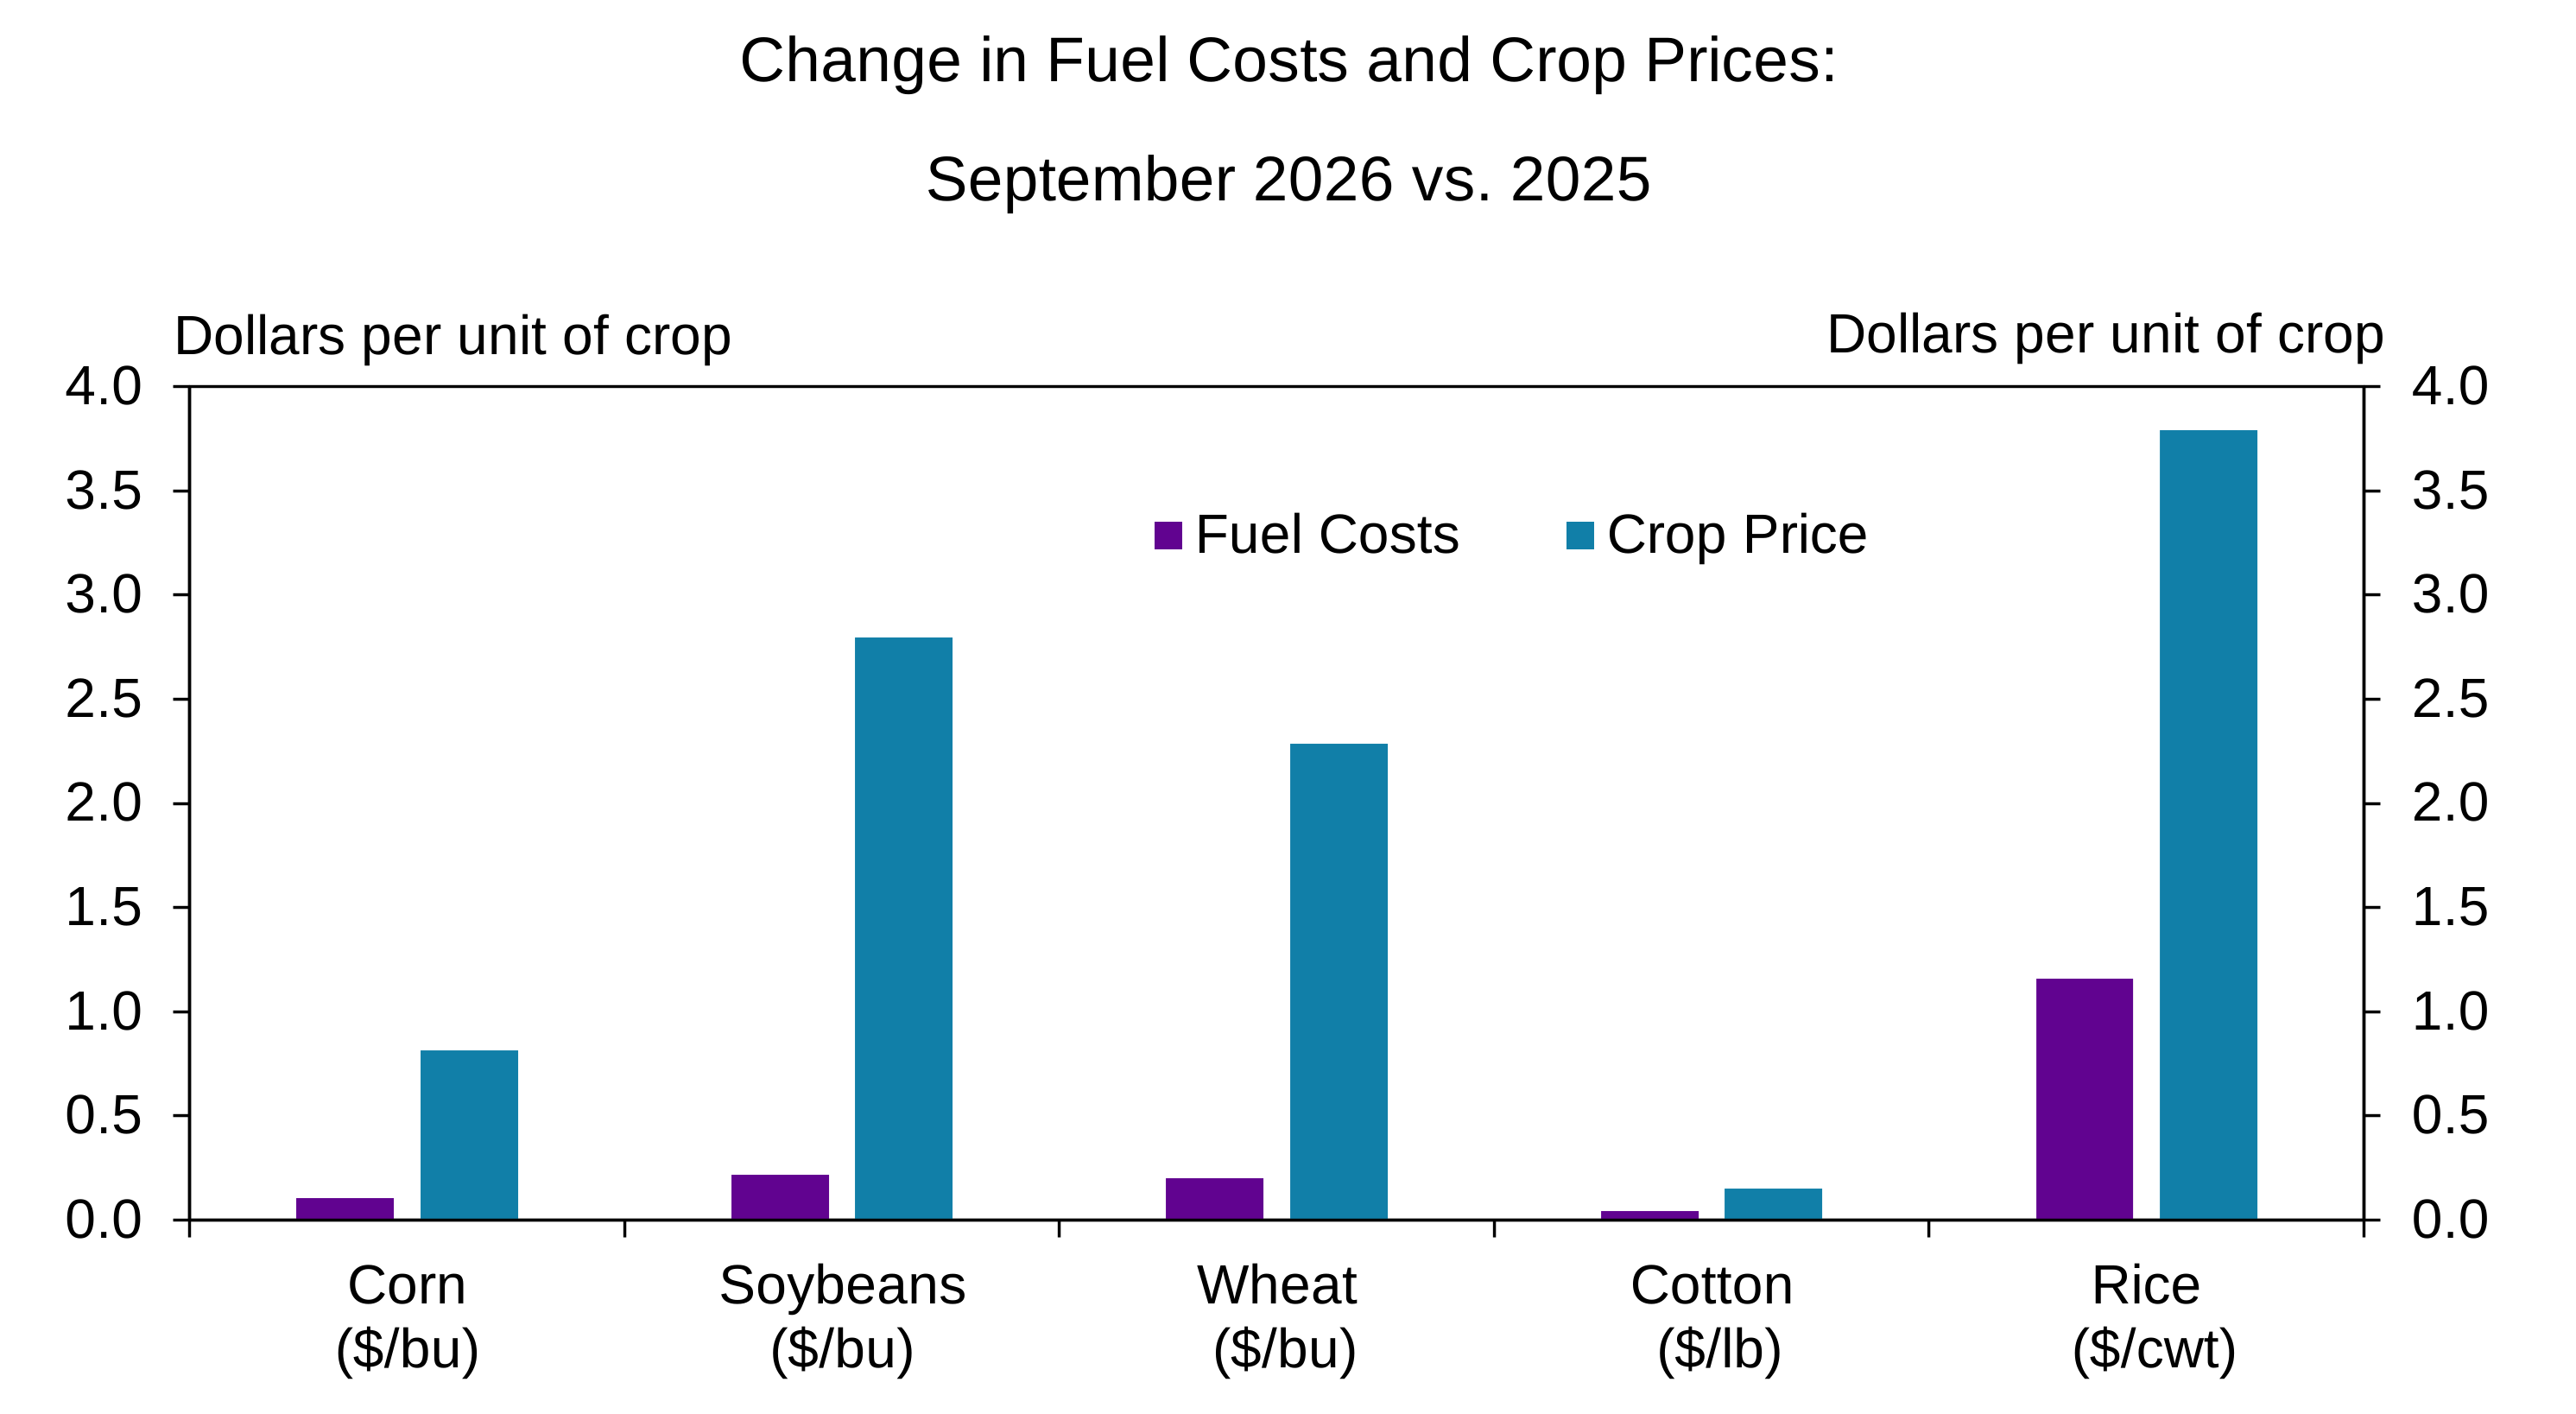
Note: The chart shows the per unit change in fuel costs and crop prices between September 2026 (month-to-date) and the 2025 average. The per unit costs are calculated by multiplying the national per acre fuel, lube, and electricity cost in 2025 by the percent increase in diesel from 2025 to September 2026 and dividing by the national average yield reported in the September WASDE.
Sources: USDA Cost and Return Estimates, EIA, Wall Street Journal, Barchart.com, and Federal Reserve Bank of Kansas City staff calculations
Find additional Insights on Agricultural and Rural Economies.
Research and Information
Agricultural Finance
Research and articles tracking trends in agricultural finance.
Insights on Ag and Rural Economies
Concise analysis on agricultural and rural economic trends.

Agricultural Data and Indicators
Data on economic and financial conditions in agriculture.
Agriculture Research Hub
All of the Kansas City Fed's research and resources on agriculture and related topics.
System Resources
Links to research and resources on agriculture and rural topics from throughout the Federal Reserve System.
Latest Research and Updates

-
2026 Agricultural Economic Summit: The Business of Agriculture Amid Structural Change | -
Further Strength in Farm Loan Growth and Agricultural Bank Financial Performance | -
Agricultural Economic Summit explores structural change in the ag sector | -
Farm Finance Deterioration Eases Slightly | -
Steady Tightening of Agricultural Credit Conditions Persists | -
High Costs and Uncertainty Will Likely Keep Cattle Inventories Low and Beef Prices Elevated for Some Time |
-
Further Strength in Farm Loan Growth and Agricultural Bank Financial Performance | -
Farm Finance Deterioration Eases Slightly | -
Steady Tightening of Agricultural Credit Conditions Persists | -
New Farm Loan Originations Ease Slightly | -
Farm Loan Growth Remains Strong as Lending Shifts at Some Large Banks | -
Continued Resilience in Farmland Values |
- Update on U.S. Economy and Agriculture |
-
Agriculture, the Economy, and the Kansas City Fed | - Economic Update on the U.S. Farm Economy |
- Update on Agricultural Credit Conditions |
- Agricultural Economic and Financial Outlook |
- An Update on Agriculture and the Economy - AgExcellence Nashville |
The Kansas City Fed's Continuing Commitment to Agriculture
Through regular surveys, analysis and connections across the industry, the Kansas City Fed has had a longstanding focus on U.S. and global agriculture. Leveraging this expertise, the Center for Agriculture and the Economy serves as a resource within the Federal Reserve System by providing timely analysis of industry developments and conducting ongoing research on the agricultural economy. The Kansas City Fed is committed to understanding developments in the agricultural economy and gathering perspectives from rural America in order to include them in discussions on the national economy.
The Kansas City Fed's Ag Connection
Agriculture is central to the Kansas City Fed’s 10th District’s economy, from farm production and food manufacturing to agricultural banking and finance. Through its regular surveys, analysis and connections across the industry, the Kansas City Fed has had a longstanding focus on the U.S. and global agricultural economy. At the same time, connecting with stakeholders and ag industry professionals through events, round tables and conversations is critical to the Bank’s work.