The U.S. population is aging rapidly, with implications for the size of the U.S. labor force. When the first baby boomers reached age 65 in 2011, just 13 percent of the U.S. population was age 65 or older. Chart 1 shows that by 2025, this share had risen to 19 percent (purple and light blue areas) and is expected to rise further over the next two decades.
Chart 1: The U.S. population is aging rapidly
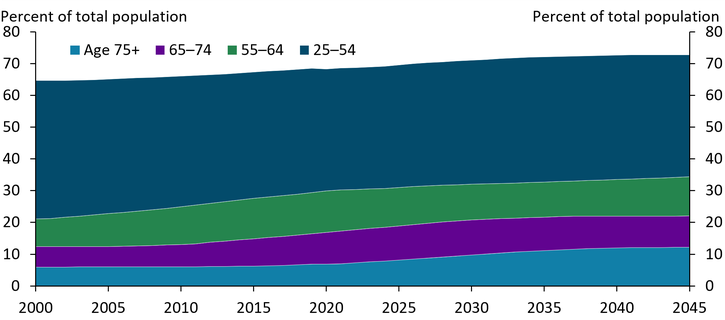
Sources: U.S. Census Bureau and U.S. Bureau of Labor Statistics.
Older individuals have lower labor force participation rates, and an aging population would be expected to dampen labor force participation and, in turn, labor force growth. Instead, the aging population has coincided with a solid increase in the size of the labor force relative to pre-pandemic levels, driven by both strong immigration flows and increases in labor force participation rates across several age cohorts. Chart 2 shows that the size of the labor force rose from 164 million in 2018 (dotted purple line) to more than 172 million in 2025 (leftmost dark blue bar), an increase of more than 8 million workers. The middle two bars in Chart 2 illustrate how immigration and increasing labor force participation rates have driven this trend. If there had been no immigration from 2018 to 2025 (second bar), the labor force would have increased by less than 2 million. Conversely, if labor force participation rates had held steady at 2018 levels (third bar), the labor force would have increased by less than 6 million. Finally, the fourth bar shows that without any immigration or any change in participation rates from 2018 levels, the size of the labor force in 2025 would have actually declined from 2018 levels.
Chart 2: Increases in labor force participation and immigration have led to large labor force gains in recent years
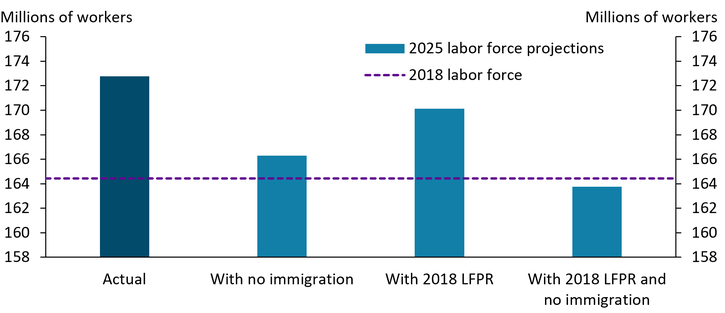
Note: Chart shows the actual size of the labor force in 2018 and 2025 alongside projections for 2025 dependent on immigration and continuing 2018 labor force participation rates (LFPR).
Sources: U.S. Census Bureau, U.S. Bureau of Labor Statistics, and author’s calculations.
While labor force gains have been stronger than expected in recent years, they are unlikely to continue, suggesting the U.S. labor force may be near its peak. The purple bars in Chart 3 show that the labor force declined last year. The blue bars show that without immigration, the labor force is projected to decline further over the next two decades even if labor force participation rates remain at their high 2025 levels for each age cohort. The persistent projected decline reflects the influence of individuals aging into cohorts with lower average participation rates.
Chart 3: Without immigration, the labor force is expected to decline over the next two decades
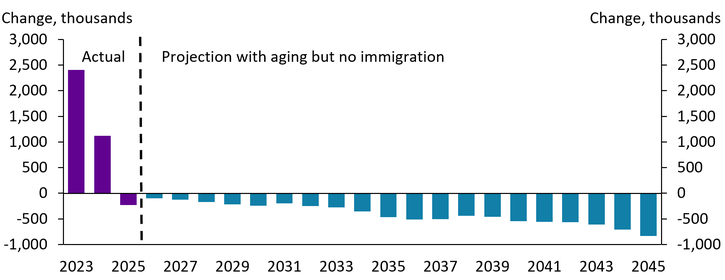
Notes: Labor force projections allow the 2025 population to age, including estimates for births and deaths. Labor force participation rates are assumed to remain at 2025 levels for each age cohort.
Sources: U.S. Census Bureau, U.S. Bureau of Labor Statistics, and author’s calculations.
Even if immigration continues at projected rates, the size of the labor force is likely to decline slightly by 2030 and more substantially by 2045. Chart 4 shows the projected size of the labor force through 2045 under different scenarios. The light blue diamonds show the projected size of the labor force with an aging population, 2025 labor force participation rates, and zero immigration (the same assumptions and projections as in Chart 3). The dark purple diamonds adjust these projections by assuming that immigration flows equal projections from the Congressional Budget Office (CBO). Although immigration helps to partly offset the effects of an aging population in this scenario, the offset is much smaller than in previous years. This smaller offset reflects the CBO’s substantially lower projections for immigration in the years ahead. After peaking above 3.5 million in 2023, the CBO projects net immigration will fall to 574,000 in 2026.
Chart 4: Immigration and labor force participation rate assumptions alter labor force projections
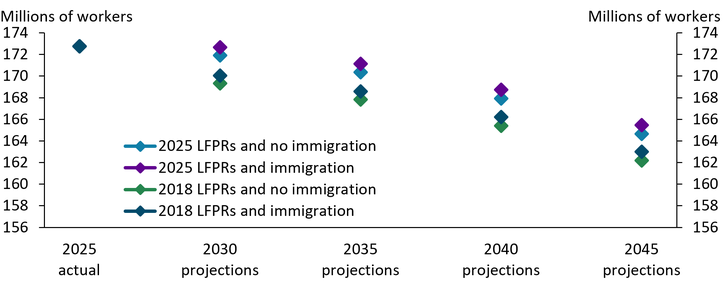
Sources: U.S. Census Bureau, U.S. Bureau of Labor Statistics, CBO, and author’s calculations.
Although gains in labor force participation and immigration have more than fully offset downward pressure on the labor force from an aging population in recent years, this trend is unlikely to continue. Current labor force participation rates are at historically high levels, with limited room to increase further even if the labor market remains healthy. Meanwhile, the U.S. population is expected to continue to grow older over the next two decades, with the share of people age 65 and older reaching 22 percent by 2045 and the share age 75 and older reaching 12 percent. This continued aging is projected to weigh on the labor force, offsetting the CBO’s projections for immigration and keeping the labor force about flat over the next five years. Overall, the effects of an aging population combined with slower immigration flows and limited upside potential for labor participation rates suggest that the labor force is currently near its peak.
Alison Felix is a senior policy advisor and economist at the Federal Reserve Bank of Kansas City. The views expressed are those of the author and do not necessarily reflect the positions of the Federal Reserve Bank of Kansas City or the Federal Reserve System.
Author