
Following the start of military conflict between Iran and the United States and Israel in February 2026 and its subsequent spillover into the broader Middle East, West Texas Intermediate (WTI) oil prices rose by over 50 percent. This oil price shock has prompted discussion among monetary policymakers on how and whether to respond. Historically, oil shocks have temporarily raised unemployment and inflation but households’ expectations for future inflation remained anchored—that is, in line with the Federal Reserve’s long-term target—without significant monetary policy tightening (Känzig 2021). Since 2010, however, both the energy and policy landscapes have changed. First, the United States has shifted from being a net oil importer to a net oil exporter. Second, the Federal Reserve has specified an explicit goal of 2 percent inflation and has also broadened its policy toolkit beyond the federal funds rate. As such, the current oil shock may affect the economy differently now than in the past.
A closer look at oil shocks since 2010 may offer some insight into the current episode. Using changes in oil futures prices following OPEC (Organization of Petroleum Exporting Countries) production announcements from Känzig (2021), Chart 1 presents estimates of how oil shocks affected oil price growth, unemployment, and inflation in the United States from January 2010 through January 2026._ Because the duration of the price shock determines other economic outcomes, I first assess the typical persistence of a shock that generates a 50 percentage point initial increase in WTI price growth (scaled to match the recent increase). Panel A illustrates that after the initial increase, WTI price growth ticks up slightly the month after the shock and returns to its pre-shock level after about two years (though it is statistically indistinguishable from its pre-shock level within one year)._ Panels B and C of Chart 1 illustrate that while oil shocks have led to increases in both inflation and unemployment since 2010, the increase in inflation has been significantly more persistent than the increase in unemployment. Following a shock that raises WTI growth by 50 percentage points, the unemployment rate (Panel B) increases roughly 1 percentage point but normalizes within three months. PCE inflation (Panel C), however, takes over two years to normalize statistically (reflected by the lower bound of the 90 percent confidence region intersecting zero), which is even longer than WTI price growth.
Chart 1: Oil shocks increase WTI price growth, unemployment, and PCE inflation
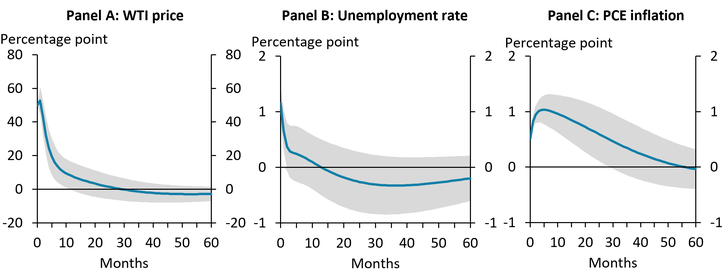
Notes: Panel A shows the 12-month growth rate of the spot price of WTI oil. Panel B shows the 12-month growth rate of the PCE price index for Personal Consumption Expenditures (PCE). Data covers January 2010 through January 2026. Oil shock is scaled to generate a 50 percentage point increase in WTI price growth. Shaded area reflects 90 percent confidence interval using Newey-West standard errors.
Sources: U.S. Bureau of Labor Statistics and U.S. Bureau of Economic Analysis (both accessed via FRED, Federal Reserve Bank of St. Louis).
Oil shocks can affect inflation both directly, through energy costs, and indirectly, by influencing unemployment as well as households’ and firms’ expectations for future inflation. Oil shocks may increase inflation by raising energy costs for consumers, such as gasoline and utility costs, as well as through higher energy costs passed on to consumers by producers of goods and services. Shocks may also be disinflationary by increasing unemployment, which subsequently reduces demand, though Panel B of Chart 1 suggests that this effect is short lived. Finally, shocks can affect the inflation expectations of consumers and firms. Inflation may increase because firms expect inflation to increase, leading them to raise prices to front-run expected cost increases and to keep pace with their competitors’ pricing. This channel is of particular concern to policymakers, as an increase in inflation expectations that outlasts the direct effects of an oil shock may indicate that inflation expectations have become unanchored and are no longer in line with the Federal Reserve’s target.
Using the University of Michigan’s Survey of Consumers, Chart 2 shows how consumers’ expectations for inflation evolve after an oil price shock (a good proxy for producers’ inflation expectations, as shown in Coibion and Gorodnichenko 2021). Panel A illustrates expectations for inflation one year ahead. After the oil shock, inflation expectations increase and remain elevated in parallel with actual inflation. However, inflation expectations remain anchored in that they return to normal within a couple of years after the shock. Panel B shows that five-year-ahead inflation expectations are even better anchored, as they do not rise significantly following an oil shock. In short, if the rest of the economy follows recent precedent, inflation expectations are unlikely to become unanchored due to the conflict in the Middle East.
Chart 2: Inflation expectations are anchored against oil shocks
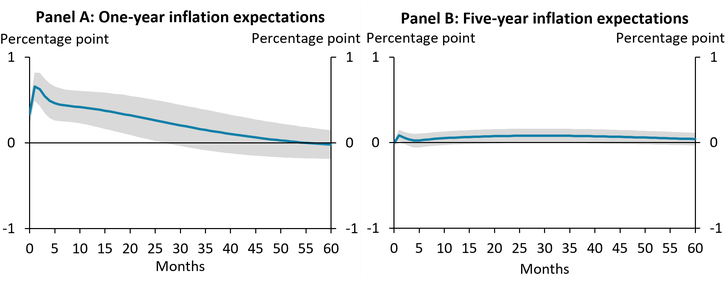
Notes: Series are the median of responses. Data covers January 2010 through January 2026. Oil shock scaled to generate a 50 percentage point increase in WTI price growth. Shaded area reflects 90 percent confidence interval using Newey-West standard errors.
Source: University of Michigan (accessed via FRED, Federal Reserve Bank of St. Louis).
“Recent precedent” may include the stance of monetary policy, which can also affect the path of inflation expectations after an oil shock. Understanding monetary policy during the 2010–26 period requires looking beyond the federal funds rate alone, as it remained fixed at the effective lower bound for much of this period while balance sheet policies affected a broader basket of interest rates. To capture the wholistic stance of policy, Chart 3 uses the proxy federal funds rate of Choi and Doh (2016), which incorporates changes in long-term government and private-sector interest rates, to illustrate how policy responded to oil shocks. The blue line shows that after remaining constant for a few months, monetary policy tightens significantly from one to three years following an oil shock until inflation expectations have normalized. Although these estimates do not indicate what would have happened without monetary policy tightening, they are consistent with tighter policy contributing to inflation expectations remaining anchored against oil shocks.
Chart 3: Monetary policy tightens following an oil shock
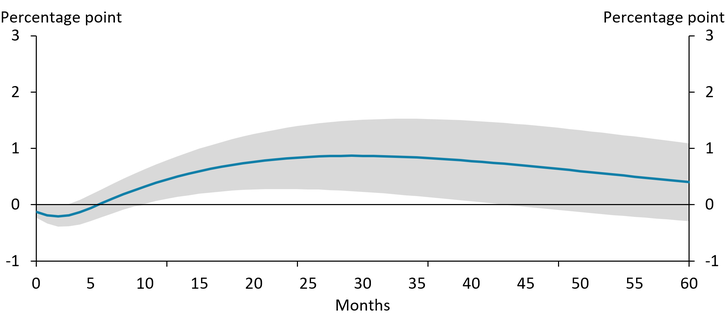
Notes: Data covers January 2010 through January 2026. Oil shock scaled to generate a 50 percentage point increase in WTI price growth. Shaded area reflects 90 percent confidence interval using Newey-West standard errors.
Source: Federal Reserve Bank of San Francisco.
The conflict in the Middle East increased oil prices and reset expectations of the path of monetary policy. The first step for policymakers to determine the best course for policy is to understand how the economy has responded to oil shocks in recent history. Examining oil shocks since 2010 shows that inflation expectations (and inflation itself) have only returned to normal after monetary policy tightens, suggesting that anchored inflation expectations may be the outcome of monetary policy’s response to oil shocks rather than a feature that can be taken for granted.
Endnotes
-
1 The series for oil shocks is provided by Diego Känzig, based on Känzig (2021) but updated through December 2025 and available. All estimates presented are from a structural vector autoregression model using the oil news shock as an external instrument. The model controls for two lags of each variable as chosen by the Akaike information criterion.
-
2 I use the typical persistence in post-shock WTI growth shown in Panel A to calculate all other estimates; however, it is impossible to say how persistent the current increase in WTI price growth due to the conflict with Iran will be. While WTI growth was elevated for three months following the start of the conflict, it fell significantly after Iran and the United States signed a “memorandum of understanding” in late June.
Article Citation
Glover, Andrew. 2026. “In Recent Years, Inflation Expectations Increased After Oil Shocks and Stabilized Only Once Monetary Policy Tightened.” Federal Reserve Bank of Kansas City, Economic Bulletin, July 8.
References
Coibion, Olivier, and Yuriy Gorodnichenko. 2015. “External LinkIs the Phillips Curve Alive and Well After All? Inflation Expectations and the Missing Disinflation.” American Economic Journal: Macroeconomics, vol. 7, no. 1, pp. 197–232.
Doh, Taeyoung, and Jason Choi. 2016. “Measuring the Stance of Monetary Policy On and Off the Zero Lower Bound.” Federal Reserve Bank of Kansas City, Economic Review, vol. 101, no. 3, pp. 5–24.
Känzig, Diego R. 2021. External Link“The Macroeconomic Effects of Oil Supply News: Evidence from OPEC Announcements.” American Economic Review, vol. 111, no. 4, pp. 1092–1125.
Andrew Glover is a research and policy advisor at the Federal Reserve Bank of Kansas City. The views expressed are those of the author and do not necessarily reflect the positions of the Federal Reserve Bank of Kansas City or the Federal Reserve System.
Author