
The post-pandemic U.S. business investment boom is changing shape, with investment tied to artificial intelligence now contributing meaningfully to GDP growth (Soto, Thieu, and Allen 2026). The most visible first phase of the boom was factory construction: Adjusted for construction costs, private spending on new manufacturing plants averaged about 70 percent more in 2022–25 than in 2015–19._ Chart 1 shows that total manufacturing construction (dark blue line) peaked in November 2024, with the post-2021 surge led by computer, electronic, and electrical plants (dashed purple line), and has since fallen 37 percent in real terms. Data centers now constitute a second phase of the boom: Construction has risen steadily (green line) and in April 2026 exceeded spending on computer, electronic, and electrical plants for the first time since 2021.
Chart 1: Manufacturing construction has receded from its 2024 peak while data center construction has continued to rise
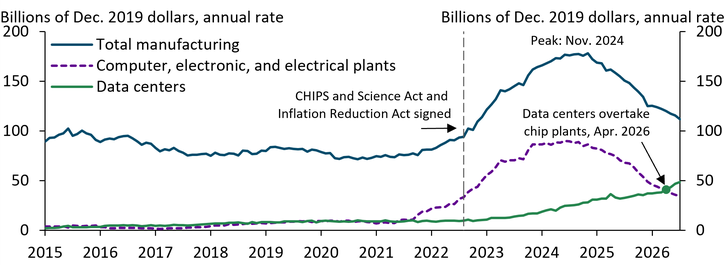
Notes: Chart shows private construction put in place, seasonally adjusted, deflated by U.S. Bureau of Labor Statistics (BLS) producer price indexes for the relevant building type. Computer, electronic, and electrical plants are a manufacturing subcategory. Data centers are an office subcategory.
Sources: U.S. Census Bureau, BLS (both accessed via FRED, Federal Reserve Bank of St. Louis), and author’s calculations.
Both manufacturing plants and data centers take years to build, but their supply chain footprints differ. Semiconductor plants, a key part of the recent manufacturing wave, require large upfront investments in structures and specialized fabrication equipment, with much of the resulting production capacity arriving only after the facilities are completed. Data centers, by contrast, can generate near-term demand for large volumes of transformers, switchgear, generators, and servers, while the power they draw adds to rapidly growing electricity demand (Çakır Melek and Gallin 2024). This changing composition of investment raises two questions: How much domestic productive capacity has the investment boom added, and are supply constraints emerging as AI-related demand accelerates?
Capacity, which measures the sustainable maximum output from capital already in place, has grown unevenly across manufacturing during the investment boom. Panel A of Chart 2 shows that capacity in high-tech industries (light blue line)—specifically, computers, communications equipment, and semiconductors—has risen 72 percent since December 2019._ However, these industries represent only about 3 percent of manufacturing output, so a 72 percent increase translates into only a 2 percent gain in total manufacturing capacity (dark blue line). High-tech capacity was already climbing before the boom, growing about 7 percent a year over 2015–19; it stalled from 2019 through 2021, then grew at roughly 13 percent a year from 2022. Panel B shows that high-tech production (which can rise or fall within the limits of capacity) grew steadily at about 7 percent per year through 2021, then accelerated modestly; capacity therefore lagged production in 2020–21 and has been catching up since. Some of the investment boom’s contribution to capacity is likely still ahead, as capacity measures capital already in place. Meanwhile, capacity and production in the rest of manufacturing (green line) were declining before the pandemic and have changed little since 2022. Thus, the boom intensified an existing high-tech trend rather than broadening capacity across manufacturing.
Chart 2: Capacity and production have grown rapidly in high tech, but not in the rest of manufacturing
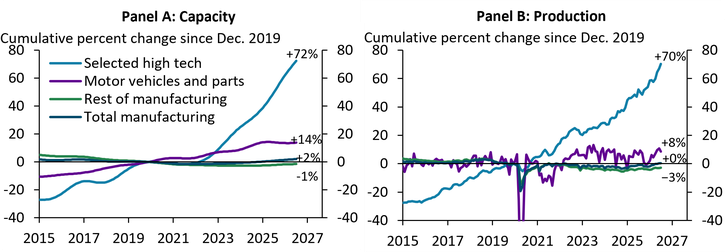
Notes: “Selected high tech” comprises computers and peripheral equipment (NAICS 3341), communications equipment (3342), and semiconductors and other electronic components (3344). The rest of manufacturing excludes selected high tech and motor vehicles and parts. Motor-vehicle production fell about 80 percent in April 2020 and is off the scale of Panel B.
Sources: Board of Governors of the Federal Reserve System and author’s calculations.
If capacity is not expanding broadly as investment demand accelerates, pressure should be most visible in the industries supplying the build-out. Panel A of Chart 3 breaks the selected high-tech group into its components. Utilization, the ratio of production to capacity, is near its pre-pandemic average for selected high tech as a whole, but conditions differ sharply within the high-tech group: Utilization in computers and peripheral equipment (dark purple line) has risen to 83 percent, its highest rate since 2011, but semiconductor utilization (green line) is near its pre-pandemic average, and communications equipment (light purple line) remains unusually low. Panel B shows that utilization for electrical equipment, appliances, and components—a separate manufacturing industry not included in selected high tech—has risen to 87 percent, its highest rate since 2008, even as total manufacturing utilization has softened. Computers and electrical equipment—the two industries most directly serving the build-out—stand out for unusually high utilization.
Chart 3: Capacity utilization has climbed to multi-year highs in computers and electrical equipment, but not across all high tech
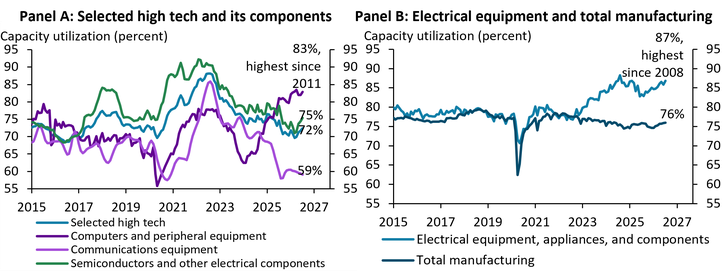
Notes: Capacity utilization is the ratio of the production index to the capacity index. Panel A shows selected high tech (NAICS 3341, 3342, and 3344) and its three components. Panel B shows electrical equipment, appliances, and components (NAICS 335), which is part of the “rest of manufacturing” presented in Chart 2.
Sources: Board of Governors of the Federal Reserve System and author’s calculations.
Electrical equipment provides the clearest evidence of tight domestic supply, with high utilization even though capacity has not increased._ Chart 4 shows that prices for transformers and switchgear (light blue and purple lines) have nearly doubled since 2019—more than twice the rise in all manufacturing prices (dark blue line)—while domestic production of this equipment (dashed blue line) is lower. Imports (dashed green line) have filled much of the gap: After adjusting for import prices, the volume of transformers and switchgear imports is roughly 80 percent above its 2019 level._
Chart 4: Since 2019, grid equipment prices and imports have nearly doubled while U.S. production has fallen
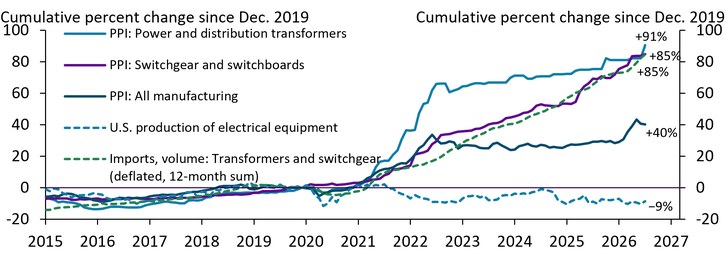
Notes: Chart shows producer price indexes (PPI) for power and distribution transformers and for switchgear and switchboard apparatus, which measure prices received by domestic producers. Production is the Federal Reserve index for electrical equipment (NAICS 3353: transformers, motors and generators, switchgear), a component of NAICS 335 in Chart 3. Imports are the 12-month sum of general customs value for HS 8504 and 8535–8537, deflated by the BLS import price index for electrical equipment.
Sources: BLS, Board of Governors of the Federal Reserve System, U.S. Census Bureau, and author’s calculations.
This pattern is consistent with Goolsbee (1998), who finds that investment incentives can raise equipment prices when the short-run supply is slow to respond. Transformers and switchgear both have long lead times and tight short-run supply, although imports are an important margin of adjustment. Other forces—including pandemic-era disruptions, tariffs, commodity costs, and grid modernization—also matter, so the AI build-out cannot explain the full price increase. Still, the increases persisted through 2023 and 2024, when copper prices were relatively flat, and before the 2025 tariff changes.
The construction boom has expanded U.S. productive capacity, but the gains are concentrated in a small, high-tech segment that was already growing before the boom. Where AI build-out demand is most concentrated, adjustment has come through higher utilization, prices, and imports rather than new domestic supply. In the near term, those bottlenecks can add to price pressures and project costs; over the longer term, how quickly capacity expands will help determine how quickly AI-related investment can be deployed and translate into productivity gains. Output per hour has strengthened, but the pickup is not yet broad based, and AI adoption explains little of the aggregate gain (Çakır Melek and Miller 2026). Whether capacity broadens beyond today’s narrow high-tech segment will be the development to watch.
Endnotes
-
1 Census construction spending is reported in current dollars and deflated here using the BLS producer price index for the relevant building type.
-
2 Federal Reserve capacity indexes measure sustainable maximum output and are estimated primarily from the Census Bureau’s Quarterly Survey of Plant Capacity. In several high-tech industries, production is deflated with quality-adjusted price indexes, so measured capacity reflects improving capability as well as additional plants. Annual growth in selected high-tech capacity was 6.6 percent in 2015–19, −0.3 percent in 2019–22, and 13.0 percent in 2022–26; corresponding production growth was 6.8, 6.7, and 9.2 percent, respectively.
-
3 Capacity and utilization for electrical equipment are available only for NAICS 335, which also includes appliances and lighting; capacity for that aggregate is about 9 percent below its 2019 level. Chart 4 uses the narrower NAICS 3353 production series for transformers, motors and generators, and switchgear.
-
4 The broad BLS import price index for electrical equipment rose 7 percent from December 2019 to July 2026, implying an import-volume increase of about 80 percent. Using the narrower import price index for electrical switching and protecting apparatus, which rose 31 percent, implies an increase of about 50 percent.
Article Citation
Çakır Melek, Nida. 2026. “Has the Investment Boom Expanded U.S. Productive Capacity?” Federal Reserve Bank of Kansas City, Economic Bulletin, October 13.
References
Çakır Melek, Nida, and Alex Gallin. 2024. “Powering Up: The Surging Demand for Electricity.” Federal Reserve Bank of Kansas City, Economic Bulletin, September 25.
Çakır Melek, Nida, and Sydney Miller. 2026. “A New U.S. Productivity Chapter? What Industry Data Say About AI.” Federal Reserve Bank of Kansas City, Economic Bulletin, February 11.
Goolsbee, Austan. 1998. “External LinkInvestment Tax Incentives, Prices, and the Supply of Capital Goods.” Quarterly Journal of Economics, vol. 113, no. 1, pp. 121–148.
Soto, Paul E., Mason Thieu, and Jeffrey S. Allen. 2026. “External LinkThe AI Buildout and the Economy: Publicly Available Data to Assess AI’s Impact.” Board of Governors of the Federal Reserve System, FEDS Notes, July 17.
Nida Çakır Melek is a senior economist at the Federal Reserve Bank of Kansas City. The views expressed are those of the author and do not necessarily reflect the positions of the Federal Reserve Bank of Kansas City or the Federal Reserve System.
Author