Supply shocks and energy infrastructure damage from the ongoing Iran conflict as well as the Russia-Ukraine War are disrupting broad segments of the global oil supply chain. Chart 1 shows that since the start of the Iran conflict, global oil supply shocks have driven oil prices (blue line) roughly 63 percent higher, while gasoline (purple line) and diesel prices (green line) surged by roughly 75 percent and 93 percent, respectively. This sharp rise in fuel prices reflects extreme tightness in refined product markets for both diesel and gasoline.
Chart 1: Fuel prices have risen more than oil prices since the start of the Iran conflict
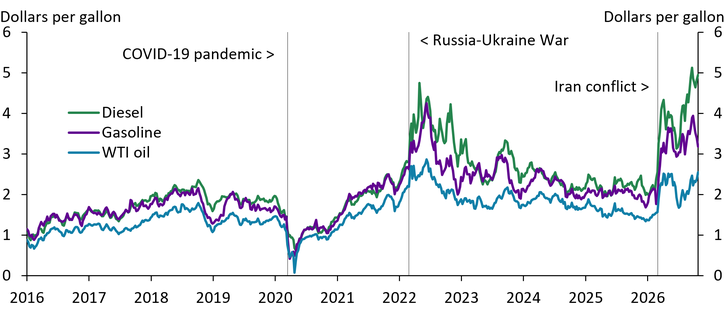
Notes: Diesel and gasoline prices are weekly wholesale spots prices for the U.S. Gulf Coast. Oil prices are typically shown as dollars per barrel and are converted to dollars per gallon (gallon = barrel/42). The COVID-19 pandemic was declared a U.S. national emergency on March 13, 2020; Russia invaded Ukraine on February 24, 2022; and the Iran conflict began on February 28, 2026.
Source: U.S. Energy Information Administration (Haver Analytics).
As global petroleum markets have come under strain, petroleum inventory buffers have fallen sharply (Rodziewicz 2026). Panel A of Chart 2 shows that while total U.S. petroleum inventories (purple line) were growing at the beginning of the year, hovering near their five-year averages, they have plummeted in recent months. Total U.S. petroleum inventories are now at decadal lows, driven in part by large releases of emergency reserves announced by the United States following the onset of the Iran conflict (IEA 2026a; DOE 2026). Indeed, the U.S. Strategic Petroleum Reserve (SPR) (green line) fell by over 130 million barrels throughout the year, causing U.S. total inventories to fall 10 percent below their five-year average. Absent emergency releases from the SPR, domestic commercial inventories (blue line) would likely be much lower._
Chart 2: Petroleum and fuel inventory buffers are depleted
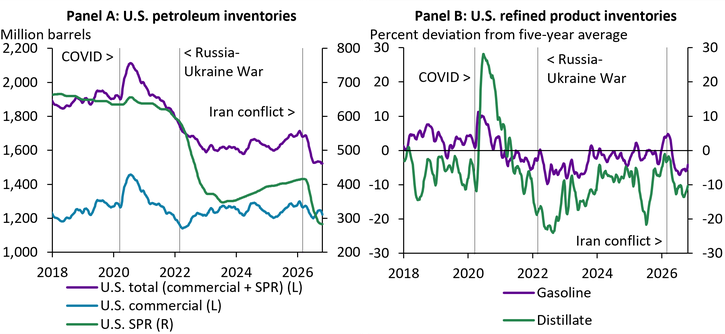
Notes: Data are shown as a four-week moving average. SPR is the U.S. Strategic Petroleum Reserve. Distillate fuel oil includes diesel and heating oil. Diesel makes up the largest share of distillates in the United States (EIA 2023).
Source: EIA (Haver Analytics).
While the petroleum inventory situation is tenuous, fuel inventories are also under great strain. Panel B of Chart 2 shows that distillate inventories (green line) have been on a steady decline since the end of the COVID-19 pandemic, creating extreme tightness in domestic diesel markets. After years of inventory declines, U.S. distillate (mostly diesel) inventories are now roughly 20 percent lower than their pre-pandemic levels. Gasoline stocks (purple line), while low, have fared slightly better and are currently 10 percent lower than their pre-pandemic averages._
As inventories eroded, bottlenecks have emerged in the downstream sector of the oil supply chain. Amid extraordinary market conditions, refiners are commanding historically high margins for converting crude oil into finished fuel products. Chart 3 shows that gasoline and diesel crack spreads—an estimate of the margin received by a refinery for converting oil into refined products—have widened dramatically over the past year._ Although crack spreads have retraced somewhat in recent weeks, the gasoline crack spread (purple line) is still a little over double what it was last year, and the diesel crack spread (green line) is more than three times year-ago levels. While refinery margins historically make up a modest share of retail fuel prices—less than 20 percent—in recent weeks crack spreads accounted for closer to 30 percent of the cost of a gallon of gasoline and more than 40 percent of the cost of a gallon of diesel.
Chart 3: U.S. refinery margins are at historic highs
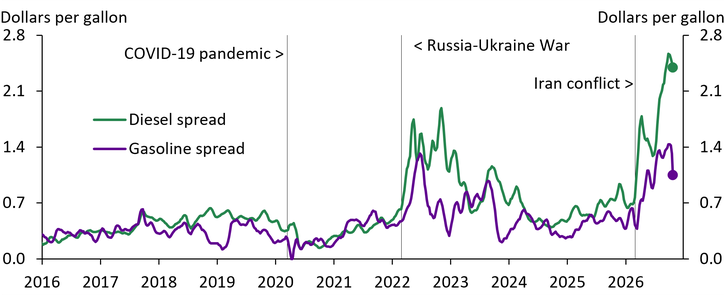
Notes: Data shown as four-week moving averages. Crack spreads are calculated as the difference between WTI oil prices and wholesale spot product (diesel and gasoline) prices for the U.S. Gulf Coast.
Sources: EIA (Haver Analytics).
Even with refinery margins at historical highs, refining capacity additions are limited in the short run and unable to grow to provide material relief. Panel A of Chart 4 shows that U.S. refining capacity (purple line) has been little changed over the last decade, while capacity utilization (blue line) is near all-time highs. While domestic refiners are working at near full capacity to produce more refined products and capture historic margins, global refinery capacity is now at risk from the Iran conflict and Russia-Ukraine War. Panel B of Chart 4 shows that roughly 18 percent of global refining capacity resides in regions currently in conflict—6.5 percent in Russia (light purple bar) and 11.5 percent in the Middle East (dark purple bar). These exposures are substantial, equivalent to roughly 20 years of global refining capacity growth.
Chart 4: Refineries have limited capacity to relieve market constraints
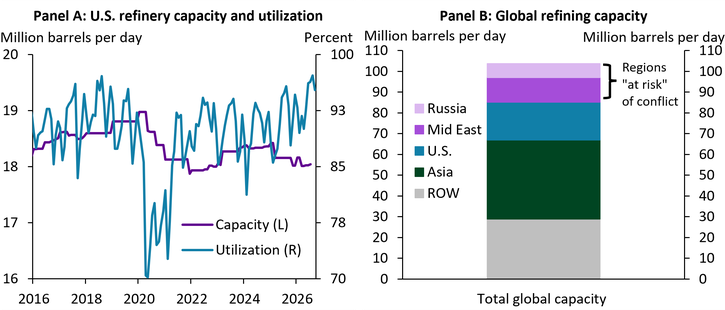
Notes: Capacity is total U.S. refinery capacity. Utilization is U.S. refinery capacity utilization (gross refinery inputs/operable refinery capacity). Global capacity is the 2025 average capacity. ROW is “Rest of World.”
Sources: EIA and Energy Institute (both accessed via Haver Analytics).
Refinery capacity will likely remain constrained going forward. Attacks have continued on refineries in both Russia and the Middle East. While estimates of current refinery damages or disruptions range widely—from a few percent of global refining capacity to over 10 percent—the damages are imposing additional constraints amid extraordinary market conditions, lowering the output of refined products globally (Thompson and Golding 2026; Collins 2026; IEA 2026b, 2026c). Repairing damaged refinery infrastructure can take months to years, suggesting capacity constraints will likely persist even after the conflicts and supply disruptions end. As a result, refinery margins, and therefore fuel prices, are likely to remain elevated for an extended period, even if crude oil prices decline.
Endnotes
-
1 International Energy Agency (IEA) member countries announced a combined record emergency oil inventory release of 400 million barrels following the Iran conflict. The U.S. share of that coordinated release was 172 million barrels from the SPR. As of this writing, the United States has roughly 40 million barrels remaining on its original release target (IEA 2026a; DOE 2026). In early October, Group of Seven (G7) countries announced an acceleration of their remaining inventory release commitments (roughly 100 million barrels), prioritizing the release of diesel fuel to global markets (European Council 2026). Global petroleum inventories have also declined precipitously throughout 2026 and are at decadal lows (EIA 2026).
-
2 Distillate fuel oil includes mostly diesel and some heating oil (EIA 2023). Distillate and gasoline inventories relative to pre-pandemic levels are quoted as the average over the last three months of 2026 ending the week of October 23, relative to averages in 2018–19 for the same three-month period.
-
3 Single-product crack spreads are the estimated margin received by a refinery for converting a barrel of oil into a barrel of a single refined product (diesel or gasoline) and are useful for understanding the value received by a refiner for producing a gallon of refined product. In reality, refineries make a wide range of refined products from a single barrel of oil and receive a multiple-product crack spread for refining a barrel of oil; 3:2:1 (three parts, two parts gasoline, and one part diesel) and 5:3:2 (five parts oil, three parts gasoline, and two parts diesel) are both commonly used crack spreads (EIA 2011).
Article Citation
Rodziewicz, David. 2026. “Downstream Bottlenecks in the Oil Supply Chain Are Contributing to Historically High Refinery Margins and Fuel Prices.” Federal Reserve Bank of Kansas City, Economic Bulletin, November 5.
References
DOE (U.S. Department of Energy). 2026. “External LinkUnited States to Release 172 Million Barrels of Oil from the Strategic Petroleum Reserve.” Press Release, March 11.
Collins, Gabriel. 2026. “External LinkEnergy Disruption Monitor.” Collins Research Portal (accessed October 16, 2026).
EIA (U.S. Energy Information Agency). 2026. “External LinkShort-Term Energy Outlook (STEO) – October 2026.” October 6.
EIA (U.S. Energy Information Agency). 2023. “External LinkUncoupling Diesel Consumption and Economic Growth.” Short-Term Energy Outlook, June 6.
EIA (U.S. Energy Information Agency). 2011. “External LinkAn Introduction to Crack Spreads.” Today in Energy, June 2.
European Council. 2026. “External LinkG7 Leaders’ Statement on Global Energy Security and Market Stability.” Press Release, October 2.
IEA (International Energy Agency). 2026a. “External LinkIEA Member Countries to Carry Out Largest Ever Oil Stock Release Amid Market Disruptions from Middle East Conflict.” Press Release, March 11
IEA (International Energy Agency). 2026b. “External LinkOil Market Report – September 2026.” September 11.
IEA (International Energy Agency). 2026c. “External LinkOil Market Report – October 2026.” October 14.
Rodziewicz, David. 2026. “Higher Oil Prices Will Likely Increase Severance Tax Revenues in Rocky Mountain States.” Federal Reserve Bank of Kansas City, Rocky Mountain Economist, May 6.
Thompson, Jesse, and Garrett Golding. 2026. “External LinkRefinery Outages Pumping Up Fuel Prices More Than Cost of Crude Oil.” Federal Reserve Bank of Dallas, Dallas Fed Economics, October 8.
David Rodziewicz is an advanced economics specialist at the Federal Reserve Bank of Kansas City. The views expressed are those of the author and do not necessarily reflect the positions of the Federal Reserve Bank of Kansas City or the Federal Reserve System.
Author