The coronavirus pandemic has obviously hurt global growth by shutting down businesses and restraining consumer spending. However, estimating the size of the effect is challenging due to a lack of economic data. China, where the outbreak first began, may provide an early gauge of the virus’s economic reach. Although official GDP numbers are released with a lag, daily data can provide an early snapshot of China’s first-quarter growth.
Chart 1 plots indexes of China’s daily coal consumption and traffic delays to illustrate the coronavirus outbreak’s initial effects on electricity production and business activity, respectively. The indexes show this year’s level relative to their average level on the same day over the last three years. Because the dates of Chinese New Year, a time in which people in China do not work, vary each year, we realign the dates and use date “0” to refer to January 24, 2020, the day before the Chinese New Year began. Accordingly, the dashed line at date “−1,” two days before the Chinese New Year, indicates the beginning of the lockdown in Wuhan. We normalize the index so that a reading of 100 means that the 2020 level of coal consumption or traffic delay time is equal to its 2017–19 average level.
Chart 1: China’s Daily Coal Consumption and Traffic Delays (Relative to 2017–19 Average)
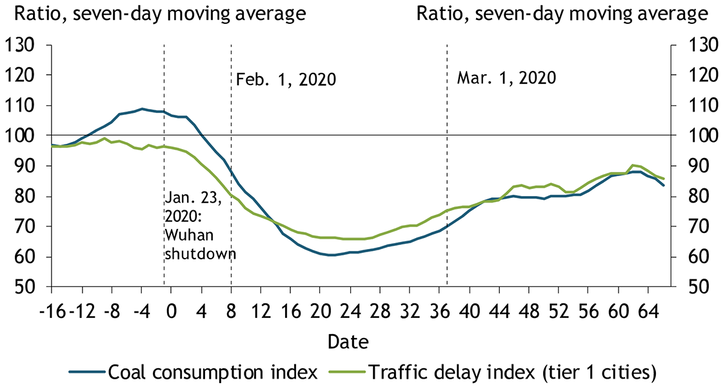
Note: Tier 1 cities are the four largest cities in China: Beijing, Shanghai, Guangzhou, and Shenzhen.
Sources: Wind Information and authors’ calculations.
As the chart shows, both coal consumption (blue line) and traffic delay times (green line) dropped by nearly 40 percent in the first three weeks following the shutdown in Wuhan, which marked the beginning of a sequence of strict quarantine polices in China. Both series remained about 10 percent below their previous average levels into late March. In addition, the slope of both lines flattened somewhat in mid-March, suggesting the recovery from the outbreak may have been slow.
Chart 2 shows a similar pattern using satellite data on China’s nighttime lights. The amount of light in a given region is positively correlated with economic development in that region, making light data useful in estimating GDP growth (Henderson, Storeygard, and Weil 2012). The first two bars in Chart 2 show that growth in China’s nighttime lights dropped sharply in January and February 2020 relative to the previous year. The next four bars show that light growth continued to decline in the first week of March and then gradually recovered. However, the amount of nighttime light in the fourth week of March was still about 10 percent lower than it was at the same time in 2019 and shows little improvement compared with the previous week. Together, the high-frequency data in Charts 1 and 2 suggest that economic activity was very weak in February, when China implemented strict lockdown and quarantine policies. In addition, the charts show that recovery has been slow in March, suggesting the economy is unlikely to fully rebound from the outbreak’s effects in the short term.
Chart 2: Growth in China’s Nighttime Lights from One Year Ago
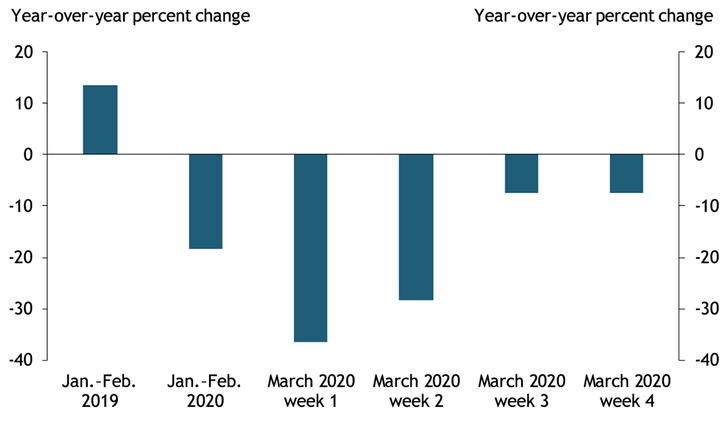
Sources: NASA Worldview and authors’ calculations.
To more directly estimate the effects on China’s GDP growth, we use four statistical models. Each model has its own advantages in dealing with different types of data, and comparing estimates across these models allows us to get a more complete picture of Chinese economic growth. Our first model is a dynamic factor model, a popular statistical model that is widely used in many countries to provide real-time economic forecasts of GDP growth. The main strength of this model is that it can incorporate data with mixed frequencies and missing values (Bańbura, Modugno, and Reichlin 2013; Bańbura and Modugno 2014). Our second model is a monthly regression model that directly ties Chinese GDP growth to 14 selected monthly variables that have been shown to approximate Chinese GDP growth reasonably well (Nie 2016)._ Our third model is a diffusion index model that summarizes a large set of variables with a few indexes that we can then use to forecast GDP growth; Stock and Watson (2002) provide support for this approach. Finally, our fourth model is a complete set regression model, which makes many forecasts based on different subsets of potential predictors and then forms a final forecast by averaging these individual forecasts (see Giannone, Lenza, and Primiceri 2018; Elliott, Gargano, and Timmermann 2013).
Our analysis is based on an unbalanced panel data set with 24 variables of different frequencies that cover key measures of production, investment, consumer spending, manufacturing, real estate, trade activity, government policies, and daily economic activities from January 1999 to March 2020._ We first use the dynamic factor model to yield a balanced panel, which we then use to estimate the other three models._
Table 1 reports these models’ estimates of first-quarter GDP growth taken weekly from February 10 to March 30, 2020._ For each model, the table reports estimates of year-over-year growth (that is, growth in 2020:Q1 relative to 2019:Q1) as well as annualized quarter-over-quarter growth (that is, growth from 2019:Q4 to 2020:Q1). Together, the estimates reveal two key findings. The first finding is that all estimates suggest that Chinese GDP growth is likely to be historically low in the first quarter of 2020. In particular, our complete set regression estimates a 4.1 percent decline in real GDP from one year ago and a 28.9 percent decline from the previous quarter (based on an annualized rate). Our monthly regression model shows a smaller decline (2.6 percent, year-over-year), while the diffusion index model suggests an even steeper decline (4.8 percent, year-over-year). Although the dynamic factor model alone suggests weak positive growth (0.7 percent, year-over-year), the estimate is nevertheless more than 5 percentage points lower than GDP growth in the third and fourth quarters of 2019 (6 percent, not shown). The main reason the dynamic factor model predicts higher growth is that it puts more weight on data before February, which indicated stable Chinese growth. These data have become less useful in measuring current growth dynamics.
Table 1: China’s 2020:Q1 GDP Growth Estimates from Different Forecasting Models

Source: Authors’ calculations.
The second finding is that despite differences in levels, estimates of GDP growth from all four models have declined dramatically since February as more monthly and daily data are incorporated. For example, the dynamic factor model’s estimate declined from 6.4 percent on February 10 to 0.7 percent on March 30. The majority of this decline occurred on March 16, when new monthly data on retail sales, industrial production, and fixed asset investment were released. The small increase in the estimate on March 30 reflects the release of China’s official PMI data, which showed a small bounce back in March. Other models’ estimates show a similar pattern.
To derive a single estimate of Chinese GDP growth, we next average the three estimates from the monthly regression model, the diffusion index model, and the complete set regression model, which more heavily weight recent data. We exclude estimates from the dynamic factor model in our calculation because the model puts more weight on data before February. While historical data are useful in estimating current-quarter GDP growth in normal times, such data are less useful when economic growth has severely deviated from its normal path. The average of the three remaining estimates indicates a decline in the level of first-quarter GDP of 3.8 percent year-over-year or 28 percent quarter-over-quarter (annualized). When compared with a GDP level that is consistent with the 6 percent year-over-year growth rate in the second half of 2019, this estimate suggests the coronavirus pandemic may have reduced Chinese real GDP in the first quarter of 2020 by an annualized rate of 32 percent._
While this estimate is a credible gauge of the pandemic’s initial effects on Chinese GDP, as a reference for other countries it should be used with caution. The Chinese government implemented very strict quarantine policies at the beginning of the outbreak, and such measures will likely be more difficult to implement in other countries. As a result, the initial economic effect is likely to be smaller outside of China. However, the total economic effect will depend on how long it takes for the virus to be controlled. If the virus spreads wider and lasts longer in other countries than in China, the longer-term economic effects could be more severe. In this case, imposing strict social distancing policies might help reduce the virus’s total economic impact.
Endnotes
-
1 The variables selected here are from the same data set used in the other three models and thus are slightly different from Nie (2016).
-
2 The 24 variables used for the analysis are real GDP, the consumer confidence index, retail sales (for consumer goods), auto sales, industrial value added, purchasing managers index (PMI, Caixin and official), Caixin PMI: services, PMI: non-manufacturing, total fixed asset investment (FAI), FAI: manufacturing, FAI: infrastructure investment, complete investment in real estate development, land area purchased this year, floor space of buildings newly started, fiscal revenue, fiscal spending, monetary base (M2), exports, imports, the Keqiang index, coal consumption, traffic delay time, and nighttime satellite lights. Because our panel is monthly, we aggregate daily series into a monthly frequency. GDP comes in quarterly, so the first two months of a quarter have missing observations. The dynamic factor model fills these missing values, together with other missing values at the beginning or end of some series, with the best guess based on available data.
-
3 In theory, we can also use other methods to fill in the missing values for other three models. However, to make sure all models use the same underlying data, we force all four models to use the same balanced data produced by the dynamic factor model. Our monthly regression model uses data through March 2020.
-
4 We omit estimates between February 10 and March 2 because no relevant data were released between February 10 and February 28 (China combines most January and February data and releases them in March).
-
5 To calculate the decline, we first calculate the GDP level assuming Chinese GDP continues its trend growth in the second half of 2019 (6 percent). We then calculate the GDP level using our estimate (−3.8 percent). The 32 percent (annualized rate) decline refers to the gap between these two levels.
References
Bańbura, Marta, Domenico Giannone, Michele Modugno, and Lucrezia Reichlin. 2013. “External LinkNow-casting and the Real-Time Data Flow.” Handbook of Economic Forecasting, vol. 2, pt. A, pp. 195–237.
Bańbura, Marta, and Michele Modugno. 2014. “External LinkMaximum Likelihood Estimation of Factor Models on Datasets with Arbitrary Pattern of Missing Data.” Journal of Applied Econometrics, vol. 29, no. 1, pp. 133–160.
Elliott, Graham, Antonio Gargano, and Allan Timmermann. 2013. “External LinkComplete Subset Regressions.” Journal of Econometrics, vol. 177, no. 2, pp. 357–373.
Giannone, Domenico, Michele Lenza, and Giorgio E. Primiceri. 2018. “External LinkMacroeconomic Prediction with Big Data: The Illusion of Sparsity.” Federal Reserve Bank of New York, Staff Report No. 847, May.
Giannone, Domenico, Lucrezia Reichlin, and David Small. 2008. “External LinkNowcasting: The Real-Time Informational Content of Macroeconomic Data.” Journal of Monetary Economics, vol. 55, no. 4, pp. 665–676.
Henderson, J. Vernon, Adam Storeygard, and David N. Weil. 2012. “External LinkMeasuring Economic Growth from Outer Space.” American Economic Review, vol. 102, no. 2), pp. 994–1028.
Nie, Jun. 2016. “Gauging the Strength of Chinese GDP Growth.” Federal Reserve Bank of Kansas City, Macro Bulletin, February.
Stock, James H., and Mark W. Watson. 2002. “External LinkMacroeconomic Forecasting Using Diffusion Indexes.” Journal of Business & Economic Statistics, vol. 20, no. 2, pp. 147–162.
Yifei Lyu is an analyst at the New Zealand Treasury. Jun Nie is a senior economist at the Federal Reserve Bank of Kansas City. The views expressed are those of the authors and do not necessarily reflect the views of the New Zealand Treasury, the Federal Reserve Bank of Kansas City, or the Federal Reserve System.