When the pandemic-induced recession began 18 months ago, employment quickly plummeted. April and May 2020 produced some of the worst jobs numbers in U.S. and Oklahoma history. But a rapid economic recovery had Oklahoma’s headline labor market figures nearly at pre-COVID levels by summer 2021. Moreover, in July, more External Linkmanufacturers and External Linkservices firms in the Federal Reserve Bank of Kansas City’s Tenth District—which includes Oklahoma—reported worker shortages than at any time. This edition of The Oklahoma Economist seeks to identify the extent to which workers still are available in Oklahoma and show how firms are dealing with labor shortages.
Headline labor market data nearly back to Pre-COVID levels
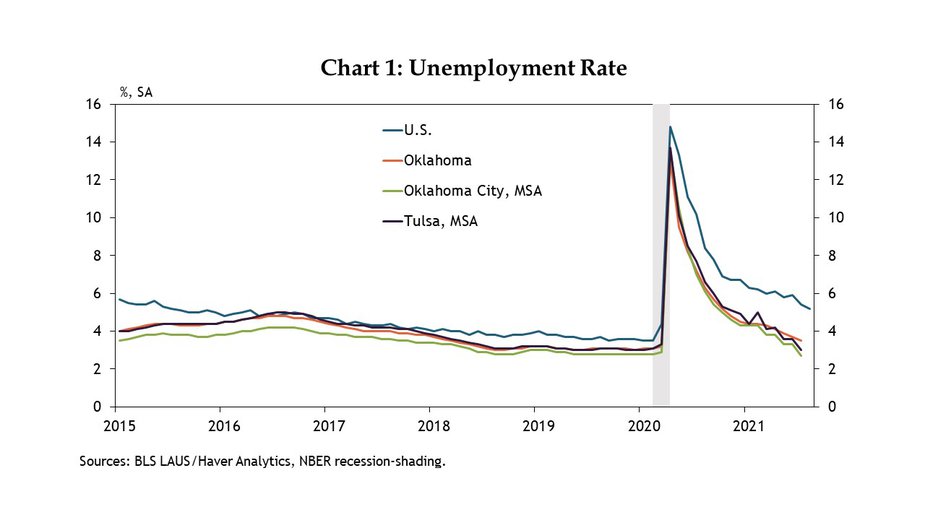
After rising into double digits in spring 2020, unemployment rates in Oklahoma have fallen steadily (Chart 1). The current unemployment rate in Oklahoma, 3.5%, is nearly back to the record lows of around 3% recorded pre-COVID, and the same is true in the state’s two large metro areas of Oklahoma City and Tulsa. Indeed, in July 2021 there were only about 7,600 more unemployed people in Oklahoma than in January 2020, compared with the more than 175,000 additional unemployed Oklahomans at the peak in April 2020._ By contrast, the U.S. unemployment rate of 5.7% in July remained more than 2 percentage points above its pre-COVID levels of around 3.5%.
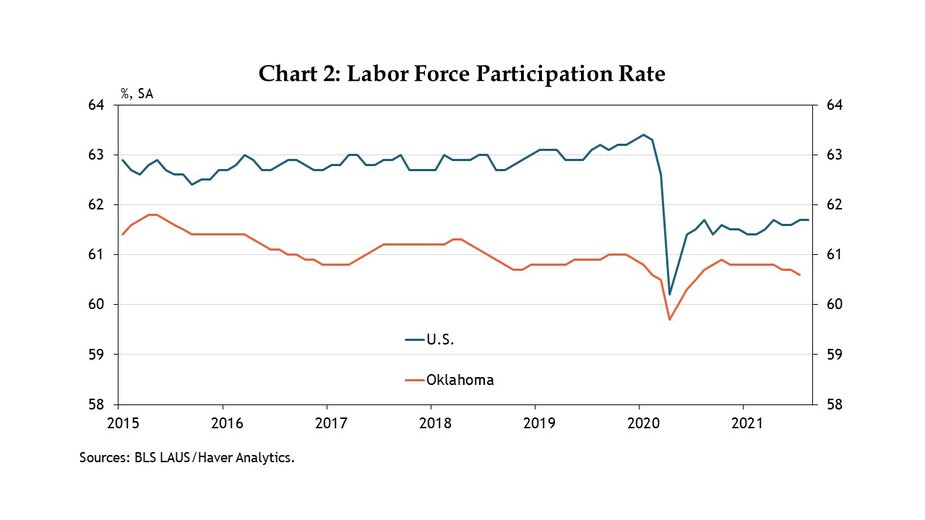
The unemployment rate alone, however, does not necessarily capture overall labor market conditions in the state, since it measures only the share of the workforce actively looking for work. Once someone stops looking for work, they no longer count as unemployed. As such, it is helpful to look at the labor force participation rate (LFPR) (Chart 2). This rate, which measures the share of the adult population that either is working or actively looking for work, currently is 60.6% in Oklahoma, only slightly lower than in January 2020 (60.8%). Again, this is in sharp contrast with the nation, where the LFPR remains 1.7 percentage points lower than pre-pandemic levels. This means not only are there considerably fewer unemployed workers in Oklahoma actively looking for work than in most other states, but there also are fewer people “on the sidelines” who have stopped looking for work.
Meanwhile, while Oklahoma’s unemployment rate and LFPR have returned nearly to pre-pandemic levels, the overall number of employed people in Oklahoma remains 4.5% lower than a year ago. This data from the Bureau of Labor Statistics (BLS) come from a survey of businesses rather than the survey of households that is used for the unemployment rate. Thus, at times, the two surveys can have slightly different results, and each can be revised in following years. One reason for the difference could be a drop in the number of Oklahomans working more than one job since the beginning of the pandemic. Such workers are not unemployed, but if they have left one of their previous jobs, this would translate to some businesses having fewer employees. Other reasons for the discrepancy of a tight labor market even as many jobs remain unfilled could be that former employed workers in Oklahoma have retired or moved to another state, and, thus, no longer are counted as unemployed in Oklahoma._
Who are the remaining unemployed workers?
Although the overall number of people unemployed or out of the workforce is much closer to pre-COVID levels in Oklahoma than in the nation, unemployment rates still vary widely by demographic, and some of these groups have recovered more than others. In particular, BLS Community Population Survey (CPS) data show that unemployment rates in Oklahoma vary by gender, race, age and education._
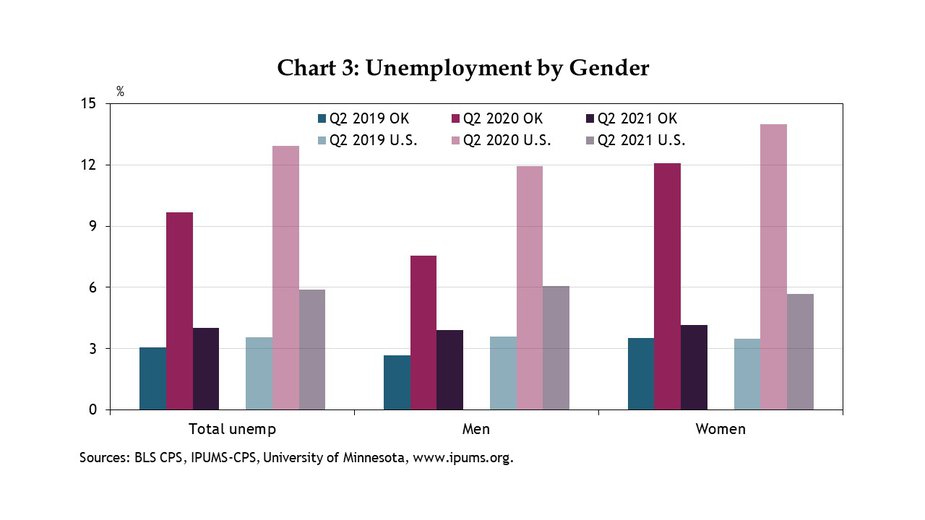
Through much of the pandemic, unemployment rates by gender have varied sharply. In both the nation and Oklahoma, unemployment rose much more among women than men, due to occupational differences and likely also a lack of in-person school and childcare at the onset of the pandemic._ Chart 3 shows that Oklahoma’s unemployment rate for women exceeded that of men by more than 4% during the second quarter of 2020, considerably more even than in the nation as a whole. However, by the second quarter of 2021, unemployment of women in Oklahoma had recovered considerably, with an average rate of 4.1%. Although that rate remains slightly higher than that for men, it now actually is closer to the second quarter 2019 level than Oklahoma’s unemployment rate for men.
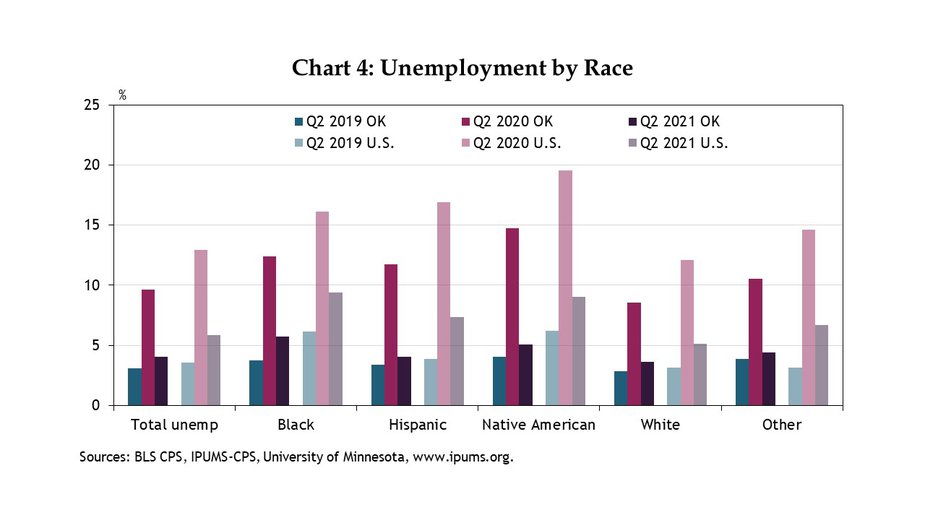
Unemployment rates also varied by racial category, and like the rest of the United States, pandemic unemployment was higher and considerably worse for non-white people in Oklahoma (Chart 4). By the second quarter of 2021, unemployment rates had improved in Oklahoma and the U.S., but pre-existing differences in unemployment rates by race persisted, and, in some cases, worsened. Black and Native American unemployment rates had not recovered as much as Hispanic or white unemployment rates in the state by the second quarter of 2021.
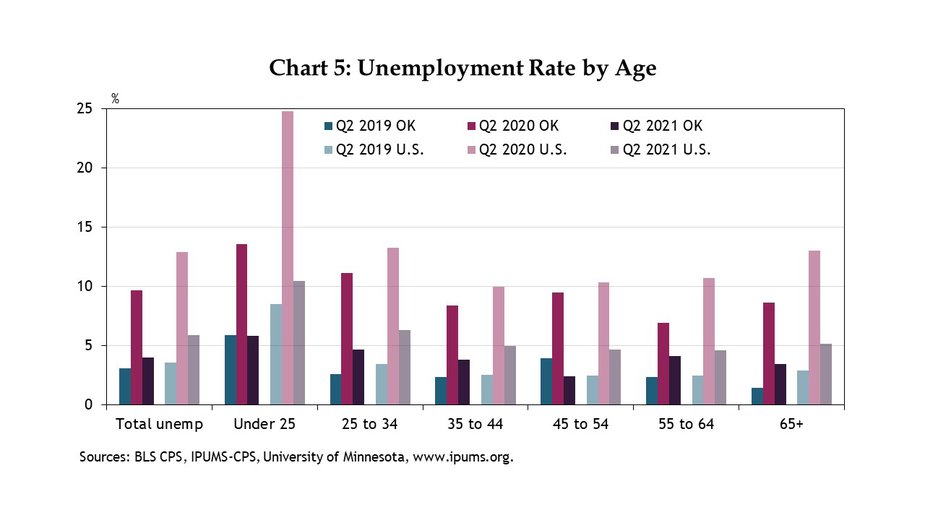
Looking at differences in unemployment rates by age, most age groups in Oklahoma and the nation continued to have higher rates than in 2019, although in all cases Oklahoma’s rate was lower than the nation’s in the second quarter of 2021 (Chart 5). The unemployment rate for ages 16-25 in Oklahoma, however, is back to pre-COVID levels, and Oklahoma’s unemployment rate for those 45-54 now is lower than pre-COVID levels. Unemployment among those 35-44 also is up less in Oklahoma than in the nation, compared with pre-pandemic. The tighter labor force for younger workers and for those 35-44 and, especially those 45-54, indicates that these workers could be even more difficult to hire than normal.
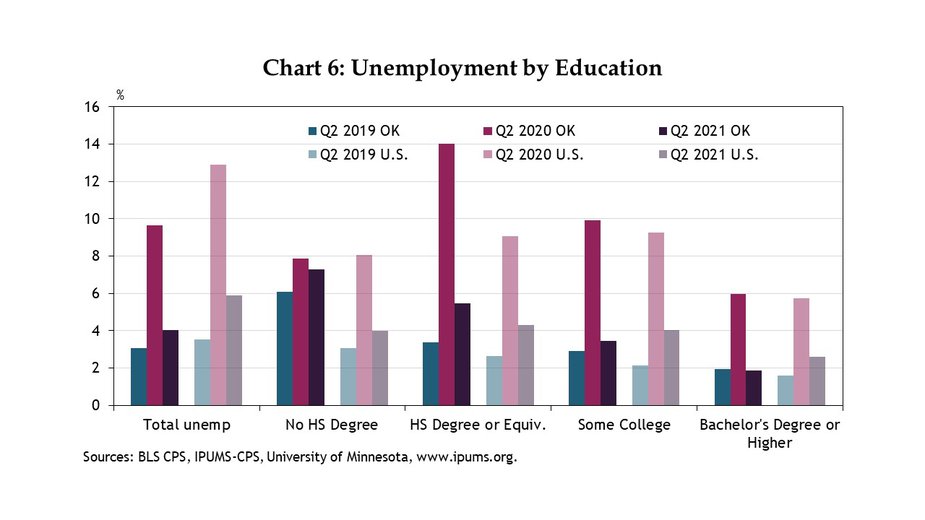
The number of unemployed workers also varies by education level. Data suggest that Oklahoma businesses looking to hire those with a bachelor’s degree or advanced degree in particular will have a harder time than usual, as unemployment for this group now is even lower than in 2019 (Chart 6). Oklahoma workers with some college also have a lower unemployment rate than in the nation. In contrast, the highest unemployment rate in Oklahoma is for those without a high school degree. Those with a high school diploma or equivalent also experience higher joblessness in Oklahoma than in the rest of the country. The ratio of those without jobs and looking for work with a high school diploma vs. with a college degree is 3 to 2 in the U.S. compared with 3 to 1 in Oklahoma.
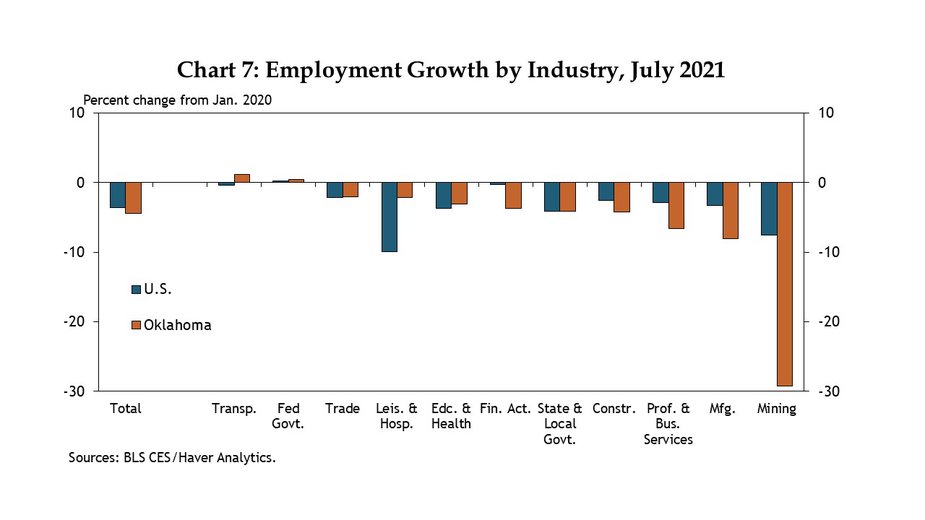
One reason for the state’s higher than usual unemployment rate among less-educated workers may be the significant job losses suffered in the energy industry, which does not require post-secondary education for many relatively high-paying jobs. Through July 2021, employment in the mining sector (consisting almost completely of oil and gas in Oklahoma) still was down 30% from pre-pandemic, much more than in any other industry (Chart 7).
Why aren’t more people looking for jobs?
Despite its recent improvement, labor force participation in Oklahoma remains lower than in the nation and has been consistently lower for decades. For example, from 2015 to 2019 about 1.5% fewer Oklahomans, on average, participated in the labor force than in the country as a whole (Chart 2)._ CPS data asks working age people who are not in the labor force but want a job about their main reason for not looking for work in the last four weeks._ Those who are out of the labor force and do not want a job (such as those in retirement, serving as a homemaker, etc.) would be excluded from this question. A third of respondents reported “other,” but Chart 8 reveals how the rest of respondents answered over the course of late 2020 and early 2021 relative to pre-COVID.
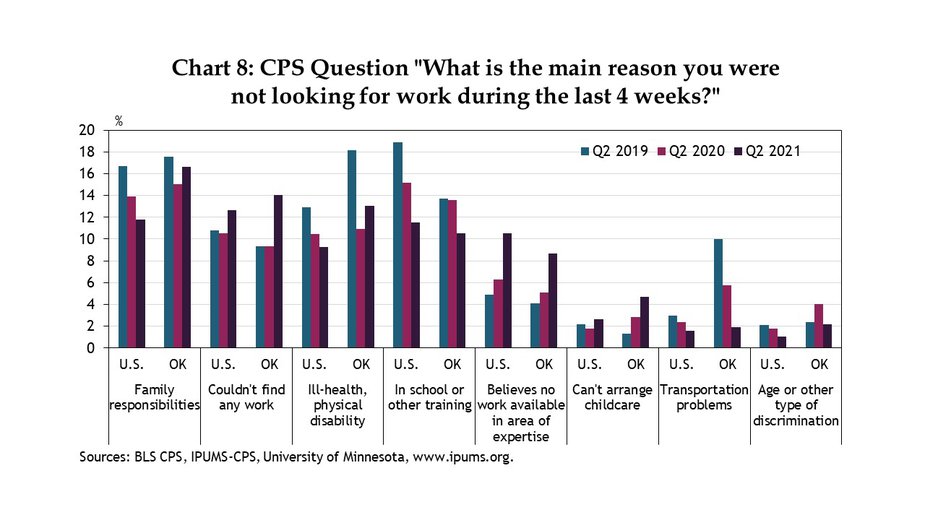
In Oklahoma, the primary deterrents to applying for work over the past year have been family responsibilities, inability to find work, and ill-health or disability. In each case, the share of Oklahomans reporting these reasons was higher than in the nation. More Oklahomans also reported difficulty arranging childcare and discrimination. Meanwhile, fewer Oklahomans thought there was no work available in their area of expertise or reported being in school or training as primary drivers keeping them from applying compared with the rest of the nation.
Also, while unemployment in Oklahoma is much lower compared with the rest of the country, the ratio of unemployed people in Oklahoma to the number of people receiving unemployment benefits is higher than in previous recessions, when there were fewer applications for unemployment. Unemployment insurance and the associated External Linkbenefits cliff look different in Oklahoma than other places due to a lower cost of living. The benefits cliff refers to a level of income at which workers rationally choose not to work rather than make less money than would be available through a variety of government benefits. Still, those individuals who are not in the labor force (not actively looking for work) are ineligible to receive unemployment benefits and also are excluded from being counted as unemployed. While some have voluntarily left the labor force to retire or no longer are looking for jobs, the number of those out of the labor force in Oklahoma is only slightly higher than pre-COVID.
How are firms dealing with worker shortages?
With continued growth in the regional economy and Oklahoma’s headline labor market indicators nearly back to pre-pandemic levels, the shortage of available workers in the state appears likely to persist. This is consistent with a special question in the Kansas City Fed’s latest monthly External Linkmanufacturing and External Linkservices surveys, in which over half of firms reported a decline in the number of applicants per available job in recent months and only about 15% had seen an increase in applications. Other firms experienced either no change or had no new job openings.
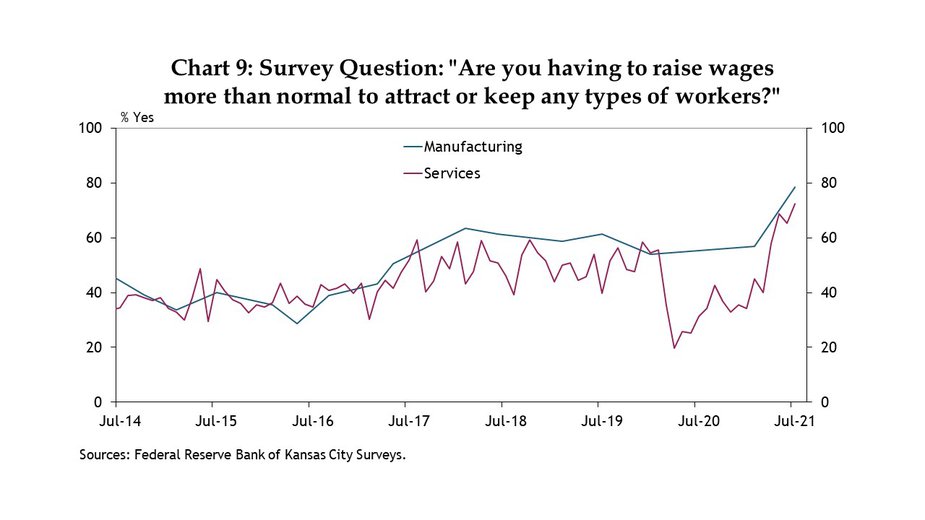
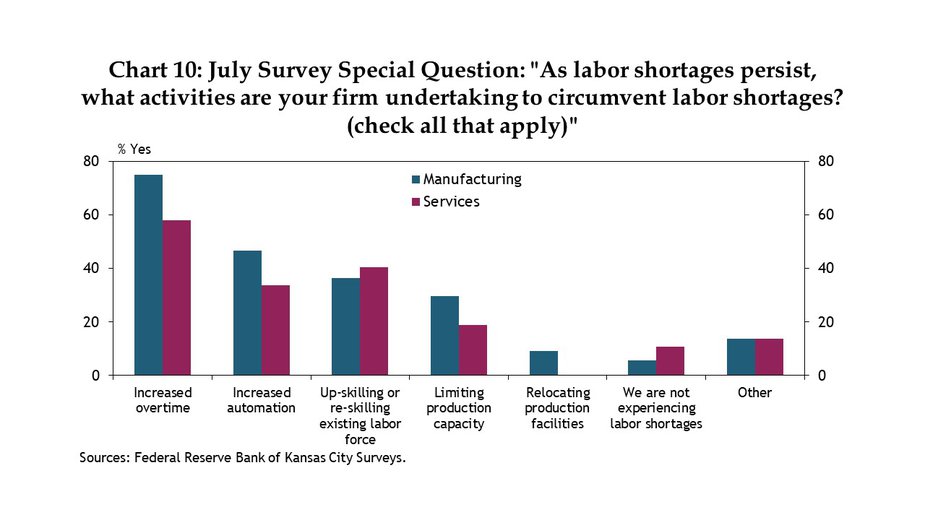
As such, many firms are making adjustments to their operations. For example, more firms in the Kansas City Fed’s region reported above normal wage pressures in July than at any previous time (Chart 9). Many firms also reported increasing overtime, working to up-skill or reskill their existing workforce, and in some cases limiting their production capacity (Chart 10). Over 40% of manufacturers also were investing in labor-saving automation at a faster pace than in the past, and many services firms—whose tasks often are harder to automate—also were trying to reduce the future need for workers.
Summary
In conclusion, Oklahoma appears to have a much smaller share of workers on the sidelines than the country as a whole. Both the unemployment rate and the LFPR have returned nearly to pre-pandemic levels. Labor market data suggest the tightest markets are among those with college degrees, as well as those under 25 and those 45-54. As business continues to pick up, firms have increased wages and overtime to help fill the gap, and more also have invested in labor-saving technology. Firms also are working to reskill their workforces, but this, like automation, takes time. Survey data also show that some additional Oklahomans who are not in the labor force want jobs and are facing challenges that keep them from looking for work, such as family responsibilities or health issues. Addressing these and other long-term labor force participation trends in Oklahoma may require creative training opportunities and policy approaches in addition to traditional recruitment efforts.
Endnotes
- 1
- 2
-
3
Analyzing microdata from the CPS allows for a more granular look at the direction of unemployment rates compared to the standard larger-sample BLS Local Area Unemployment Statistics (LAUS) used in the previous section. Sample size differences require more weighting of CPS data than LAUS measures, and thus exact point estimates should be viewed with caution, but the CPS data can be tabulated to give a general picture of recent unemployment rates in Oklahoma by demographic.
- 4
-
5
According to the BLS, those “out of the labor force” does not include employed workers or unemployed workers who can receive benefits and are actively seeking work.
- 6
