The share of the U.S. population (age 16 and above) who are retired increased rapidly at the beginning of the COVID-19 pandemic. Chart 1 shows that the retirement share rose 1.3 percentage points from February 2020 to June 2021, with the majority of the increase occurring in the first few months of the pandemic. This increase has substantially outpaced the share’s 0.3 percentage point average annual increase from 2010 to 2020. If the retirement share had risen at its 2010–20 pace, the number of retirees would have increased by 1.5 million during the pandemic. Instead, the number of retirees increased by 3.6 million.
Chart 1: The Share of Retirees in the U.S. Population Spiked during the Pandemic
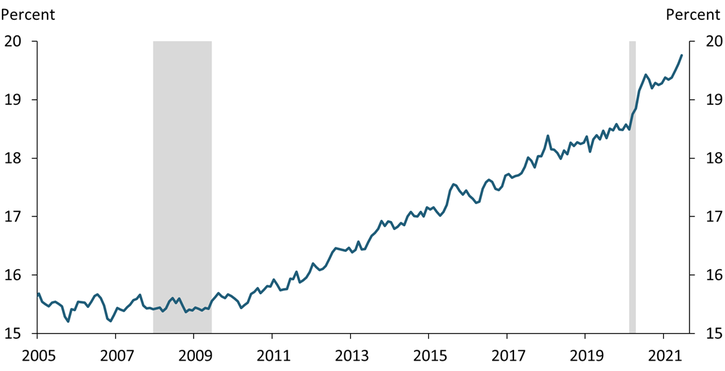
Note: Gray bars denote National Bureau of Economic Research (NBER)-defined recessions.
Sources: U.S. Census Bureau, NBER, and authors’ calculations.
Retirement is often thought of as a permanent shift in an individual's employment status, and an increase in the retirement share typically indicates an increase in the number of employed people transitioning to retirement. However, we find that the current increase has mainly been driven by a decline in the number of retirees rejoining the labor force. Chart 2 presents monthly transition rates between retirement, employment, and unemployment from January 2015 to June 2021 based on data from the U.S. Census Bureau’s Current Population Survey (CPS). The blue line shows that the transition rate from employment to retirement did not accelerate during the pandemic and stayed around 0.6 percent, meaning about 0.6 percent of employed people retired every month._ Similarly, the green line shows that the transition rate from retirement to unemployment—covering the share of retirees who have started to look for work but are not yet employed—has remained relatively stable over the entire 2018–21 period. In contrast, the orange line shows that the transition rate from retirement to employment declined sharply at the beginning of the pandemic, falling from an average pace of 1.9 percent in the first two months of 2020 to 1 percent in April 2020 before recovering to around 1.4 percent more recently. Finally, the purple line shows that the transition rate from unemployment to retirement also dropped sharply during the pandemic. However, the number of unemployed people is much smaller than the total number of retirees, so the decline in the unemployment-to-retirement rate has less influence on the overall retirement share than the decline in the retirement-to-employment rate._ Overall, these changes in transition rates highlight that the recent increase in the retirement share has been driven by a steep decline in the percentage of retirees returning to work.
Chart 2: The Share of Retirees Rejoining the Labor Force Declined Precipitously during the Pandemic
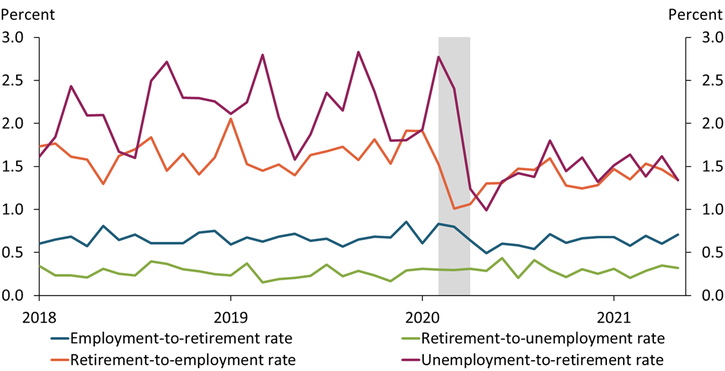
Note: Gray bar denotes NBER-defined recession.
Sources: U.S. Census Bureau, NBER, and authors’ calculations.
The decline in the percentage of retirees rejoining the labor force could be temporary for two reasons. First, the retirement-to-employment transition rate did not plummet during the 2007–09 recession, suggesting the current decline is unique to the pandemic (and thus likely to recover when the pandemic ends). Indeed, Chart 3 shows that all four transition rates remained relatively stable during the 2007–09 recession. One natural explanation for the recent decline in the retirement-to-employment transition rate is pandemic-related health concerns. Given the risk of being infected at work, some retirees who might have otherwise rejoined the workforce may have postponed these plans. As vaccinations continue to increase and health risks fade, more retirees will likely transition to employment.
Chart 3: Labor Force Transition Rates Were Stable during the 2007–09 Recession
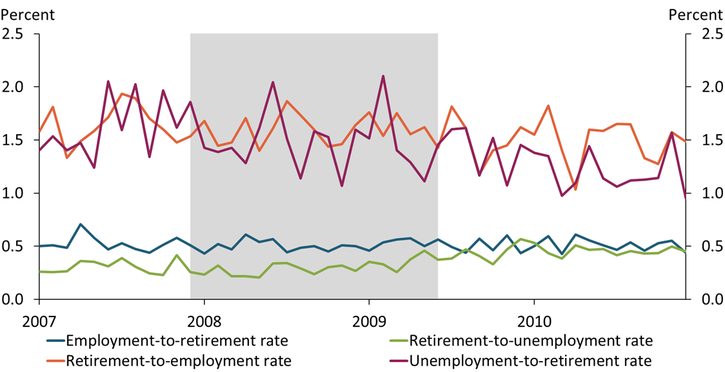
Note: Gray bar denotes NBER-defined recession.
Sources: U.S. Census Bureau, NBER, and authors’ calculations.
Second, the recent increase in the retirement share includes people across a wide range of ages, suggesting many of those who postponed their plans to rejoin the labor force still have time to do so when the pandemic ends. Chart 4 shows that the increase in the number of retirees since February 2020 includes 0.7 million people younger than 60, 0.5 million people age 60 to 67, and 1.6 million people age 68 to 75. Many of these people are still young enough to reenter the labor market if the pandemic abates in the near term.
Chart 4: Many Retirees Are Young Enough to Return to Work when the Pandemic Ends
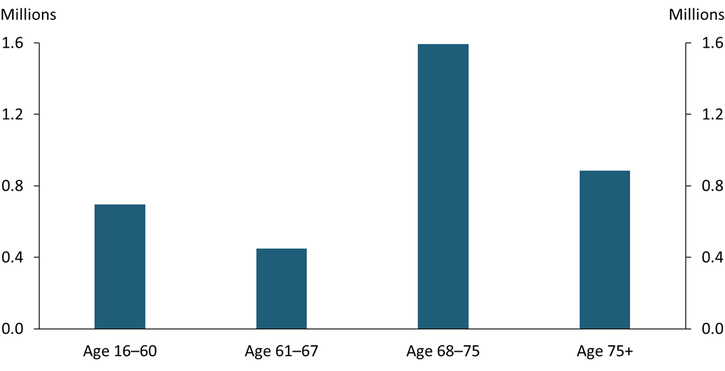
Sources: U.S. Census Bureau and authors’ calculations.
In sum, we find evidence that the recent increase in retirement since the beginning of the pandemic has mainly been driven by a decline in the number of people transitioning from retirement back to employment, rather than an increase in the number of people transitioning from employment to retirement. Pandemic-related health concerns may help explain this decline, as these dynamics were not observed during the 2007–09 recession. As such, some of these retirees may consider rejoining the labor force if the health risks of the pandemic decline in the near future. Nonetheless, the retirement share may not return to its previous trend or some time. Even if monthly transitions from retirement to employment return to their average pace in 2018–19, it will take more than two years to fully unwind the recent increase in the retirement share._
Download Materials
Data File. (Updated through April 2024)
Endnotes
-
1 To calculate the transition rates, we match individuals in the CPS in two consecutive months following the procedure in Nekarda (2009) and Shimer (2012). These transition rates describe the ratio of the number of people transitioning retirement states between two months to total matched observations for the original state in the two months. For example, the retirement-to-employment transition rate from March to April is calculated as the ratio of the number of people transitioning from retirement to employment to the total number of retired people in March that can be matched in April. Note that the rotation structure of the CPS design suggests that 25 percent of observations will be lost in this matching process, which is why we only include total matched observations in calculating the transition rates.
-
2 The number of unemployed people was about 13 percent of the number of retired people in February 2020. This ratio rose to a level above 40 percent in April before quickly declining to a level of around 20 percent. The steep increase in the unemployment level from February to April 2020 largely explains the concurrent decline in the unemployment-to-retirement transition rate shown in Chart 2, as the unemployment rate rose from 3.5 percent in February 2020 to 14.8 percent in April 2020.
-
3 This calculation assumes monthly retirement-to-employment transitions increase from the average level seen from February 2020 to June 2021 to the average level seen from January 2018 to February 2020, while all other transitions are held unchanged. Under this assumption, it will take about 28 months to reduce the retirement level by 2.1 million, which is the extra increase (relative to its normal trend) since the beginning of the pandemic.
References
Nekarda, Christopher J. 2009. “External LinkA Longitudinal Analysis of the Current Population Survey: Assessing the Cyclical Bias of Geographic Mobility.” May.
Shimer, Robert. 2012. “External LinkReassessing the Ins and Outs of Unemployment.” Review of Economic Dynamics, vol. 15, no. 2, pp. 127–148.
Jun Nie is a senior economist at the Federal Reserve Bank of Kansas City. Shu-Kuei X. Yang is a data engineer at the bank. The views expressed are those of the authors and do not necessarily reflect the positions of the Federal Reserve Bank of Kansas City or the Federal Reserve System.