Farm real estate debt continued to climb and led to a notable increase in agricultural loan balances at commercial banks. The pace of farm loan growth increased further in the third quarter and was faster among agricultural banks than those with less concentrated agricultural lending portfolios. Despite the increases in loan balances, farm finances remained strong and delinquency rates on agricultural loans reached an all-time low. As interest rates edged higher, increases in both agricultural and non-agricultural lending also supported earnings for farm lenders.
The outlook for the agricultural economy through the end of 2022 was generally positive, but some pressures remained looking ahead to next year. Profit opportunities for most producers across the sector remained favorable and continued to support farm finances. Agricultural credit conditions also remained strong, but improvement has been more measured in recent months alongside the pressures associated with uncertainty about commodity prices, intense drought and higher expenses. Despite some notable risks, farm finances remained bolstered by strong incomes in recent years and sharp growth in farm real estate values.
Third Quarter Commercial Bank Call Report Data
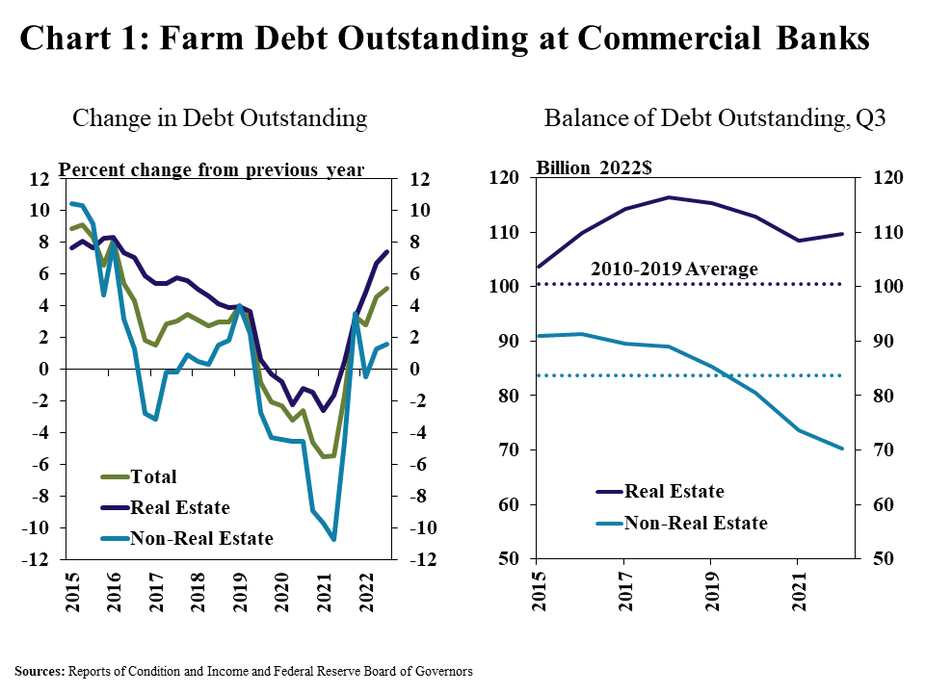
Growth in farm real estate loans picked up in the third quarter while increases in production lending remained more measured. Real estate and non-real estate loans grew about 7% and 2% from a year ago, respectively (Chart 1). Adjusting for inflation, farmland lending remained above the recent average and ticked up after declining slightly in recent years, while production lending remained subdued.
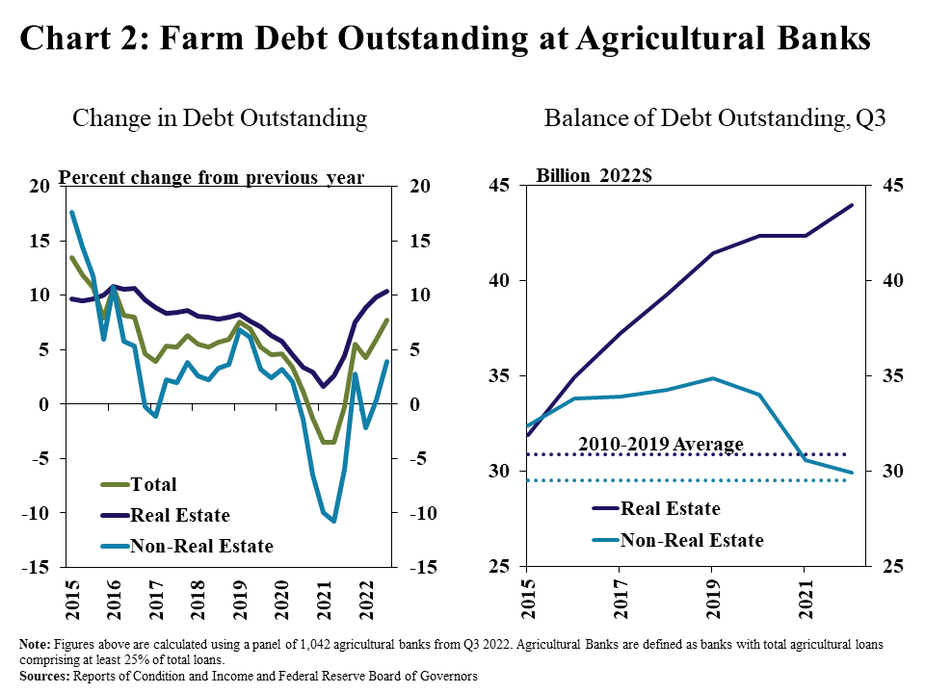
Considerable growth in farm real estate lending drove a faster pace of growth in lending among agricultural banks. Real estate and non-real estate loan balances at agricultural banks in the third quarter were 10% and 4% higher than a year ago, respectively (Chart 2). The quick rise in farmland lending pushed real estate loan balances at those banks to historically high levels and production loans continued to move towards the recent average.
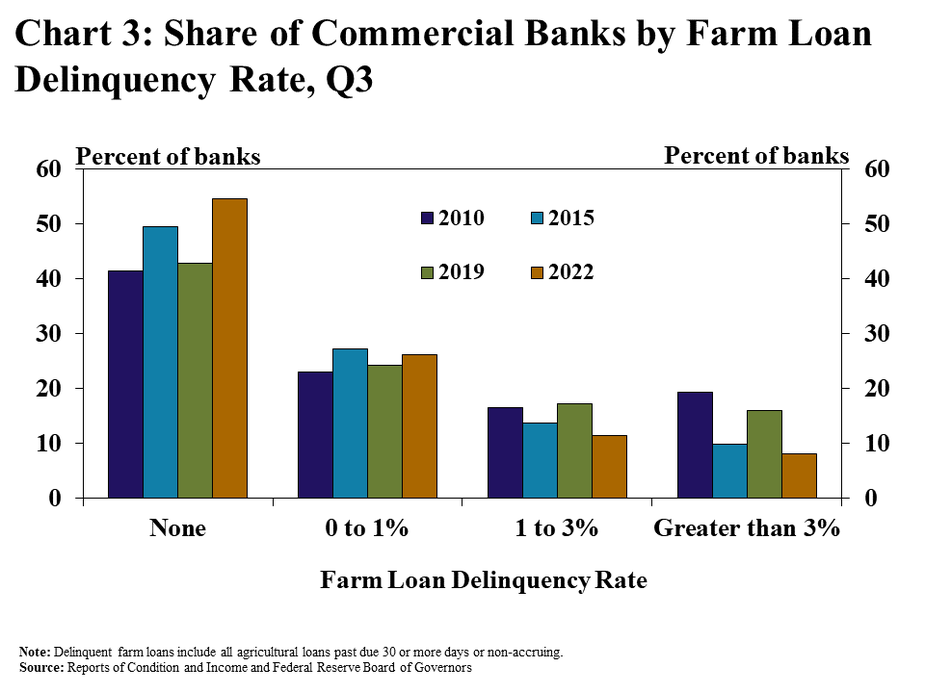
Farm loan performance continued to strengthen steadily, and improvement has been broad. In fact, farm loan delinquency rates were less than 1% in about 80% of commercial banks with agricultural loans, and about half of all lenders reported no past dues (Chart 3). Moreover, less than 10% of commercial banks reported farm loan delinquencies greater than 3%, which was the lowest share on record.
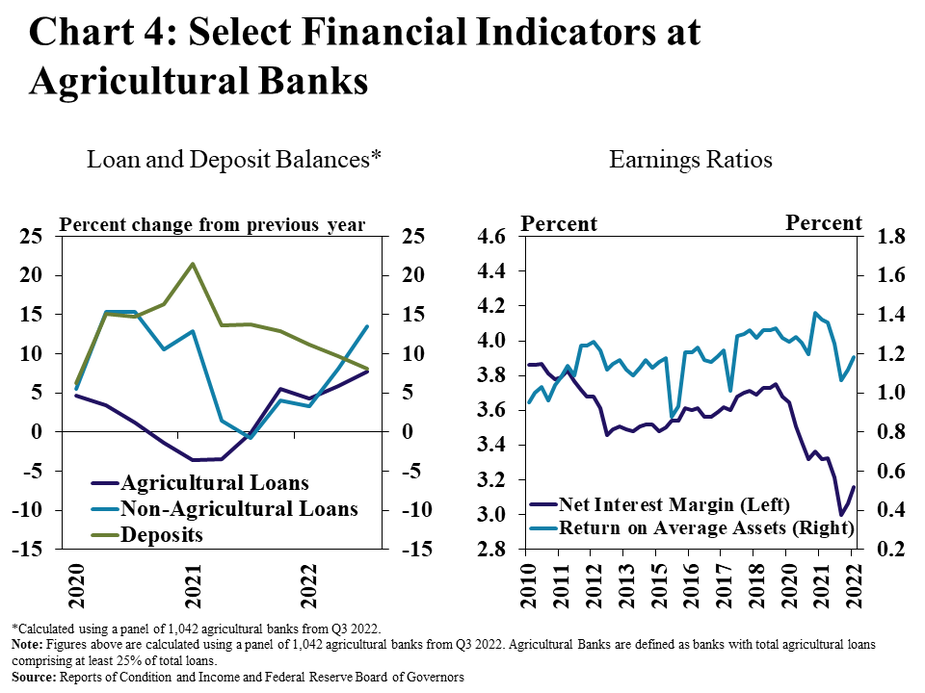
Earnings also continued to improve alongside higher interest rates and loan growth. Liquidity at agricultural banks remained strong, but total loan growth outpaced deposit growth for the first time since 2019 as loan balances, particularly non-agricultural loans; rose considerably (Chart 4, left panel). Lending has grown alongside a sharp rise in interest rates, supporting an increase in the net interest margin and return on assets at agricultural banks for the second consecutive quarter (Chart 4, right panel).
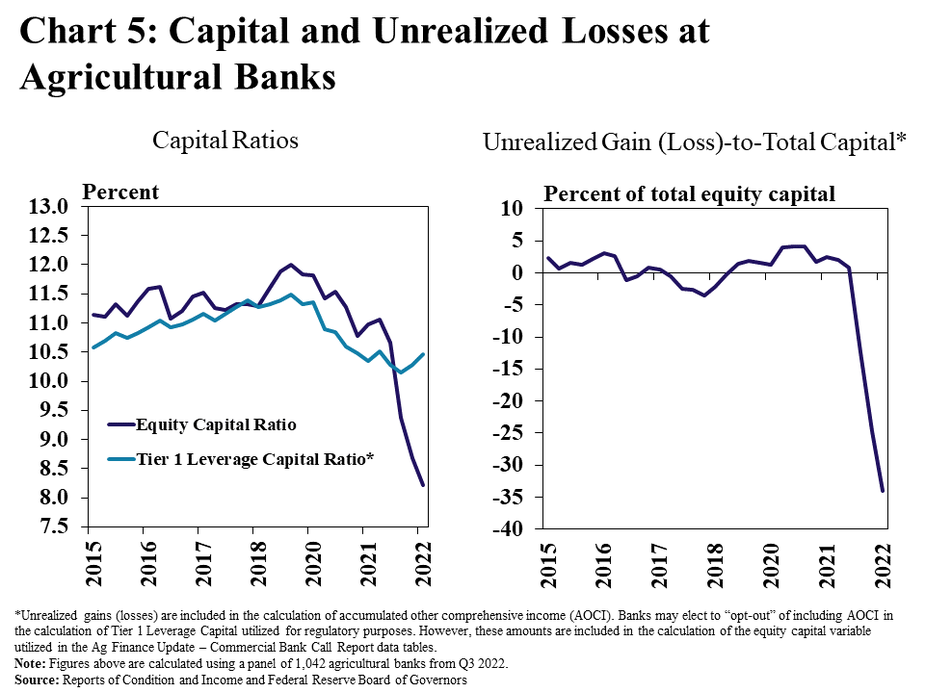
Strong liquidity and credit conditions provided a firm buffer, but unrealized losses continued to pressure some measures of capital. The Tier 1 Leverage Capital Ratio at agricultural banks increased slightly alongside higher earnings, but substantial unrealized losses continued to push the equity capital ratio lower (Chart 5). Losses attributed to holdings of investment securities totaled nearly 35% of equity capital for farm lenders, however, ample liquidity and strong loan performance appeared likely to prevent most banks from having to sell securities and formally realize those losses.
Data and Information
Commercial Bank Call Report Historical Data
Commercial Bank Call Report Data Tables
About the Commercial Bank Call Report Data
The views expressed are those of the authors and do not necessarily reflect the positions of the Federal Reserve Bank of Kansas City or the Federal Reserve System.
Authors

Nate Kauffman
Senior Vice President, Economist, and Omaha Branch Executive; Executive Director of the Center for Agriculture and the Economy
