Interest rates on farm loans increased sharply in the third quarter. Despite the higher borrowing costs, farm real estate values continued to increase, but the acceleration eased somewhat. Following consistently higher increases earlier in 2022, the value of farmland in most Districts grew at a slightly slower pace in the third quarter. Farm income and credit conditions also remained strong, but improvement was more limited. With higher production expenses, broad inflation and an uptick in financing costs, growth in household spending by farm borrowers began to outpace capital spending more noticeably.

Strength in farm finances continued to support a generally positive outlook for agricultural credit conditions through the remainder of 2022, but some pressures have continued to intensify. Volatility in crop markets, higher expenses and drought are key risks, but profit opportunities remained favorable alongside strong commodity prices. Despite more measured improvement in recent quarters, farm finances remained solid following especially strong incomes across the sector the past two years.

Third Quarter Federal Reserve District Ag Credit Surveys

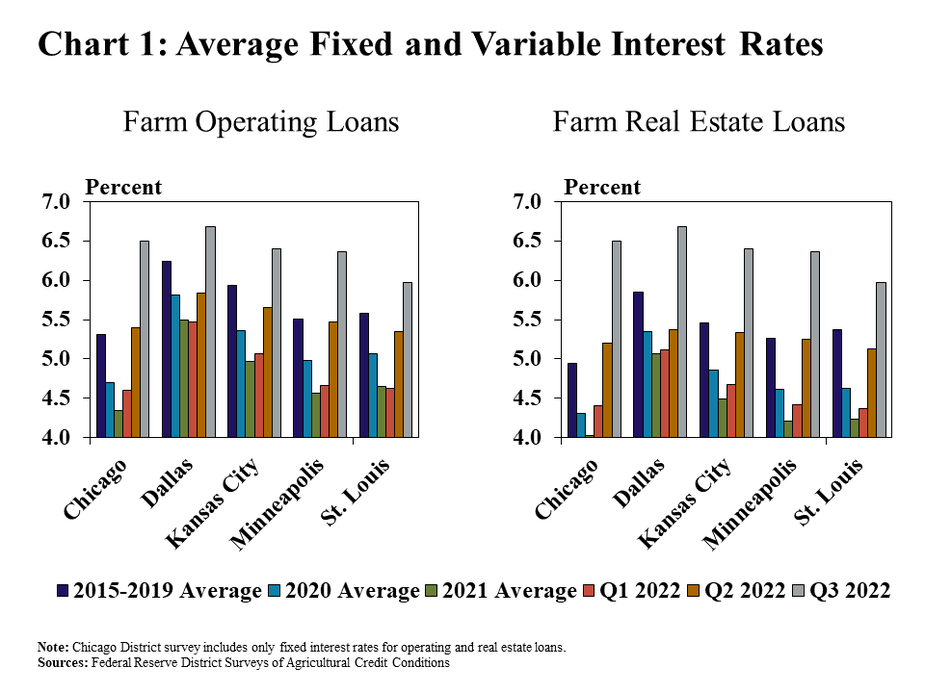
Farm loan interest rates rose rapidly in the third quarter alongside increases in benchmark interest rates. The typical rate charged on farm operating and real estate loans across all Districts administering a survey of ag credit conditions increased by an average of 85 and 110 basis points from last quarter, respectively (Chart 1). The quick rise pushed financing rates above the average from 2015-2019 in all regions.

Chart 1: Average Fixed and Variable Interest Rates - includes two individual charts. Left, Farm Operating Loans: is a clustered column chart showing the average interest rate on farm operating loans for the Chicago, Dallas, Kansas City, Minneapolis and St. Louis Districts. Each of the Districts includes columns for 2015-2019 Average, 2020 Average, 2021 Average, Q1 2022, Q2 2022 and Q3 2022. Right, Farm Real Estate Loans: is a clustered column chart showing the average interest rate on farm real estate loans for the Chicago, Dallas, Kansas City, Minneapolis and St. Louis Districts. Each of the Districts includes columns for 2015-2019 Average, 2020 Average, 2021 Average, Q1 2022, Q2 2022 and Q3 2022. Sources: Federal Reserve District Surveys of Agricultural Credit Conditions.

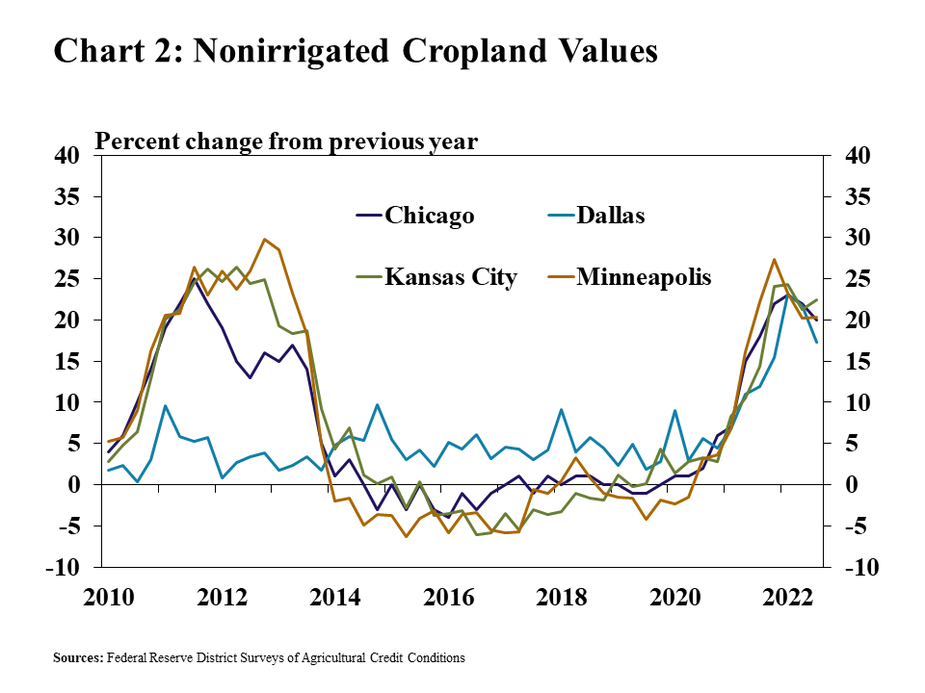
Farmland values increased further in the third quarter despite the recent increases in interest rates, but at a slower pace than the rapid gains a year ago. The value of nonirrigated cropland was an average of 20% higher than the same time a year ago across all Districts, which was the slowest pace of growth since early 2021 (Chart 2). Demand for farmland has remained strong alongside broad strength in the farm economy, but the acceleration in values over the past year has shown signs of easing in recent quarters.

Chart 2: Nonirrigated Cropland Values - is a line chart showing the percent change in nonirrigated cropland values from the previous year for the Chicago, Dallas, Kansas City and Minneapolis Districts in every quarter from Q1 2010 to Q3 2022.  Sources: Federal Reserve District Surveys of Agricultural Credit Conditions.

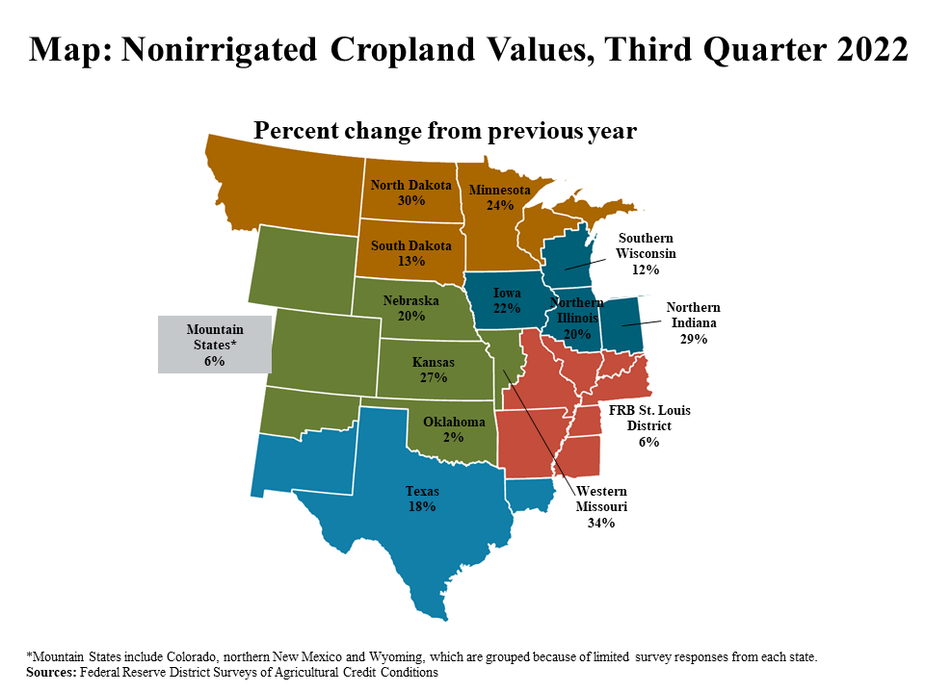
The rise in farmland values over the past year has been notable across nearly all states. The value of nonirrigated cropland grew by at least 20% in the majority of states, but increased at a comparatively slower rate in some areas (Map). Gains were generally highest in areas with the highest quality farmland, while values in Oklahoma increased only slightly as conditions in the state have diverged from most others.

Map: Nonirrigated Cropland Values, Third Quarter 2022 - is a map showing the percent change in nonirrigated cropland values from the previous in Q3 2022 for the following individual states from north to south: North Dakota, Minnesota, South Dakota, Southern Wisconsin, Nebraska, Iowa, Northern Illinois, Norther Indiana, Mountain States*, Kansas, Western Missouri, FRB St. Louis District, Oklahoma and Texas.   *Mountain States include Colorado, northern New Mexico and Wyoming, which are grouped because of limited survey responses from each state. Sources: Federal Reserve District Surveys of Agricultural Credit Conditions

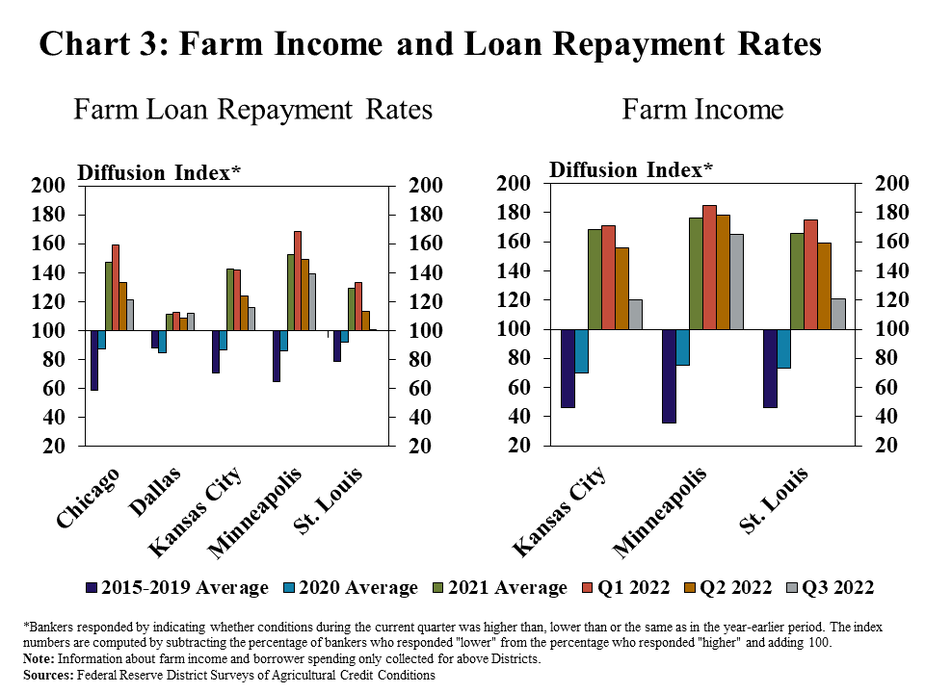
Credit conditions remained strong, but the pace of improvement has slowed alongside sharp increases in interest rates and a rise in production expenses. Farm loan repayment rates increased at the slowest pace since early 2020 in all Districts except Dallas (Chart 3). Similarly, the pace of increase in farm income also was the slowest in two years in all reporting Districts.

Chart 3: Farm Income and Loan Repayment Rates - includes two individual charts. Left, Farm Loan Repayment Rates: is a clustered column chart showing the diffusion index* of farm loan repayment rates for the Chicago, Dallas, Kansas City, Minneapolis and St. Louis Districts. Each of the Districts includes columns for 2015-2019 Average, 2020 Average, 2021 Average, Q1 2022, Q2 2022 and Q3 2022. Right, Farm Income: is a clustered column chart showing the diffusion index* of farm income for the Kansas City, Minneapolis and St. Louis Districts. Each of the Districts includes columns for 2015-2019 Average, 2020 Average, 2021 Average, Q1 2022, Q2 2022 and Q3 2022.  *Bankers responded by indicating whether conditions during the current quarter was higher than, lower than or the same as in the year-earlier period. The index numbers are computed by subtracting the percentage of bankers who responded "lower" from the percentage who responded "higher" and adding 100. Note: Information about farm income and spending is only collected in surveys for the above Districts. Sources: Federal Reserve District Surveys of Agricultural Credit Conditions.

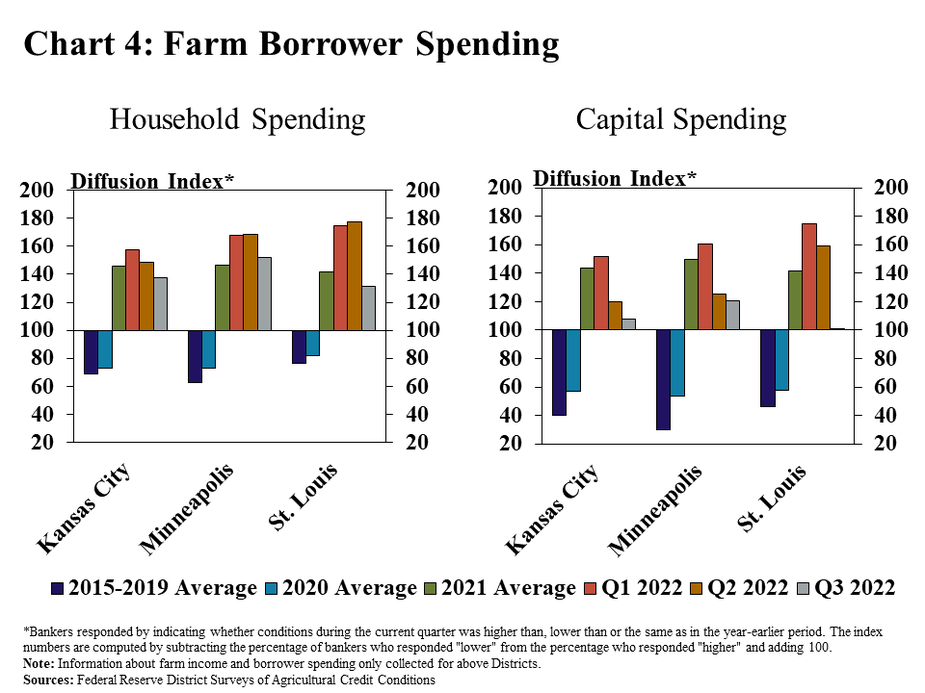
Household spending rose more steadily than capital spending alongside broad inflationary pressures and higher financing costs. The pace of increase in household spending across participating Districts was only modestly slower than the average over the past year (Chart 4, left panel). In contrast, the pace of increase in capital spending slowed notably from recent quarters (Chart 4, right panel).

Chart 4: Farm Borrower Spending - includes two individual charts. Left, Household Spending: is a clustered column chart showing the diffusion index* of farm borrower household spending for the Kansas City, Minneapolis and St. Louis Districts. Each of the Districts includes columns for 2015-2019 Average, 2020 Average, 2021 Average, Q1 2022, Q2 2022 and Q3 2022. Right, Capital Spending: is a clustered column chart showing the diffusion index* of farm borrower capital spending for the Kansas City, Minneapolis and St. Louis Districts. Each of the Districts includes columns for 2015-2019 Average, 2020 Average, 2021 Average, Q1 2022, Q2 2022 and Q3 2022.  *Bankers responded by indicating whether conditions during the current quarter was higher than, lower than or the same as in the year-earlier period. The index numbers are computed by subtracting the percentage of bankers who responded "lower" from the percentage who responded "higher" and adding 100. Note: Information about farm income and borrower spending only collected for above Districts. Sources: Federal Reserve District Surveys of Agricultural Credit Conditions

Data and Information

Excel SpreadsheetFederal Reserve Ag Credit Surveys Historical Data
Excel SpreadsheetFederal Reserve Ag Credit Surveys Tables
txtAbout the Federal Reserve Ag Credit Surveys

The views expressed are those of the authors and do not necessarily reflect the positions of the Federal Reserve Bank of Kansas City or the Federal Reserve System.

Authors

Nate Kauffman

Senior Vice President, Economist, and Omaha Branch Executive

Nate Kauffman is Senior Vice President and Omaha Branch Executive at the Federal Reserve Bank of Kansas City. In his role as the Kansas City Fed's lead economist and represe…

Ty Kreitman

Associate Economist

Ty Kreitman is an associate economist in the Regional Affairs Department at the Omaha Branch of the Federal Reserve Bank of Kansas City. In this role, he primarily supports the F…