Farmland values in the Midwest and Plains states increased slightly in the first quarter of 2026. Lenders throughout Federal Reserve Districts participating in the Survey of Agricultural Credit Conditions reported that on average, nonirrigated cropland values were about 3% higher than a year ago. Land values remained near record levels in most regions despite ongoing challenges in the crop sector that contributed to further tightening in farm finances and gradual deterioration in credit conditions. While many farms continued to face headwinds such as higher input costs, and severe drought; government payments and remarkably strong cattle revenues have provided broad support to the sector and continued to help keep aggregate financial stress limited.
First Quarter Federal Reserve District Ag Credit Surveys
Average farmland values remained strong across all participating Districts. The average value of nonirrigated cropland increased slightly from a year ago in the Dallas, Chicago, and Kansas City regions and was close to unchanged in the Minneapolis District (Chart 1). The average values of all types of agricultural land remained near record highs and strength in cattle prices supported sharp growth of ranchland values in some areas.
Chart 1: Nonirrigated Cropland Values
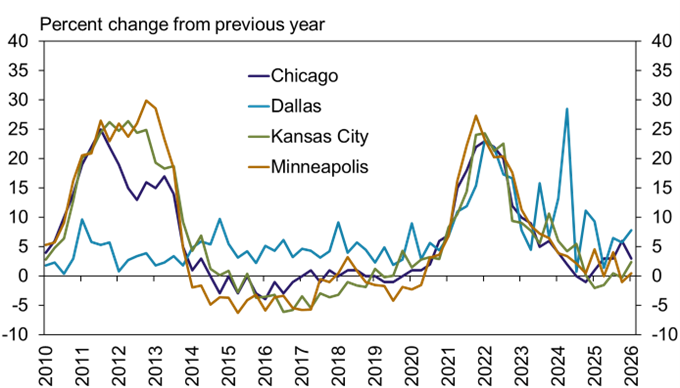
Source: Federal Reserve Surveys of Agricultural Credit Conditions
Farm real estate markets stayed resilient despite steady deterioration in farm financial conditions. The pace of decline in farm income slowed compared to the previous quarter in the Kansas City region but was unchanged for St. Louis District lenders and quickened slightly in the Minneapolis region (Chart 2). Ongoing challenges in the crop sector continued to weigh on many growers, but government payments have helped limit losses and strength in the cattle sector has boosted incomes for ranches and other operations diversified with beef cattle.
Chart 2: Farm Borrower Income
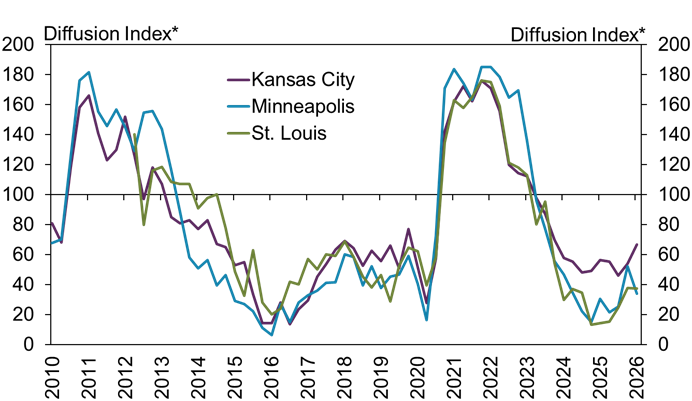
*Lenders responded by indicating whether conditions during the current quarter were higher than, lower than, or the same as in the year-earlier period. The index numbers are computed by subtracting the percentage of survey respondents who responded "lower" from the percentage who responded "higher" and adding 100.
Note: Information about farm income and borrower spending is only collected for the above Districts. The St. Louis survey began in Q2 2012.
Source: Federal Reserve Surveys of Agricultural Credit Conditions
Gradual deterioration in credit conditions also continued alongside tight farm finances. The pace of decline in farm loan repayment rates picked up slightly compared with the previous quarter across all regions and remained weakest in regions most heavily concentrated in crop production (Chart 3). The share of lenders reporting that repayment rates were lower than the same time a year ago was near 40% in the Chicago, Minneapolis, and St. Louis Districts and was less than 25% in the Kansas City and Dallas Districts.
Chart 3: Farm Loan Repayment Rates
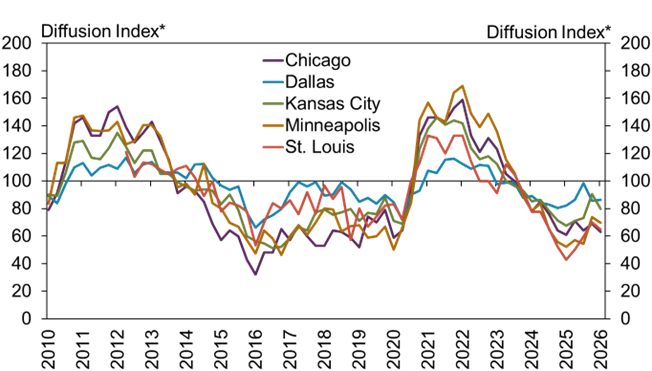
*Lenders responded by indicating whether conditions during the current quarter were higher than, lower than, or the same as in the year-earlier period. The index numbers are computed by subtracting the percentage of survey respondents who responded "lower" from the percentage who responded "higher" and adding 100.
Note: The St. Louis survey began in Q2 2012.
Source: Federal Reserve Surveys of Agricultural Credit Conditions
Commercial Bank Call Report Historical Data
Commercial Bank Call Report Data Tables
About Commercial Bank Call Report Data
The views expressed are those of the authors and do not necessarily reflect the positions of the Federal Reserve Bank of Kansas City or the Federal Reserve System.
Author
