
Although U.S. business-to-business (B2B) payments have shifted from checks to electronic payments over the past decade, many businesses still make and receive B2B payments with checks. With a check payment, the buyer (who writes the check) and supplier (who receives the check) must handle several business processes manually, incurring significant costs and inefficiencies. Electronic payment methods, which include wire, Automated Clearing House (ACH), instant payments, and credit and debit cards, have the potential to remove some of the manual processing; however, businesses face challenges to fully migrating to electronic payment methods.
The payment system modernization currently underway in the United States could allow businesses to improve efficiency in many business processes, including B2B payments. However, how specific payment methods shape many parts of business processes is not well understood. In this Payments System Research Briefing, the first in a three-part series, we examine trends in B2B payment methods over the past decade to understand how businesses’ payment methods are evolving. The second and third parts of the series will describe the business processes closely related to B2B payments and the challenges to improving efficiency, as well as the potential of instant payments to better address these challenges.
Number and value of B2B payments by payment method
To understand how businesses make and receive B2B payments over time, we use various data sources to estimate the number and value of B2B payments by method. Our main data source is the triennial Federal Reserve Payments Study, which provides the number and value of business-initiated payments made via check, ACH, credit card, debit card, and wire (Board of Governors of the Federal Reserve System 2024, 2025, 2026). To isolate B2B payments from other types of business-initiated payments such as business-to-consumer (B2C) payments, we make a few assumptions and use additional data sources. For credit and debit card payments, we assume all business-initiated payments are B2B payments. For wire payments, we assume all business-initiated payments except those for interbank settlement are B2B payments._ For check and ACH payments, we divide business-initiated payments into B2B and B2C payments (such as payrolls) using the Federal Reserve System’s check sample survey and Nacha’s statistics on the number and value of B2B payments processed by ACH networks._
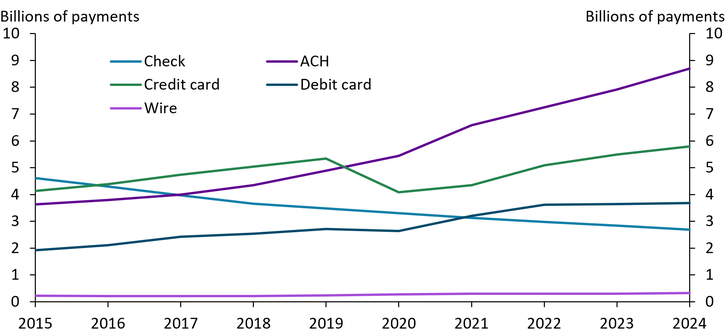
Chart 1 shows that checks are the only method for which the number of B2B payments has declined over the past decade, from 4.6 billion payments in 2015 to 2.7 billion in 2024._ Checks (light blue line) were the most used method for B2B payments out of all five payment methods in 2015 but have ranked fourth since 2021. In contrast, the number of B2B payments increased significantly for all electronic payment methods except wire. In particular, the number of B2B payments made via ACH (dark purple line) more than doubled from 3.6 billion in 2015 to 8.7 billion in 2024, and as a result, ACH has ranked first in B2B payment methods since 2020. Wire (light purple line) has had the smallest number of B2B payments, but its number increased slightly from 0.2 billion in 2015 to 0.3 billion in 2024.
Chart 1: Checks are the only payment method for which the number of B2B payments has declined
Sources: Board of Governors of the Federal Reserve System, Federal Reserve Bank of Atlanta, Federal Reserve Financial Services, Nacha, Nilson Report, The Clearing House, and authors’ calculations.
As a result of these trends in B2B payment methods, checks’ share of the number of B2B payments fell significantly, from 32 percent in 2015 to 13 percent in 2024. In contrast, the share of ACH payments increased significantly from 25 percent to 41 percent over the same period. The share of debit card payments slightly increased from 13 percent to 17 percent, while the shares of credit card and wire payments barely changed at nearly 30 percent and 2 percent, respectively.
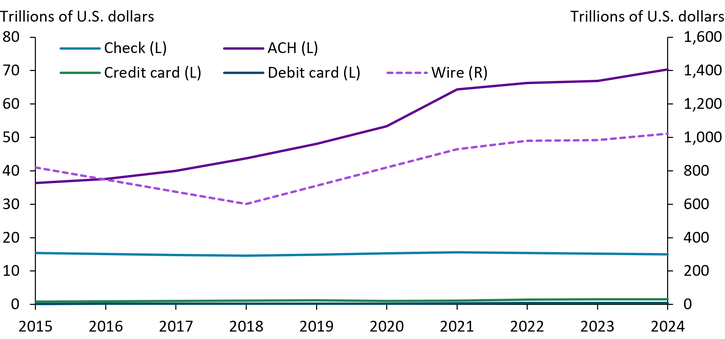
Chart 2 shows that despite the decline in the number of B2B payments made via checks, the estimated (nominal) value of B2B check payments (light blue line, left-side axis) in the United States has barely changed from $15.4 trillion in 2015 to $15.0 trillion in 2024. In contrast, the value of ACH payments (dark purple line, left-side axis) nearly doubled from $36 trillion in 2015 to $70 trillion in 2024. Although the values of both credit card (green line, left-side axis) and debit card (dark blue line, left-side axis) B2B payments also nearly doubled (from $0.9 trillion to $1.6 trillion and from $0.2 trillion to $0.4 trillion, respectively), these values have been significantly smaller compared with those of ACH and checks. The value of B2B payments made via wire (dotted line, right-side axis) has been the largest by far and increased significantly from $820 trillion in 2015 to $1 quadrillion in 2024.
Chart 2: The nominal value of B2B payments increased for ACH and wire but stayed the same for check, credit card, and debit card
Sources: Board of Governors of the Federal Reserve System, Federal Reserve Bank of Atlanta, Federal Reserve Financial Services, Nacha, Nilson Report, The Clearing House, and authors’ calculations.
In contrast to the distribution in number of B2B payments made across payment methods, the distribution in value has changed only slightly. Wire has accounted for most of the value of B2B payments, and its share declined by only 2 percentage points from 94 percent in 2015 to 92 percent in 2024. The ACH share increased from 4 percent to 6 percent over the same period. Checks’ share scarcely changed from 1.8 percent in 2015 to 1.4 percent in 2024, while both credit and debit card shares remained nearly zero.
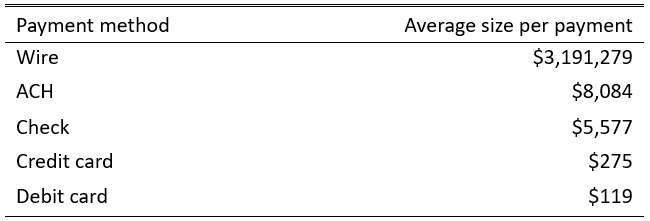
Using the estimated number and value of B2B payments, we calculate the average transaction size of B2B payments for each payment method. Table 1 shows that the average transaction size varies significantly by method. Wire transactions for B2B payments are by far the largest on average at nearly $3.2 million per payment in 2024. Average ACH and check transactions are similar in size: $8,084 and $5,577 per payment, respectively. In contrast, average transactions for both credit and debit cards are much smaller: $275 and $119 per payment, respectively.
Table 1: Average transaction size of B2B payments in 2024 significantly varies by method
Sources: Board of Governors of the Federal Reserve System, Federal Reserve Bank of Atlanta, Federal Reserve Financial Services, Nacha, Nilson Report, The Clearing House, and authors’ calculations.
The differences in average transaction size may be explained in part by each payment method’s fee structure and level. For check, ACH, and wire payments, businesses on both the sending and receiving sides of the payment are assessed a per-transaction fee that is the same for all transactions regardless of value. Among these payment methods, ACH has the lowest per-transaction fee, with a median fee of $0.25 to $0.50 for both sending and receiving organizations, followed by checks, with a median fee of $1 for sending organizations and less than $1 for receiving organizations. Wire has a higher per-transaction fee than ACH and checks, with a median fee of $7 each for both sending and receiving organizations (AFP 2022a). In contrast, for credit and debit card payments, receiving organizations are typically assessed a per-transaction fee that is a percentage of the transaction’s value, while sending organizations are assessed a very low or even negative fee (in the form of rewards). The median fee for a receiving organization is between 2.0 percent and 2.5 percent for credit cards and between 1.0 percent and 1.5 percent for debit cards. As a result, for receiving organizations, the per-transaction fee for a credit or debit card transaction becomes higher than the fee for a wire transaction when the transaction size exceeds about $300 for credit cards and around $500 for debit cards. Because of these differences in fees, businesses may send larger-value payments for which immediate settlement is valuable via wire, and they may limit their use of credit and debit cards to smaller-value payments, as receiving organizations may decline to accept medium- or large-value credit and debit card payments. ACH (which involves settlement delays and limits on transaction size) may be a close substitute for checks, as both methods are used for medium-value payments.
Check use by businesses for B2B payments
The decline in the number of B2B payments made with checks could result either from businesses ending check use or from businesses using checks less frequently. Available industry studies suggest that the latter may explain more of the decline than the former. According to the Association for Financial Professionals (AFP), 91 percent of businesses reported that their organizations used checks in 2024; by 2025, this share slightly declined by 4 percentage points to 87 percent (AFP 2025, 2026). The AFP study suggests many businesses, nearly 90 percent, still use checks for at least some of their B2B payments.
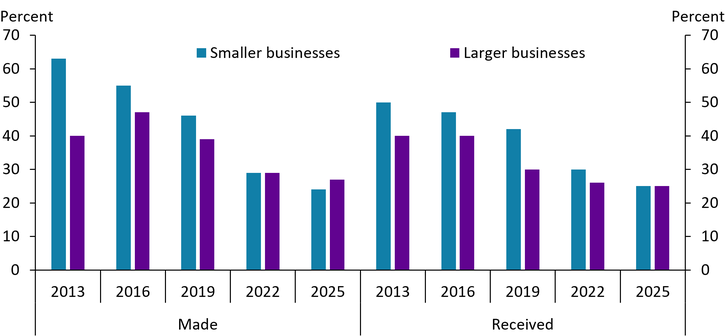
The AFP also conducts a triennial study to understand the B2B payments landscape, which allows us to examine whether the share of payments made by check has changed across types of businesses (AFP 2013, 2016, 2019, 2022b, 2025b). Through a series of surveys, the study obtains an organization’s share of B2B payments made or received by check and calculates the average share by organization type. The results suggest that both smaller and larger businesses significantly reduced their check use relative to their use of other payment methods from 2013 to 2025, implying that the decline in the number of B2B payments made via check stems primarily from many businesses using checks less frequently. However, to what degree businesses reduced their check use varies by type of organization. Smaller businesses previously used checks relatively more than their larger counterparts, but this difference has diminished more recently. The left side of Chart 3 shows the average shares of B2B payments made with checks for smaller businesses (blue bar) and larger businesses (purple bar). In 2013, the average share was significantly higher for smaller businesses (those with annual revenue less than $1 billion) than larger businesses (with annual revenue at least $1 billion)—63 percent versus 40 percent, respectively. Since then, however, the share of payments made by check has declined faster for smaller businesses than larger businesses, and the difference in small versus large businesses’ share has narrowed. Indeed, in 2025, the share of check payments made by smaller businesses dropped below the share made by larger businesses—24 percent versus 27 percent, respectively. Similarly, the right side of Chart 3 shows that while the average share of B2B payments received via check was higher for smaller businesses than larger businesses, the difference had almost disappeared by 2025.
Chart 3: The difference between smaller and larger businesses in the share of B2B payments made or received with checks has diminished
Note: Smaller businesses are those with annual revenue less than $1 billion, and larger businesses are those with annual revenue of at least $1 billion.
Source: AFP.
Summary
Over the past decade, U.S. businesses have shifted from checks to electronic methods, especially ACH, to make B2B payments. Checks were the most used method for B2B payments in 2015 but have ranked fourth since 2021. Despite the decline in number of check payments, the nominal value of checks for B2B payments has barely changed and continues to rank third after wire and ACH. The decline in the number of B2B check payments has resulted mainly from businesses using checks less intensively rather than ending their use of checks entirely. Indeed, nearly 90 percent of businesses still used checks in 2025.
Endnotes
-
1 The Federal Reserve Payments Study provides the number and value of wire payments for settlement and bank business.
-
2 Results of the check sample survey are reported in Board of Governors of Federal Reserve System (2017) and Federal Reserve Bank of Atlanta (2020, 2023). We use three additional data sources: Federal Reserve Banks (2026) and The Clearing House (2026) provide the number and value of payments processed by Fedwire Funds and CHIPS, respectively, and various issues of the Nilson Report provide the value of payments made with business credit and debit cards.
-
3 The numbers shown in Chart 1 include only “paid” checks, and checks written but truncated to ACH are excluded.
References
AFP (Association for Financial Professionals). 2026. “2026 AFP Payments Fraud and Control Survey Report.” Underwritten by Truist.
AFP. 2025a. “2025 AFP Payments Fraud and Control Survey Report.” Underwritten by Truist.
AFP. 2025b. “2025 AFP Digital Payments Survey Report: A Triennial Publication.” Underwritten by J.P. Morgan.
AFP. 2022a. “2022 AFP Payments Cost Benchmarking Survey.” Underwritten by Corpay.
AFP. 2022b. “2022 AFP Digital Payments Survey Report.” Underwritten by J.P. Morgan.
AFP. 2019. “2019 AFP Electronic Payments Survey Report.” Underwritten by J.P. Morgan.
AFP. 2016. “2016 AFP Electronic Payments Survey: Report of Survey Results.” Underwritten by J.P. Morgan.
AFP. 2013. “2013 AFP Electronic Payments Survey: Report of Survey Results.” Underwritten by J.P. Morgan.
Board of Governors of the Federal Reserve System. 2026. “External LinkFederal Reserve Payments Study (FRPS): National Payment Volumes Top-Line Data (CY 2015-24).” July.
Board of Governors of the Federal Reserve System. 2025. “External LinkFederal Reserve Payments Study (FRPS): National Payment Volumes, Detailed Data, DFIPS (CY 2021).” March.
Board of Governors of the Federal Reserve System. 2024. “External LinkFederal Reserve Payments Study (FRFS): National Payment Volumes, Detailed Data, NPIPS (CY 2021 and 2022).” November.
Board of Governors of the Federal Reserve System. 2017. “External LinkFederal Reserve Payments Study (FRFS): National Payment Volumes, Detailed Data, (CY 2015).” June.
Federal Reserve Bank of Atlanta. 2023. “External LinkChecks Processed by the Federal Reserve in 2021: Report of the Check Sample Survey.” April 25.
Federal Reserve Bank of Atlanta. 2020. “External Link2018 Check Sample Survey.” July 30.
Federal Reserve Banks. 2026. “External LinkFedwire Funds Service – Annual Statistics.” January 26.
Nacha. 2026. “External LinkACH Network Volume and Value Statistics: The Number of Payments and Value Conducted on the ACH Network.”
The Clearing House. 2026. “External LinkCHIPS Network Volume and Value Statistics.”
Todd Albers is a senior payments consultant at Federal Reserve Financial Services, Sam Baird is an experienced payments specialist at the Federal Reserve Bank of Kansas City, Fumiko Hayashi is a vice president at the Federal Reserve Bank of Kansas City, Ken Isaacson is a senior vice president at the Federal Reserve Bank of Cleveland, and Aditi Routh is an economist at the Federal Reserve Bank of Kansas City. The views expressed are those of the authors and do not necessarily reflect the positions of the Federal Reserve Bank of Cleveland and Kansas City, Federal Reserve Financial Services, or the Federal Reserve System.
Authors

Sam Baird
Associate Payments Specialist

Fumiko Hayashi
Vice President