Real wage growth has been low in recent years despite continued improvement in labor market conditions. Chart 1 shows that real compensation per hour in the business sector, a commonly used measure of real wage growth, grew about 0.7 percent per year in the last two years compared with an average level of 1.5 percent per year during the pre-crisis period of 2000–07.
Chart 1: Real Wage Growth
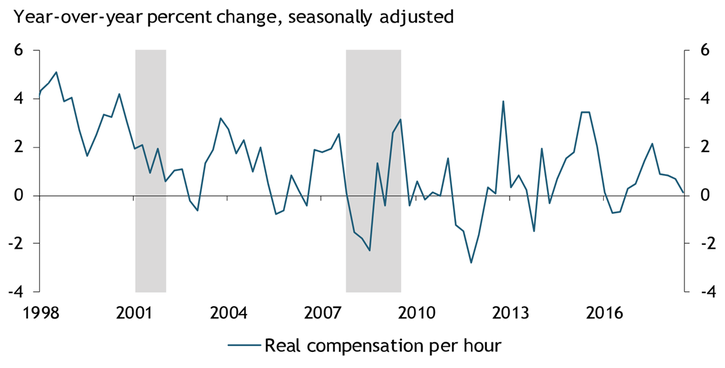
Notes: Gray bars denote National Bureau of Economic Research (NBER)-defined recessions.
Sources: Bureau of Labor Statistics (Haver Analytics) and NBER (Haver Analytics).
One explanation for the recent period of low wage growth could be low productivity growth. Real wage growth and productivity growth, measured by growth in utilization-adjusted total factor productivity (TFP), tend to move together, as shown by the blue and green lines in Chart 2._ However, this positive relationship between wage growth and productivity growth seems to be influenced by the unemployment rate, a core measure of labor market conditions. For example, around 2000, when the unemployment rate was low, wage growth was unusually strong relative to the improvement in productivity growth. Furthermore, during the 2010–12 period (circled in Chart 2), when the unemployment rate was high, wage growth remained low despite a significant increase in productivity growth. These observations suggest wage growth is influenced not only by productivity growth but also by the condition of the labor market.
Chart 2: Real Wage Growth, Productivity Growth, and Unemployment
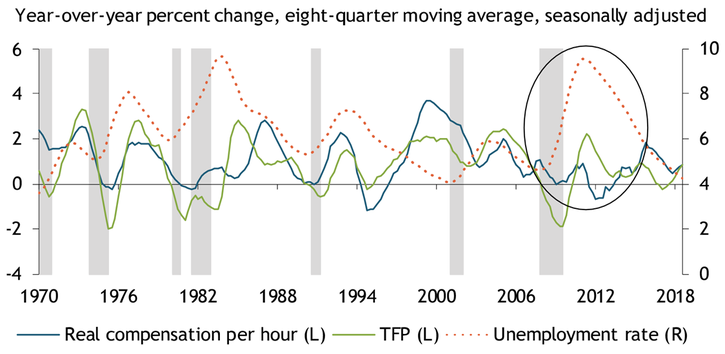
Notes: Gray bars denote NBER-defined recessions.
Sources: Bureau of Labor Statistics, Federal Reserve Bank of San Francisco, and NBER. All data sources accessed through Haver Analytics.
To quantify how labor market conditions influence the relationship between productivity growth and wage growth, I conduct a statistical analysis that accounts for the interaction between productivity growth and labor market conditions._ The analysis shows that a 1 percentage point increase in productivity growth is associated with a 0.75 percentage point increase in wage growth when the unemployment rate stays at its long-run level (Table 1, column 1)._
However, when the unemployment rate is higher than its long-run level, the associated increase in wage growth is smaller. For example, when the unemployment rate is 1 percentage point higher than its long-run level, a 1 percentage point increase in productivity growth contributes only 0.64 percentage point to wage growth. Similarly, if the unemployment rate is lower than its long-run level, the associated increase in wage growth is larger than 0.75 percentage point. These relationships hold even when using alternative measures of productivity growth and wage growth (as shown in Table 1).
Table 1: Real Wage Growth Regressions
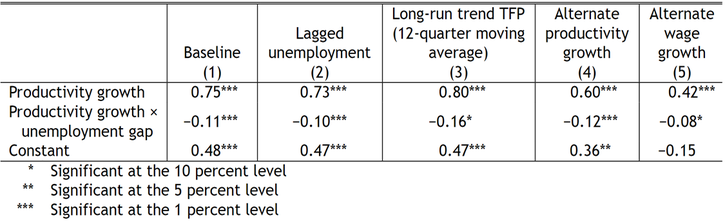
Sources: Bureau of Labor Statistics (Haver Analytics), Federal Reserve Bank of San Francisco (Haver Analytics), and author’s calculations.
To further understand the effects of unemployment on the relationship between productivity and wage growth, I use the baseline regression to decompose wage growth into the contributions from productivity growth and the contributions from the interaction between productivity and the unemployment rate. Table 2 shows the results of this decomposition. For example, from 2009 to 2010, productivity growth averaged 1.63 percentage points but contributed only 0.33 percentage point to wage growth because the unemployment rate was nearly 5 percentage points above its long-run level. The small contribution from productivity growth largely accounts for the low wage growth during that period. In contrast, since 2017, productivity growth has averaged only 0.85 percent, half of its 2009–10 level—however, productivity growth contributed 0.64 percentage points to wage growth, a larger contribution than in 2009–10, because the unemployment rate was below its long-run level.
To further emphasize the importance of the unemployment rate in influencing the relationship between productivity growth and wage growth, column 1 in Table 2 shows results from 1999–2000, a period in which productivity growth was strong and the unemployment rate was low. During this period, productivity growth contributed strongly to wage growth.
Table 2: Decomposing Wage Growth in Different Periods
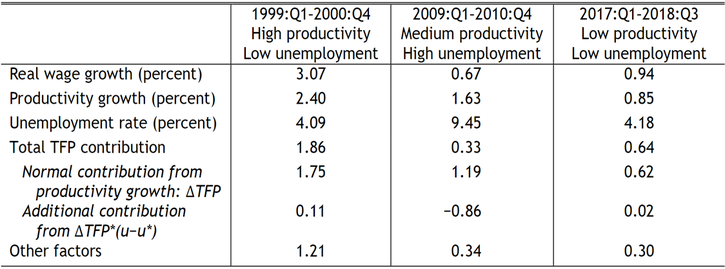
Sources: Bureau of Labor Statistics (Haver Analytics), Federal Reserve Bank of San Francisco (Haver Analytics), and author’s calculations.
Why has wage growth been weak recently? To answer that question, I compare the 2017–18 period with the period from 1995 through 2005 in which real wage growth was 1.75 percent and productivity growth was 1.87 percent. With some simple re-arrangement, I decompose the difference in wage growth between the two periods into its two contributors: the difference between productivity growth and its average and the difference between the unemployment rate and its average (interacted with productivity growth)._ The dotted line in Chart 3 shows the gap in wage growth between the two periods, the orange bars show the contribution from the difference in productivity growth, and the green bars show the contribution from the difference in the unemployment rates.
The chart illustrates two findings. First, low productivity growth in recent years largely accounts for the lower wage growth (as shown by the negative orange bars in the chart). Second, there are significant residuals that cannot be explained (as shown by the blue bars), as wage growth can be volatile quarter to quarter. However, the residuals have been minimal in the last few quarters, suggesting that the decomposition has accurately captured the sources of the wage-growth gap—and that low productivity growth largely accounts for the gap.
Chart 3: Explaining the Wage Growth Gap
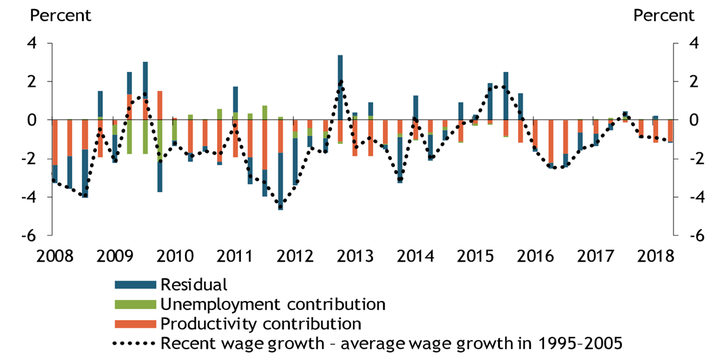
Source: Author’s calculations.
Overall, the analysis emphasizes the importance of both productivity growth and labor market conditions in determining wage growth. Specifically, the analysis shows that current low wage growth is mainly associated with low productivity growth. As the unemployment rate is currently almost 1 percentage point below its long-run level, an improvement in productivity growth would likely provide a greater than usual boost to wage growth.
Endnotes
-
1 Utilization-adjusted TFP is a common measure of productivity in research and policy analysis. For more information about this measure, see Fernald (2012). Using other productivity measures, such as non-utilization-adjusted TFP, does not qualitatively change this Bulletin’s main results.
-
2 I use the following regression model: Δwt = γ + αΔTFPt + βΔTFPt(ut−u*). In the benchmark regression, I use real compensation as the measure of real wages and the utilization-adjusted TFP from the Federal Reserve Bank of San Francisco as the measure of productivity. As robustness checks, I also use real hourly earnings as an alternative measure of real wages and real gross domestic product per worker in the business sector as an alternative measure of productivity.
-
3 For the long-run level of the unemployment rate (u*), I use 4.5 percent, the Federal Open Market Committee (FOMC)’s current median projection in September 2018.
-
4 Specifically, the equation is as follows: Δwt – avg(Δw) = 0.68(ΔTFPt − avg[ΔTFP]) – 0.11avg(ΔTFP)(ut – avg[u]), where Δw is the average wage growth from 1995–2005 (1.75 percent), avg(ΔTFP) is the average TFP growth (1.87 percent), and avg(u) is the average unemployment rate (5.07 percent) in 1995–2005.
Reference
Fernald, John. 2012. “External LinkA Quarterly, Utilization-Adjusted Series on Total Factor Productivity.” Federal Reserve Bank of San Francisco, Working Paper no. 2012-19, April.
Jun Nie is a senior economist at the Federal Reserve Bank of Kansas City. The views expressed are those of the author and do not necessarily reflect the positions of the Federal Reserve Bank of Kansas City or the Federal Reserve System.