
The U.S. unemployment rate stands at 4.1 percent as of August 2026, a low level that would ordinarily signal a healthy labor market. However, a closer look at the underlying worker flows that determine this rate can provide a more complete picture of labor market health. The unemployment rate is determined by the job loss rate (the percentage of employed workers who become unemployed each month) and the job finding rate (the percentage of unemployed workers who find jobs each month)._ In a healthy labor market, low unemployment derives from both a relatively low job loss rate and a relatively high job finding rate. When low unemployment is driven by a low job loss rate alone, however, the labor market may be more fragile than it initially appears.
Chart 1 shows that the current unemployment rate is indeed the result of a low job loss rate, not a high job finding rate. Panel A shows that the current job loss rate is 1.8 percent, near historical lows and close to its pre-pandemic 2019 average. In contrast, Panel B shows that the current job finding rate is 34 percent, down from 39 percent in 2019 and at its lowest sustained level (outside the pandemic recession) since 2016. Panel C shows that the unemployment rate implied by these two flows tracks the actual unemployment rate almost exactly._ Both remain low, averaging 4.2 percent (approximation) and 4.3 percent (actual) this year. Overall, Chart 1 highlights that today’s low unemployment rate is largely the result of historically low job loss rather than strong job finding. Moreover, the recent gradual uptick in the unemployment rate has been driven by a further slowdown in the job finding rate.
Chart 1: Job loss and job finding rates determine the unemployment rate
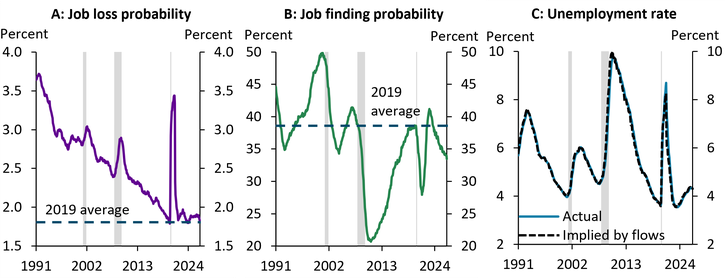
Notes: Job loss rate, job finding rate, and the implied unemployment rate follow Shimer (2012). Data are 12-month moving averages. Gray bars denote National Bureau of Economic Research (NBER)-defined recessions.
Sources: U.S. Bureau of Labor Statistics (BLS), NBER, and authors’ calculations. Data accessed via FRED (Federal Reserve Bank of St. Louis).
A declining job finding rate translates into longer unemployment spells for individuals. Panel A of Chart 2 shows that about 27 percent of unemployed individuals have been seeking a job for more than six months, up from 21 percent in 2019—an increase rarely seen outside of recessions. Panel B shows that average unemployment duration has risen to 26 weeks, up from 22 weeks in 2019.
Chart 2: Slowing job finding rate is increasing unemployment duration
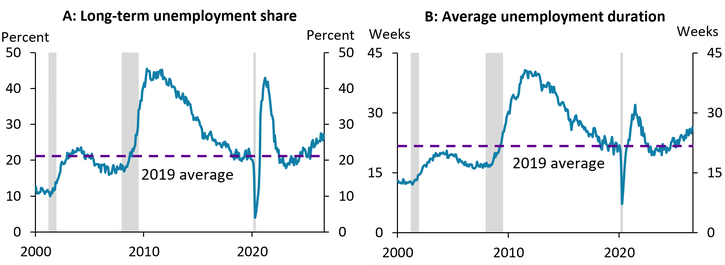
Notes: Long-term unemployment is 27 weeks or longer. Gray bars denote NBER-defined recessions.
Sources: BLS, NBER, and authors’ calculations. Data accessed via FRED (Federal Reserve Bank of St. Louis).
Employer-side data from the Job Openings and Labor Turnover Survey (JOLTS), which captures hires and separations, corroborate this pattern. Panel A of Chart 3 shows that both hires and separations are at low levels, and the gap between them has narrowed. Panel B shows that this gap closely approximates the percent change in payroll employment in the Current Employment Statistics (CES), the headline monthly jobs number. Panel C decomposes the slowdown in payroll growth relative to 2019 into the contributions from hires and separations. Slower hiring accounts for more than the entire decline in payroll growth, partly offset by falling separations.
Chart 3: Hires and separations determine payroll employment growth
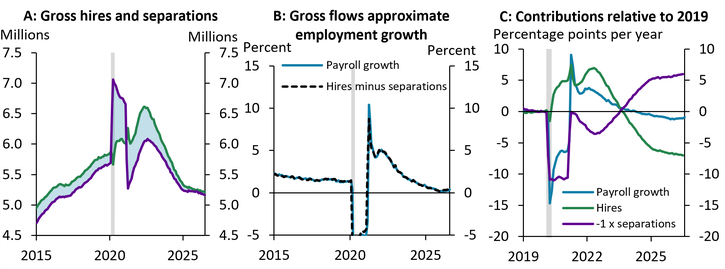
Notes: Data are 12-month moving averages. The light blue shaded area in Panel A represents net employment gains, defined as hires minus separations. Data in Panels B and C are annualized by multiplying the monthly series by 12. Gray bars denote NBER-defined recessions.
Sources: BLS, NBER, and authors’ calculations. Data accessed via FRED (Federal Reserve Bank of St. Louis).
Together, these data from workers and employers suggest a “low-hire, low-fire” labor market that may be more vulnerable to adverse shocks. Job loss is near historical lows, with little room to fall further. Should the job loss rate increase, the low job finding rate would leave little capacity to absorb displaced workers. Thus, the same increase in job loss would lead to a greater increase in the unemployment rate in the current labor market than it would in a more fluid labor market, where hires and fires are higher and worker churn is greater.
To provide a concrete example of this vulnerability, we perform a counterfactual exercise comparing two economies with the same unemployment rate but very different underlying worker flows. Specifically, we compare the labor market today and in 1999. Today, unemployment is around 4.2 percent, with a 34 percent job finding rate and a 1.8 percent job loss rate. In 1999, unemployment also averaged 4.2 percent, but with a 49 percent job finding rate and a 2.9 percent job loss rate.
We examine how both labor markets respond to changes in the job finding and job loss rates observed in the 2001 recession (one of the mildest postwar downturns) and the 2008 recession._ In the 1999 labor market, these shocks would increase the unemployment rate to 6 percent under 2001 recessionary conditions and to 6.9 percent under 2008 conditions. In today’s less fluid labor market, however, the unemployment rate would rise to 8.2 percent and 11 percent, respectively. A spike in job loss is much harder to offset when hiring is already slow. In other words, the more fluid labor market of 1999 had a greater capacity to absorb shocks than the labor market today._
Chart 4: At the same unemployment rate, the 1999 labor market was more resilient than today’s
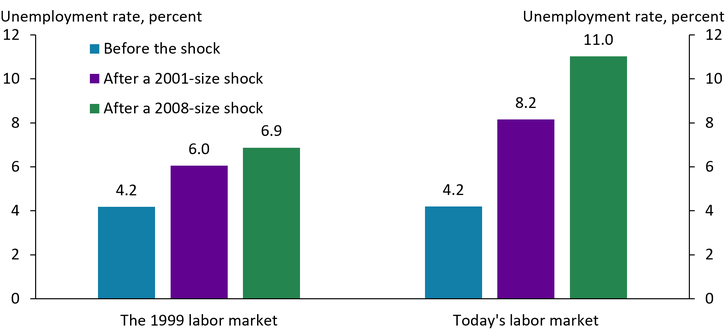
Note: Counterfactual unemployment rates are constructed using a steady-state approximation, incorporating the respective changes in job loss and finding rates during the 2001 and 2008 recessions.
Sources: BLS and authors’ calculations. Data accessed via FRED (Federal Reserve Bank of St. Louis).
Although today’s low unemployment rate paints an optimistic picture of the labor market, the low-hire, low-fire environment calls for caution. One plausible explanation for this environment is labor hoarding. Employers who struggled to rehire during the pandemic recovery may be reluctant to shed workers, preferring to meet demand with existing staff rather than new hires. This explanation is consistent with both low separations and low hiring. If labor hoarding is indeed supporting today’s low job loss rate, this support may prove fragile. Should demand weaken and layoffs increase, already slow hiring would leave displaced workers with few options. Hence, worker flows deserve as much attention as the unemployment rate itself, since they determine how well the labor market can absorb a future shock.
Endnotes
-
1 Flows into and out of the labor force also shape the unemployment rate. Slower U.S. labor force growth from aging and lower immigration means that modest payroll gains suffice to keep unemployment stable (Mercan 2025). Some job seekers might exit the labor force when job finding slows, contributing to a decline in measured unemployment. We nonetheless focus only on the flows between employment and unemployment, since the unemployment rate implied by these two flows alone tracks the actual unemployment rate closely (Chart 1, Panel C). We construct the job loss and job finding rates following Shimer (2012), adjusting for time-aggregation bias. Specifically, we compute the job finding rate from the stocks of unemployed workers and of those unemployed less than five weeks and recover the job loss rate residually from the law of motion for unemployment. We report the monthly transition probabilities implied by the estimated continuous-time hazard rates in the text but use the underlying hazard rates to approximate the unemployment rate, while using these terms interchangeably in our discussions. We impute data for October 2025, missing due to the federal government shutdown, and for March 2020, when the surge in short-term unemployment produces a negative computed job finding rate.
-
2 Equating unemployment inflows and outflows implies a steady-state approximation to the current month’s unemployment rate equal to the ratio of the job loss rate to the sum of the job loss and finding rates in the previous month.
-
3 Specifically, we calculate the resulting unemployment rate by simultaneously feeding the changes in the job loss and job finding rates into the steady-state approximation to the unemployment rate. The changes in the job finding and job loss rates in the 2001 recession are approximately −19 and 0.14 percentage points, respectively, which we calculate as the average hazard rates over October 2001 to September 2002 minus their 2000 calendar-year averages. The changes in the job finding and job loss rates in the 2008 recession are approximately −26 and 0.11 percentage points, respectively, which we calculate as the average hazard rates over July 2009 to June 2010 minus their 2007 calendar-year averages.
-
4 Labor market fluidity shapes not only the rise in unemployment but also how fast it recovers. If we instead feed in the proportional changes in the two rates during the 2001 and 2008 recessions, peak unemployment would be identical in the two economies, but the 1999 labor market would recover much faster. At 1999 flow rates, unemployment closes half of any gap to its long-run level in about one month, while at today’s rates, the same adjustment takes 1.6 months.
References
Mercan, Yusuf. 2025. “Declining Immigration and an Aging Population Are Reducing Breakeven Employment Growth.” Federal Reserve Bank of Kansas City, Economic Bulletin, October 15.
Shimer, Robert. 2012. “External LinkReassessing the Ins and Outs of Unemployment.” Review of Economic Dynamics, vol. 15, no. 2, pp. 127–148.
Molly Hirner is a research associate at the Federal Reserve Bank of Kansas City. Yusuf Mercan is a senior economist at the bank. The views expressed are those of the authors and do not necessarily reflect the positions of the Federal Reserve Bank of Kansas City or the Federal Reserve System.
Authors

Molly E. Hirner
Research Associate