Higher borrowing rates contributed to a significant rise in the subprime credit card delinquency rate over the last couple of years (Pandolfo 2024). However, as of January 2025, the subprime delinquency rate has declined for two consecutive months, though it remains elevated. Chart 1 plots credit card delinquency rates by borrower credit quality and shows that while the subprime delinquency rate climbed by 7.4 percentage points (trough to peak) during the monetary tightening cycle that began in March 2022, it has fallen since November 2024 (purple line)._
Chart 1: Since peaking in November 2024, the credit card delinquency rate has fallen for subprime borrowers
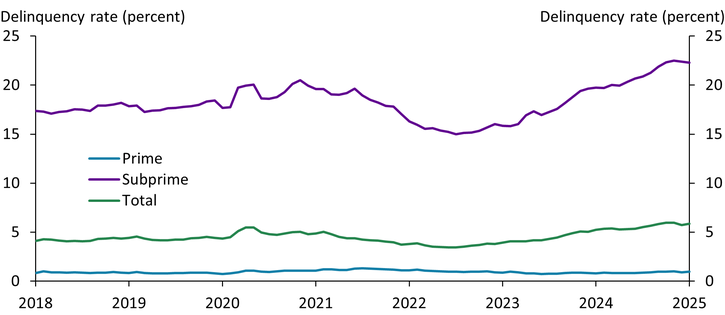
Notes: Rates are weighted by outstanding credit card balance. Delinquency refers to balances 30+ days past due.
Source: Board of Governors of the Federal Reserve System.
The rise and subsequent fall in the subprime delinquency rate has mirrored movements in subprime borrowing rates. Chart 2 plots the average annual percentage rate (APR) on credit cards, segmented by borrower credit quality. Subprime borrowers consistently pay higher APRs than prime borrowers due to differences in relative creditworthiness; however, this gap widened throughout 2023 as subprime rates (purple line) rose more steeply than prime rates (blue line). More recently, this gap has begun to narrow: Subprime APRs have gradually declined, while prime APRs have only modestly declined. This relative drop in borrowing rates could be related to the drop in subprime delinquencies, though it is difficult to parse demand and supply effects._
Chart 2: Subprime APRs have fallen faster than prime APRs in recent months
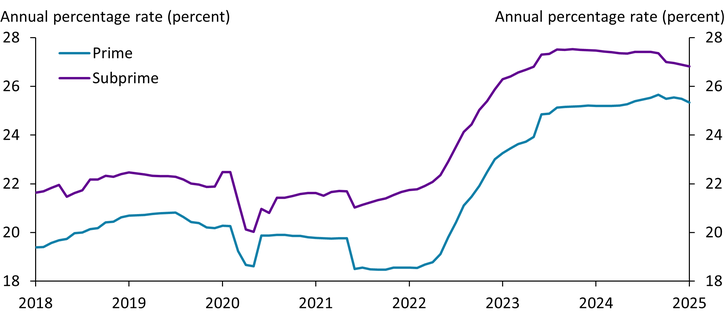
Note: Rates are reported as unweighted averages.
Source: Board of Governors of the Federal Reserve System.
Examining the payment activity of credit card users may help untangle whether demand for credit has changed—and, thus why credit card APRs have changed. Chart 3 plots the annualized growth rate of credit card purchases by borrower credit quality. From 2022 to 2023, purchase activity grew faster among subprime borrowers (purple line) than prime borrowers (blue line); however, growth in subprime purchases declined in 2024 and turned negative as of January 2025. Thus, throughout the sample, periods of higher purchase activity were coupled with higher borrowing rates and vice versa. This relationship suggests the recent drop in subprime APRs may be a response to subprime borrowers’ lower demand for credit card financing.
Chart 3: Subprime purchase activity increased in 2022–23 but fell in 2024–25
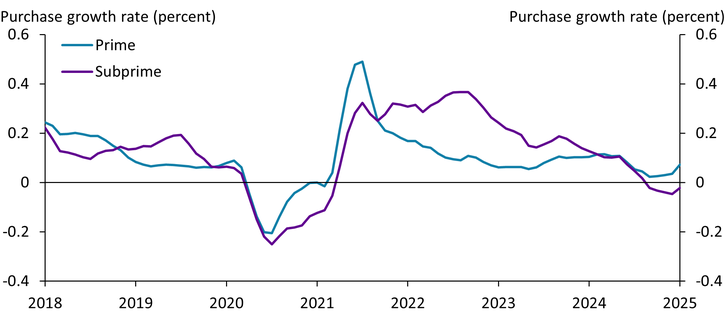
Note: Rates are measured by aggregate purchase activity and are year-over-year annualized measures with a four-month moving average.
Source: Board of Governors of the Federal Reserve System.
In summary, since monetary policy tightening began in March 2022, the cost of borrowing has risen dramatically for many consumer financial products, especially credit cards. This period of rising borrowing costs was marked by a dramatic increase in subprime borrower delinquency rates, though that trend has reversed since November 2024. While a lower APR and lower delinquency rate appear to be positive developments for subprime borrowers, they likely reflect a drop in demand for credit among these borrowers. Thus, whether these developments are truly positive will ultimately depend on the cause of the drop in demand.
Download Materials
Endnotes
-
1 Delinquency rates are weighted by cycle-end balances, and prime borrowers are conservatively defined as those with a credit score at or above 670 for FICO and 661 for VantageScore. Subprime borrowers account for 23 percent of total cycle-end balances in this 10 percent random sample of credit cards. In terms of purchase activity, prime borrowers make up almost 96 percent of credit card transactions. This share is consistent with the notion that prime borrowers are transactors, using credit cards for rewards, whereas subprime borrowers use credit cards for debt financing.
-
2 For example, subprime rates may have dropped due to lower demand for credit card debt or because banks can more cheaply issue and service credit cards. It is thus difficult to determine the causal relationship between rates and delinquencies.
Article Citation
Pandolfo, Jordan. 2025. "Subprime Credit Card Delinquencies Have Fallen." Federal Reserve Bank of Kansas City, Economic Bulletin, April 2.
Reference
Pandolfo, Jordan. 2024. “External LinkConsumer Credit Cards Show Few Signs of Financial Stress.” Federal Reserve Bank of Kansas City, Economic Bulletin, December 6.
Jordan Pandolfo is an economist at the Federal Reserve Bank of Kansas City. The views expressed are those of the author and do not necessarily reflect the positions of the Federal Reserve Bank of Kansas City or the Federal Reserve System.
Author