The U.S. Treasury reached its statutory debt limit on January 19, 2023, and began using extraordinary measures to continue funding the government without increasing the debt. However, it expects to reach the “x-date,” at which time extraordinary measures will be exhausted, sometime mid-year._ Treasury debt serves as a bedrock of the global financial system, being a key source of collateral for many financial transactions and held broadly by investors. As a result, concerns about Treasury debt obligations, or even uncertainty about how those concerns will be resolved, could have broad destabilizing consequences for the economy.
Prior U.S. debt ceiling episodes differed in how quickly a resolution was reached, providing a natural setting for understanding how economic and financial conditions could respond to various resolution timelines today. For example, in October 2021, Congress reached a temporary resolution several weeks in advance of the projected x-date, while resolutions in 2011 and 2013 occurred just days before the x-date.
Borrowing costs rose more steeply when debt ceiling episodes were resolved closer to an x-date. Chart 1 plots market rates for one-month Treasury securities 90 days before and after the x-date during each of these previous episodes. In both 2011 and 2013, short-term Treasury bill rates jumped sharply about two weeks prior to the expected x-date. In contrast, financial market changes in 2021 were initially more subdued due to the passage of a temporary resolution. A month later, however, as the temporary resolution reached its expiration date (dashed line), short-term rates rose sharply and were highly volatile.
Chart 1: Short-term Treasury rates spike near x-dates
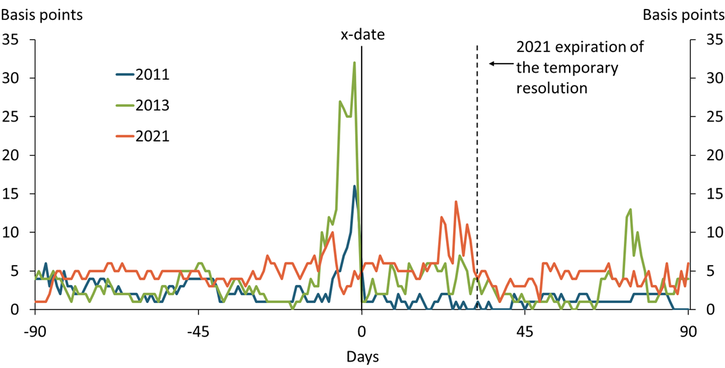
Notes: X-dates are August 2, 2011; October 17, 2013; and October 18, 2021. The 2021 episode was temporarily resolved on October 18, but a permanent solution was not in place until December 2021, at which time a second x-date occurred.
Source: Board of Governors of the Federal Reserve System.
In addition, financial intermediaries experienced greater liquidity strains when debt ceiling episodes were resolved closer to the expected x-date. Chart 2 shows that money market funds, particularly government funds, experienced unusually large outflows in the two weeks prior to the debt ceiling resolution in 2013. During this time, large commercial banks experienced an associated influx of deposits (not shown). However, these flows quickly reversed following resolution. Because both money market funds and banks engage in maturity transformation, rapid funding outflows could potentially destabilize the financial system.
Chart 2: Money market fund flows were volatile near the 2013 resolution
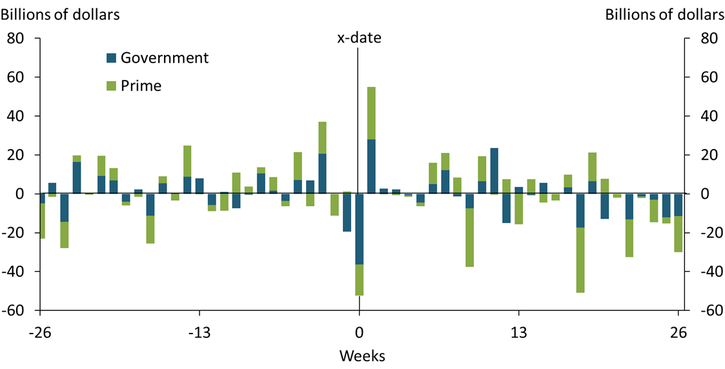
Note: X-date is October 17, 2013.
Sources: ICAP (Haver Analytics).
Although financial market risks rise when debt ceiling resolutions occur closer to x-dates, resolutions that occur after x-dates likely have the steepest consequences because financial intermediaries could face concerns about the marketability of U.S. Treasury securities. Most recently, Treasury trading conditions were strained at the onset of the pandemic in March 2020, when investors exhibited an outright unwillingness to trade Treasury securities, leading the Federal Reserve, Treasury, and Congress to take swift action to support market functioning (Fleming and Ruela 2020). Should the x-date pass, similar financial and economic stress could occur as credit concerns arise in Treasury markets. Indeed, during previous episodes, analysts expected persistent deterioration in a broad range of macroeconomic outcomes were the x-date to pass (Engen, Follette, and Laforte 2013).
Together, these past episodes suggest that short-term funding costs can rise rapidly as concerns about the debt limit increase. However, each of these episodes varied significantly in severity, highlighting substantial uncertainty about how financial conditions respond to debt ceiling resolutions. One factor driving this uncertainty is the amount by which the Treasury might adjust its debt maturity structure to manage its cash flow. For example, as an expected x-date approaches, the Treasury might rely more heavily on short-term cash management bills—reducing the supply of other forms of Treasury debt, including short-maturity bills (Chavez-Dreyfuss and Lawder 2023). Indeed, Chart 3 shows that outstanding bill supply fluctuated significantly when the Treasury used extraordinary measures in the past. Although many factors influenced the amount of bills outstanding during each episode, total bill supply eventually fell after the date that extraordinary measures were first implemented.
Chart 3: Outstanding Treasury bill levels are lower and more volatile during debt limit debates
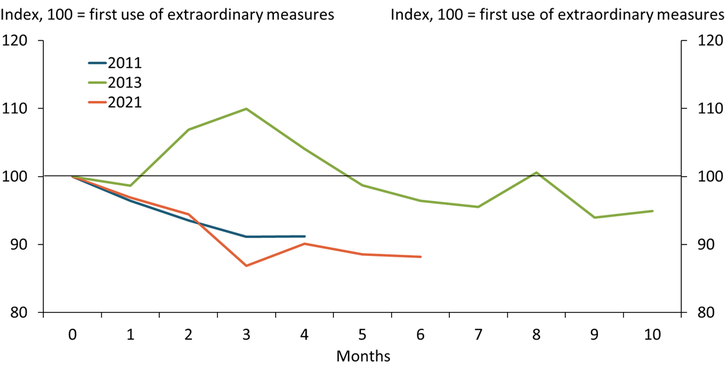
Note: The debt limit debate period is defined as the month just prior to reaching the debt limit and the month of the debate’s resolution.
Sources: U.S. Treasury and authors’ calculations.
Should the supply of Treasury bills fall when the x-date is still far off, investors could shift to alternative money market instruments such as repurchase transactions, commercial paper, or agency discount notes. Shifting to these alternative investments could put downward pressure on money market rates, ultimately dislocating those rates from the Federal Reserve’s target range. As recently as the summer of 2021, limited bill supply and strong demand for short-term investments required adjustments to administered rates and counterparty limits to support money markets (FOMC 2021a, 2021b). Substantial declines in outstanding bill levels could require similar, albeit temporary, measures until the debate is resolved. Most importantly, markets may face uncertainty about what actions the Federal Reserve would take to maintain the intended target range.
The economic environment during previous debt limit episodes differs from the current episode in three important ways, potentially changing how markets may react to the ongoing debate. First, in both the 2011 and 2013 debt limit episodes, the Federal Reserve was in an accommodative policy stance and providing additional liquidity to the financial system._ Today, in contrast, the Federal Reserve is actively withdrawing liquidity from financial markets by shrinking its balance sheet. Thus, any disruption to market liquidity could strain banks and money market funds. Second, government money market fund assets grew substantially since 2013 following money market fund reforms in 2016 and pandemic-era increases in the Federal Reserve’s balance sheet. Thus, liquidity swings could be larger and more destabilizing today. Third, money market funds use the Federal Reserve’s overnight reverse repurchase facility (ON RRP)—which allows them to make loans collateralized by government debt to the Federal Reserve—to a much larger extent today than during previous episodes (Marsh and Sengupta 2022). Although money market funds could harbor concerns about holding collateral with limited marketability, participants may be more willing to transact with the Federal Reserve. Indeed, the Federal Open Market Committee (FOMC) appeared willing to accept Treasury securities in Federal Reserve operations at market prices during past episodes (Davidson 2017). If money market funds expect that the FOMC may be willing to do so again, they may shift their investments to the ON RRP, reducing investor fears and tempering run risk.
Endnotes
-
1 For more details on the extraordinary measures taken by the Treasury, see U.S. Department of the Treasury (2023a). Treasury staff currently project that the Treasury will not exhaust its available funding before June of this year (U.S. Department of the Treasury 2023b).
-
2 The Federal Reserve conducted large-scale asset purchases (LSAPs) with varying frequency and intensity from 2008 to 2014.
References
Chavez-Dreyfuss, Gertrude, and David Lawder. 2023. “External LinkU.S. Treasury to Keep Auction sizes Unchanged in Coming Quarter as Debt Limit Weighs.” Reuters, February 1.
Davidson, Kate. 2017. “External LinkOfficials Planned to Prioritize Debt Payments as 2011 Debt-Ceiling Deadline Loomed.” Wall Street Journal, January 12.
Engen, Eric, Glenn Follette, and Jean-Philippe Laforte. 2013. “External LinkPossible Macroeconomic Effects of a Temporary Federal Debt Default.” FOMC memo, October 4.
Fleming, Michael, and Francisco Ruela. 2020. “External LinkTreasury Market Liquidity during the COVID-19 Crisis.” Federal Reserve Bank of New York, Liberty Street Economics (blog), April 17.
FOMC (Federal Open Market Committee). 2021a. “External LinkMinutes of the Federal Open Market Committee, June 15–16.”
———. 2021b. “External LinkMinutes of the Federal Open Market Committee, September 21–22.”
Marsh, W. Blake, and Rajdeep Sengupta. 2022. “External LinkIs Bank Capital Regulation Driving Continued Use of the Overnight Reverse Repurchase (ON RRP) Facility?” Federal Reserve Bank of Kansas City, Economic Bulletin, December 16.
U.S. Department of the Treasury. 2023a. “External LinkDescription of the Extraordinary Measures.” January 19.
———. 2023b. “External LinkEconomy Statement by Benjamin Harris, Assistant Secretary for Economic Policy, for the Treasury Borrowing Advisory Committee.” Press release, January 30.
Stefan Jacewitz is a research and policy officer at the Federal Reserve Bank of Kansas City. W. Blake Marsh is a senior economist at the bank. Nicholas Sly is a vice president, economist, and Denver branch executive at the bank. The views expressed are those of the authors and do not necessarily reflect the positions of the Federal Reserve Bank of Kansas City or the Federal Reserve System.
Authors

Stefan A. Jacewitz
Assistant Vice President

W. Blake Marsh
Senior Economist