
Private nonprofit colleges are an important part of the higher education sector, accounting for almost 60 percent of all U.S. four-year colleges._ However, private nonprofit colleges have been struggling in recent years. Chart 1 plots the number of four-year private nonprofit colleges (purple line) against the number of four-year private nonprofit college closures (blue bars). The number of four-year private nonprofit colleges peaked in fall 2015 and returned to its fall 2008 level by fall 2022. The rise in the number of closures contributed meaningfully to this decline. Data from The Hechinger Report show 106 closures between 2008 and 2024, with the number of closures increasing over time. Most of these colleges cited financial difficulties or declining enrollment as the reason for their closure. While data on the number of colleges are only available through fall 2022, closure data suggest the number of four-year private nonprofit colleges has continued to decline.
Chart 1: Private nonprofit college closures have increased, leading to fewer private nonprofit colleges
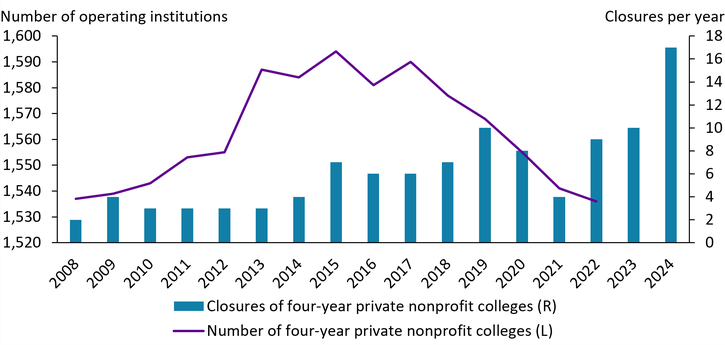
Notes: Closures include institutions that ceased independent operations but merged into another existing institution. Data on the total number of colleges are from Table 317.10 of the 2023 Digest of Education Statistics and report the number of colleges during the fall of that year.
Sources: The Hechinger Report, National Center for Education Statistics (NCES), and author’s calculations.
Plateauing growth in undergraduate enrollment may be contributing to these closures. Chart 2 shows that, after steady growth in the 2000s, undergraduate enrollment at private nonprofit colleges (blue line) saw almost no growth during the 2010s. In contrast, graduate enrollment (purple line) has seen strong growth throughout the 21st century, with enrollment more than 50 percent higher in fall 2022 than in fall 2000._ As of fall 2022, graduate students made up over a third of four-year private nonprofit college enrollments, almost double the proportion at four-year public colleges.
Chart 2: Graduate enrollment at private nonprofit colleges has grown more rapidly than undergraduate enrollment
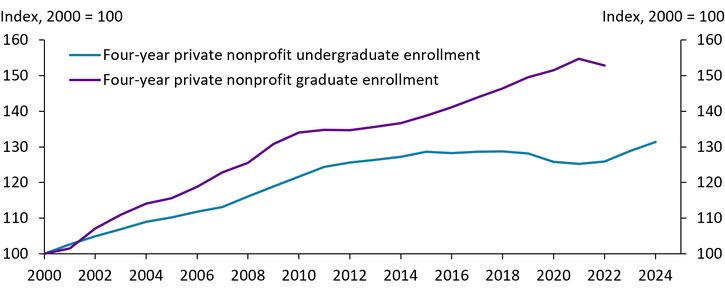
Notes: Data on undergraduate fall enrollment are from Table 303.70 of the 2025 Digest of Education Statistics. Data on graduate fall enrollment are from Table 303.80 of the 2023 Digest of Education Statistics.
Sources: NCES and author’s calculations.
With lagging undergraduate enrollment, some private nonprofit colleges have turned their focus to graduate programs to increase revenue. Demand for graduate degrees has increased in recent decades as more jobs require a graduate degree for entry and as historically underrepresented groups increasingly pursue graduate education._ Many private nonprofit colleges have responded to this demand by increasing their graduate program offerings. From the 2004–05 school year to the 2021–22 school year, private nonprofit institutions nearly doubled the number of master’s programs they offered (Kelchen and Barrett 2024). While the majority of these new programs are still fully in person, a growing share are either hybrid or online. These programs allow colleges to recruit students from a wider geographic range.
Additional graduate students not only bring in tuition revenue but may also lower colleges’ cost of labor. Many graduate students work for the colleges they attend by teaching classes or conducting research. These students are typically paid significantly less than faculty members, making them an attractive source of labor. Indeed, colleges appear to have expanded their employment of graduate students in recent years. Chart 3 shows that from fall 2015 to fall 2022, employment of graduate assistants at four-year private colleges increased by nearly 20 percent (purple line). Over the same period, employment of faculty (blue line) and other staff (green line) declined slightly.
Chart 3: Employment of graduate assistants at four-year private colleges has increased while all other employment has declined
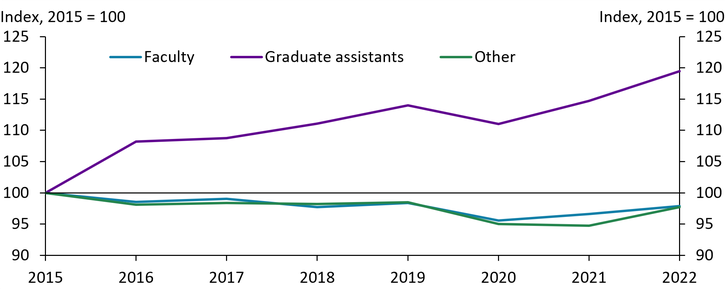
Note: Chart data are from Table 314.20 of the 2023, 2022, 2021, and 2020 editions of the Digest of Education Statistics.
Sources: NCES and author’s calculations.
Overall, graduate programs can be a boon for college finances. Ma, Pender, and Hu (2025) find that at private nonprofit institutions that offer doctoral degrees, revenue per full-time equivalent student exceeded expenditures by an average of $12,200 during the 2022–23 school year. For private nonprofit institutions that offer only bachelor’s degrees, revenue per student exceeded expenditures by only $1,600. Anecdotal evidence also suggests that graduate programs can help private nonprofit institutions weather financial problems. For example, facing severe financial difficulties, Simmons University began offering graduate programs online in addition to its in-person programs. Two years later, its graduate division made a profit of $24 million, while its undergraduate division only broke even (Marcus 2017).
Going forward, demographic factors are expected to result in declining undergraduate enrollments, placing additional pressure on the sector. In the United States, the number of births per year peaked in 2007 and has declined significantly since. Consequently, Lane, Falkenstern, and Bransberger (2024) project that the number of recent high school graduates entering post-secondary education peaked in 2025 and will decline at least through 2040.
These declines may lead colleges to place further emphasis on their graduate programs, which are less likely to be affected by these trends in the near term. Graduate students are generally older than undergraduate students: At four-year private nonprofit colleges, 44 percent of graduate students were age 30 or older during the fall 2021 semester compared with only 14 percent of undergraduates. Additionally, a larger proportion of graduate students are from outside the United States. At four-year private nonprofit colleges, international students made up 17 percent of all graduate students during the fall 2022 semester compared with less than 6 percent of undergraduate students. Together, these differences make graduate enrollments more resilient—at least in the short term—to the declining number of high school graduates entering college.
However, recent government policy changes may temper graduate enrollment going forward. Changes in immigration policy have resulted in fewer international students coming to the United States for higher education. During summer 2025, F1 student visa issuance, required for undergraduate or graduate study in the United States, was 36 percent lower than the previous summer. For domestic students, new constraints on student loan availability may dampen enrollments as well. Previously, graduate students were able to use federal loans to borrow up to the full amount charged for tuition, fees, room, and board. However, beginning July 2026, provisions in the One Big Beautiful Bill Act will impose annual and cumulative borrowing limits on students. Monarrez, Matsudaira, and Ritter (2025) find that 34 percent of federal borrowers who first enrolled in a graduate program at a private nonprofit college between 2015 and 2024 borrowed above the new limits. More than one-third of these students either had no Equifax credit score or had a score below 670, suggesting they would be unable to access private credit to bridge the gap. For students like these, graduate school may now be out of reach.
Declining undergraduate and graduate enrollments would put additional stress on the private nonprofit college sector. This strain could lead colleges to rethink their business models or even to close. College closures can be highly disruptive to students, faculty and staff, and the communities that host these institutions.
Download Materials
Endnotes
-
1 This article focuses on private nonprofit colleges that offer bachelor’s or graduate degrees rather than only associate degrees and certificates. These groups are often labelled as “four-year” and “two-year” colleges, respectively.
-
2 While private nonprofit graduate enrollment decreased in fall 2022 relative to fall 2021, data from the National Student Clearinghouse suggest that graduate enrollment once again saw increases in fall 2023 and 2024.
-
3 The U.S. Bureau of Labor Statistics Employment Projections data estimate that in 2024, 5.0 percent of U.S. employment was in occupations that typically required a graduate degree, up from 4.5 percent in 2010. Monarrez and Matsudaira (2023) find that graduate degree attainment among women increased rapidly from 1992 to 2022, far outpacing gains among men and with strong increases among minority women.
Article Citation
Pollard, Emily. 2026. “Private Nonprofit Colleges’ Growing Reliance on Graduate Students May Prove Unsustainable.” Federal Reserve Bank of Kansas City, Economic Bulletin, September 23.
References
Kelchen, Robert, and Faith Barrett. 2024. “External LinkExploring the Growth of Master’s Degree Programs in the United States.” Postsecondary Equity & Economics Research Project, April.
Lane, Patrick, Colleen Falkenstern, and Peace Bransberger. 2024. External LinkKnocking at the College Door: Projections of High School Graduates. Boulder, CO: Western Interstate Commission for Higher Education.
Ma, Jennifer, Matea Pender, and Xiaowen Hu. 2025. External LinkTrends in College Pricing and Student Aid 2025. New York, NY: College Board.
Marcus, Jon. 2017. “External LinkGraduate Programs Have Become a Cash Cow for Struggling Colleges. What Does That Mean for Students?” PBS News, September 18.
Monarrez, Tomás, and Jordan Matsudaira. 2023. “Trends in Federal Student Loans for Graduate School.” U.S. Department of Education, August.
Monarrez, Tomás, Jordan Matsudaira, and Dubravka Ritter. 2025. “External LinkStudent Loans for Graduate School: Who Will Be Affected by the New Federal Lending Limits?” Federal Reserve Bank of Philadelphia, CFI Special Report, December.
Emily Pollard is an associate economist at the Federal Reserve Bank of Kansas City. The views expressed are those of the author and do not necessarily reflect the positions of the Federal Reserve Bank of Kansas City or the Federal Reserve System.
Author