While rural areas may share some common elements, such as low population density and open space, their resource endowments and economic concentrations often differ. Recognizing these differences is important for understanding how and why economic outcomes may vary across the United States and within the Tenth Federal Reserve District._ However, many measures of labor market health do not distinguish between rural and urban areas, let alone between farming-concentrated and non-farming-concentrated rural areas. To account for these differences, the Kansas City Fed’s Center for Agriculture and the Economy has introduced new quarterly Rural Labor Indicators (RLI) comparing labor market outcomes in farming-concentrated counties with outcomes in other parts of the United States. Map 1 shows that these farming-concentrated counties (purple areas) are especially concentrated in the Great Plains and western Corn Belt, including large portions of the Tenth Federal Reserve District.
Map 1: Farming-concentrated counties are mostly in the Great Plains and western Corn Belt
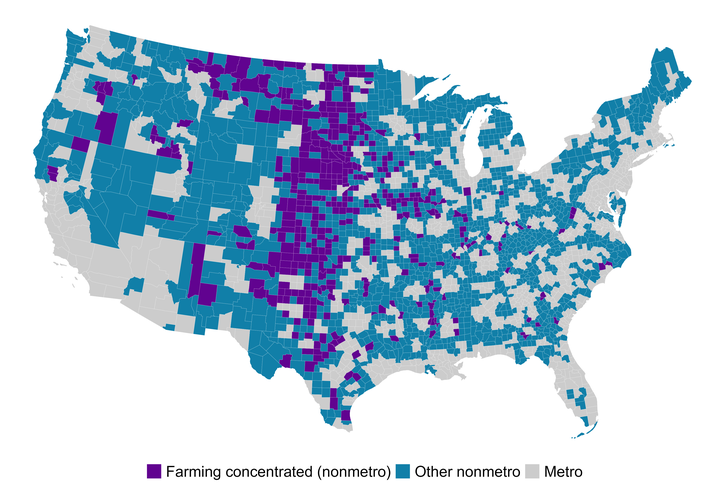
Note: The map shows farming-concentrated, other nonmetro, and metro counties based on the 2025 U.S. Department of Agriculture Economic Research Service (USDA ERS) County Typology Codes.
Source: USDA ERS.
The RLI—which include measures of unemployment, wage growth, and employment growth—show that labor market outcomes indeed differ between farming-concentrated rural counties and other counties in the United States. Using the county classifications shown in Map 1, Chart 1 shows a time series of year-over-year employment growth calculated from the Quarterly Census of Employment and Wages. Prior to each of the last two recessions (gray shaded regions), employment growth was higher in metro counties (green line) than in farming-concentrated counties (purple line) and other nonmetro counties (blue line). However, during the subsequent recessions, employment growth fluctuated much less in farming-concentrated counties. This finding is consistent with prior research showing that labor markets in urban areas are typically more responsive to economic expansions and downturns compared with agricultural regions (Dumont 2024).
Chart 1: Employment growth is often slower in farming-concentrated counties
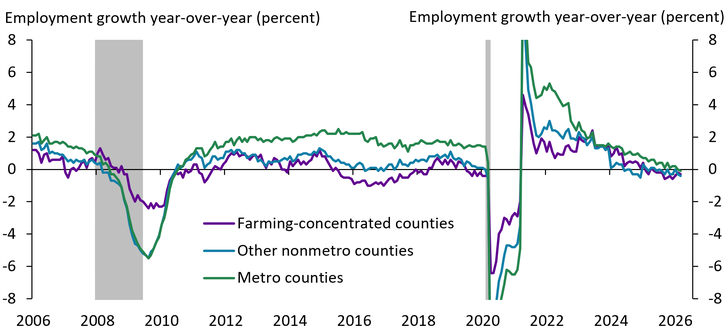
Note: Gray shading indicates National Bureau of Economic Research (NBER)-defined recessions.
Sources: U.S. Bureau of Labor Statistics, USDA, and NBER (Haver Analytics).
The RLI can also reveal differences in the sensitivity of local labor markets to swings in agricultural commodity prices. Chart 2 shows the correlation between an all-farm product price index and three county-specific measures from the RLI—the unemployment rate, employment growth, and wage growth in farming-concentrated counties, other nonmetro counties, and metro counties. Among farming-concentrated counties, farm product prices have a strong negative correlation with the unemployment rate (−0.33, leftmost blue bar). Higher commodity prices tend to put downward pressure on unemployment in areas where farm production occurs. Similarly, farming-concentrated areas have the strongest positive correlation with wage growth (0.19, green bar). When agricultural commodity prices rise, wages in these farming-concentrated areas tend to increase. This positive correlation with wage growth is consistent with prior research on agricultural commodity booms finding that local income increased $0.64 for every $1 of additional crop revenue with no significant effects on employment (Weber and others 2014). In contrast, the correlation between farm product prices and employment growth (−0.05 to 0.11) is much weaker. Although one might expect positive employment growth in these areas when commodity prices are high, additional growth might be limited due to a lack of people to fill jobs in these areas or because one or more members of the farm household often already have off-farm jobs (Farrigan and others 2026; Brown and Weber 2013).
Chart 2: Farm product prices are highly correlated with unemployment and wage growth in farming-concentrated areas
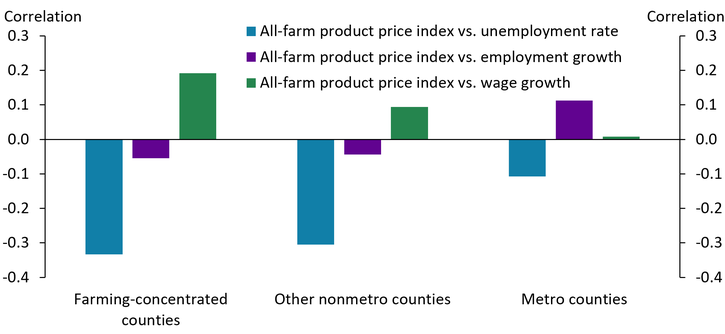
Note: Correlations are calculated using monthly data from January 1990 to August 2026 for unemployment and employment growth and quarterly data from 1991:Q1 to 2026:Q1 for wage growth.
Sources: U.S. Bureau of Labor Statistics (Haver Analytics) and USDA.
Among other nonmetro counties, the correlations between farm product prices and the labor market measures are similar in direction but smaller in magnitude; for metro counties, the correlations are more muted. Metro economies are usually more diversified, meaning fluctuations in agricultural commodity prices have very little influence on their overall labor markets. Although higher commodity prices are often a result of stronger global demand, they tend to act as local demand shocks for farming-concentrated areas, leading to tighter labor markets in the form of lower unemployment and higher wage growth (Erten and Ocampo 2013).
Taken together, these findings underscore why regional differences matter for understanding the U.S. economy—and how the Kansas City Fed’s Rural Labor Indicators can help shed light on these differences, particularly for areas more concentrated in agriculture. Going forward, these data will be compiled and published on the bank’s website through the Center for Agriculture and the Economy on a quarterly basis to better understand and communicate economic developments in rural areas with a focus on agriculture.
Endnotes
-
1 The Tenth Federal Reserve District comprises Colorado, Kansas, Nebraska, Oklahoma, Wyoming, western Missouri, and northern New Mexico.
Article Citation
Brown, Jason P., Nate Kauffman, and Shu-Kuei X. Yang. 2026. "New Rural Labor Indicators from the Kansas City Fed Highlight Key Differences in Farming-Concentrated Counties." Federal Reserve Bank of Kansas City, Economic Bulletin, November 4.
References
Brown, Jason P., and Jeremy G. Weber. 2013. “External LinkThe Off-Farm Occupations of U.S. Farm Operators and Their Spouses.” USDA Economic Research Service, Economic Information Bulletin no. 117, September.
Dumont, Andrew. 2024. “External LinkChanges in the U.S. Economy and Rural-Urban Employment Disparities.” Board of Governors of the Federal Reserve System, FEDS Notes, January 14.
Farrigan, Tracy, Austin Sanders, Lauren Miller, Laura Paul, Richelle L. Winkler, and John Pender. 2026. “External LinkRural America at a Glance: 2025 Edition.” USDA Economic Research Service, Economic Information Bulletin no. 295, January.
Erten, Bilge, and José Antonio Ocampo. 2013. “External LinkSuper Cycles of Commodity Prices Since the Mid-Nineteenth Century.” World Development, vol. 44, pp. 14−30.
Weber, Jeremy G., Conor Wall, Jason P. Brown, and Tom Hertz. 2014. “External LinkCrop Prices, Agricultural Revenues, and the Rural Economy.” Applied Economic Perspectives and Policy, vol. 37, no. 3, pp. 459−476.
Jason Brown is a vice president and economist at the Federal Reserve Bank of Kansas City. Nate Kauffman is Senior Vice President, Omaha Branch Executive, and Director of the Center for Agriculture and the Economy at the Federal Reserve Bank of Kansas City. Shu-Kuei X. Yang is a lead research facilitator at the bank. The views expressed are those of the authors and do not necessarily reflect the positions of the Federal Reserve Bank of Kansas City or the Federal Reserve System.
Authors

Jason P. Brown
Vice President and Economist