Job openings have exceeded the number of unemployed workers in the United States since July 2021, suggesting an extremely tight labor market as the economy emerges from the pandemic-induced recession. Much of the shortfall in the labor force has been attributed to a large decline in labor force participation rates. Labor force participation plummeted in the early stages of the pandemic as many businesses closed, schools moved online, and individuals isolated due to health concerns. Although economic activity has since rebounded sharply and schools and businesses have reopened, labor force participation rates remain well below pre-pandemic levels in most states._
However, labor force participation is not the only contributor to the size of the labor force—population growth is also significant. In particular, the size of the labor force equals the size of the population age 16 and older multiplied by their labor force participation rate. Thus, changes in the size of the labor force can be decomposed into changes in population size and changes in participation rates.
The decomposition in Chart 1 shows that population growth helped offset declining labor force participation in most states between December 2019 and December 2021. The blue bars show that as of December 2021, labor force participation rates remained below pre-pandemic levels in all but three states, putting downward pressure on the size of the labor force. In contrast, the green bars show that the majority of states experienced positive population growth over the past two years, lifting the size of the labor force and helping to offset participation declines. However, the size of these contributions varies across states, leading the overall change in the size of each state’s labor force to vary widely. For some states, the pandemic led to shifts in migration patterns that exacerbated population growth or decline. In New York, for example, population declines exacerbated declines in labor force participation; in contrast, the population of Wyoming increased throughout the pandemic, partly offsetting labor force declines due to lower participation rates. The orange dots show that, on net, the size of the labor force increased in about one-third of states between December 2019 and December 2021 even though labor force participation rates declined in most of those states.
Chart 1: Population growth helped offset declines in labor force participation rates (LFPR) in many states from December 2019 to December 2021
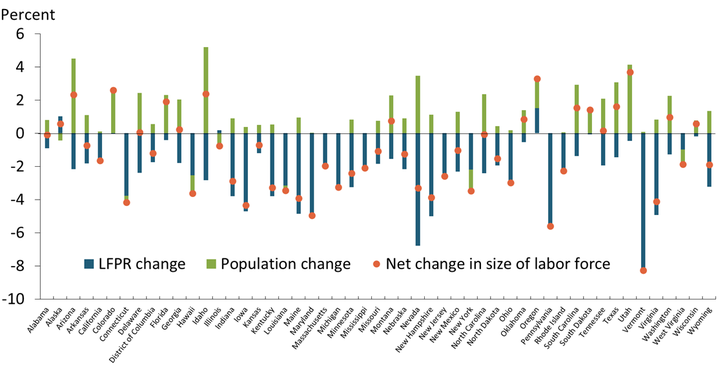
Source: Bureau of Labor Statistics (BLS).
With the size of the labor force still below pre-pandemic levels in most states, many regional leaders have begun exploring how to increase their labor forces. Examining national trends in labor force growth over time may provide some insight into how labor force participation rates might evolve as well as other factors that could influence the size of the labor force in the years to come. Chart 2 shows the annual percent change in the U.S. labor force over the past seven decades, distinguishing between the contributions from population growth (green bars) and from changes in labor force participation rates (blue bars). Although the size of the decline in labor force participation rates during the pandemic was unprecedented, Chart 2 shows that participation rates frequently decline during or immediately following a recession. Moreover, participation rates typically rise during the expansionary periods following these declines as jobs become more plentiful, suggesting that participation rates are likely to rise in the coming years as workers reenter the labor force to fill high levels of job openings._
Chart 2: Over the past seven decades, population growth boosted the size of the labor force while labor force participation rates had varying effects
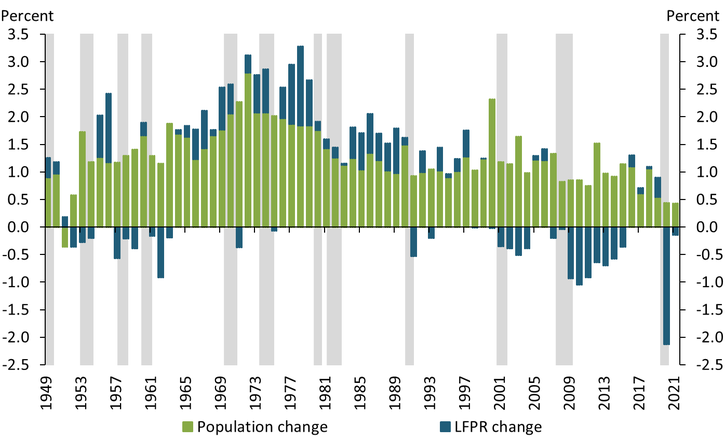
Note: Gray shaded areas denote National Bureau of Economic Research (NBER)-defined recessions.
Sources: BLS and NBER (Haver Analytics).
However, historical data also highlight two longer-term trends that could foretell continued downward pressure on the size of the labor force in the coming years. The first trend to watch is the effect of the baby boom generation on labor force participation rates. Age is a key factor in individuals’ labor force participation: participation rates increase as individuals move into their twenties and then start to decline much later in life as individuals begin to retire. Chart 2 clearly shows the influence from the large baby boom generation: as this generation started to reach their early twenties in the mid-1960s through early 1980s, participation rates increased. By the early 2000s, the oldest baby boomers had reached age 55, and lower participation rates among this cohort have since been putting downward pressure on overall labor force participation rates. This downward pressure may have temporarily accelerated during the pandemic, as many baby boomers may have retired earlier than planned. Even if this temporary rush in retirements leads to fewer retirements over the next couple of years, however, continuing retirements from the baby boom generation are likely to put additional downward pressure on labor force participation rates over the next decade.
The second trend to watch is the slowdown in population growth over the past seven decades. Compared with participation rates, population growth has contributed more consistently to overall labor force growth from year to year. However, the size of this contribution has declined considerably since the youngest baby boomers reached working age. This declining contribution is due primarily to a trend toward lower birth rates. In the early 1950s, there were about 24 births per 1,000 people in the United States. By 2019, the birth rate had fallen by more than half to 11.4 births per 1,000 people. Looking ahead, trends in birth rates will play a large role in the size of the labor force, but migration is also a contributing factor to both population growth and the labor force. At the national level, international migration has contributed positively to population growth over time, though the pace of migration has slowed in recent years.
As states and localities seek to fill job openings and expand their labor forces and regional economies in the years ahead, past national experiences may provide guidance. Women’s mass entrance into the labor force in the 1960s and on into the 1990s provides one historical example of a large upward force on labor force participation rates. The share of women in the overall labor force increased from one-third in 1950 to 46.5 percent by 2000, and the share of dual-earner families in opposite-sex couples with children under 18 increased from 54 percent to 70 percent between 1976 and 1990 (Blau and Winkler 2017).
As populations continue to grow older in most states, several states and localities have started to experience outright population declines as individuals move away and birth rates slow. To expand their labor forces, these regions with aging and declining populations will need to increase participation rates among current residents and seek to attract new residents through domestic or international migration. Investing in initiatives that enhance the appeal of locations either financially or with higher qualities of life may be one way for states to mitigate downward pressures on their labor forces in the future.
Endnotes
-
1 Researchers have pointed to several contributing factors to subdued labor force participation. Briggs (2021) summarizes causes of the decrease in labor force participation such as childcare constraints, excess savings (short term), and shifted work preferences. Nie and Yang (2021) show that the increased share of retirees is not from the conventional employment-to-retirement channel but through a reduction in the flows from retirement to employment, likely due to pandemic-related health concerns. Tüzemen and Tran (2020) conclude that women were disproportionately affected by pandemic-related job losses, and Tüzemen (2021) finds that this loss was largest for women without a college degree, especially minority mothers.
-
2 Hobijn and Şahin (2021) find that cyclical movements in participation rates result in substantial downward pressure on employment during downturns and lagged upward pressure during recoveries, driven by cyclical deteriorations and improvements in job opportunities.
References
Blau, Francine D., and Anne E. Winkler. 2017. “External LinkWomen, Work, and Family.” National Bureau of Economic Research, working paper no. 23644, August.
Briggs, Joseph. 2021. “External LinkUS Daily: Why Isn’t Labor Force Participation Recovering?” Goldman Sachs, November 11.
Goldin, Claudia. 2006. “External LinkThe Quiet Revolution That Transformed Women’s Employment, Education, and Family.” American Economic Review, vol. 96, no. 2, pp. 1–21.
Hobijn, Bart, and Ayşegül Şahin. 2021. “External LinkMaximum Employment and the Participation Cycle.” Macroeconomic Policy in an Uneven Economy. Proceedings of the Federal Reserve Bank of Kansas City, Jackson Hole Economic Policy Symposium, September 4.
Nie, Jun, and Shu-Kuei X. Yang.2021. “External LinkWhat Has Driven the Recent Increase in Retirements?” Federal Reserve Bank of Kansas City, Economic Bulletin, August 11.
Tüzemen, Didem. 2021. “External LinkWomen without a College Degree, Especially Minority Mothers, Face a Steeper Road to Recovery.” Federal Reserve Bank of Kansas City, Economic Review, vol. 106, no. 3, pp. 5–23.
Tüzemen, Didem, and Thao Tran. 2020. “External LinkWomen Take a Bigger Hit in the First Wave of Job Losses due to COVID-19.” Federal Reserve Bank of Kansas City, Economic Bulletin, April 16.
Alison Felix is a senior policy advisor at the Federal Reserve Bank of Kansas City. Samantha Shampine is a research associate at the bank. The views expressed are those of the authors and do not necessarily reflect the positions of the Federal Reserve Bank of Kansas City or the Federal Reserve System.
Author