Since 2015, regulators have required certain banks to hold minimum levels of high-quality liquid assets (HQLA) in an attempt to prevent the acute liquidity shortages that precipitated the 2007–08 financial crisis. Initially, these liquidity regulations increased banks’ demand for central bank reserves, which the Federal Open Market Committee (FOMC) had made plentiful as a by-product of its large-scale asset purchase programs. However, as the FOMC began unwinding these asset purchases and currency demand increased, total excess reserve balances declined more than $1 trillion from their 2014 peak of $2.8 trillion. This decline—coupled with idiosyncratic liquidity needs across banks—may have substantially altered the distribution of reserves across the banking system.
To evaluate how banks have responded to declining reserves, we examine changes in reserve holdings from 2014 to 2019 at the largest banks in the United States. While an individual bank can adjust its level of reserves, the Federal Reserve determines the aggregate level of reserves in the banking system. Therefore, understanding how reserve holdings are distributed across all banks is important to understanding changes in reserve balances at individual banks (Keister and McAndrews 2009).
Chart 1 plots aggregate excess reserve balances held in the master accounts of the largest global, systemically important U.S. banks (GSIBs) and U.S. branches of foreign banking organizations (FBOs) alongside reserve balances held at all other banks, which mostly comprise smaller regional and community banks. The chart shows that following an initial buildup, excess reserves have subsequently declined at GSIBs and FBOs, while excess reserve balances at other smaller banks have fluctuated in a narrow range._
Chart 1: Excess Reserve Balances by Banks
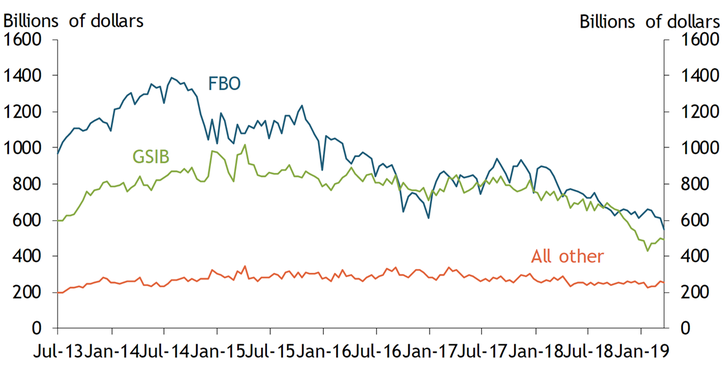
Sources: Board of Governors of the Federal Reserve System and the Federal Financial Institutions Examination Council (FFIEC).
Multiple factors likely drove demand for reserves at FBOs and GSIBs. For large banks, such as GSIBs, liquidity requirements first proposed in 2013 raised the demand for reserves (Ihrig and others 2017). The introduction of interest on excess reserves (IOER) also opened up arbitrage opportunities for banks, increasing their demand for reserve balances._ Because FBOs had lower regulatory costs than GSIBs, FBOs were better able to exploit these arbitrage opportunities, and their initial holdings (as seen in Chart 1) were relatively higher as a result (Banegas and Tase 2016; Keating and Macchiavelli 2018). As excess reserves became less abundant, balances declined across all banks. However, reserve balances declined more steeply at FBOs, as the reduction in reserves was associated with increases in the federal funds rate relative to the IOER rate, reducing IOER-related arbitrage opportunities (Chart 1)._
GSIBs likely substituted other HQLA-eligible assets for reserves to meet regulatory requirements._ Chart 2 shows the composition of HQLA-eligible assets as a share of total assets at GSIBs. Since the implementation of post-crisis liquidity requirements in 2015, the share of HQLA-eligible assets (black line) has remained fairly stable, but the composition of assets has changed. In particular, GSIBs have increased their holdings of Treasuries (yellow line) and, to a lesser extent, agency mortgage-backed securities issued by Ginnie Mae (GNMA; orange line) and Fannie Mae and Freddie Mac (collectively, GSEs; green line) to offset the decline in their reserve holdings._
Chart 2: HQLA-Eligible Assets of GSIBs
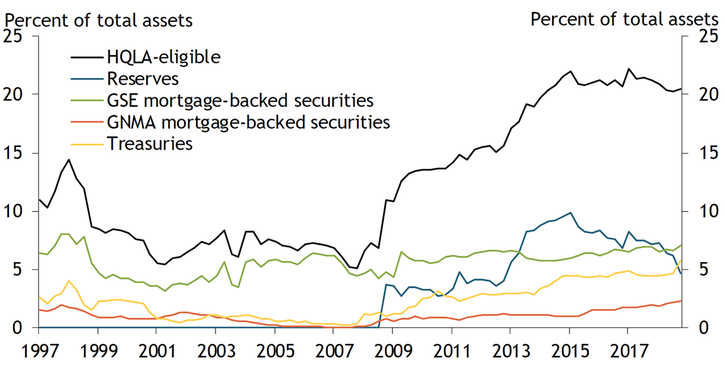
Notes: Chart recreated from Ihrig and others (2017). HQLA asset caps and haircuts are not included in the estimation.
Sources: Board of Governors of the Federal Reserve System and FFIEC.
Despite an overall decline in reserve holdings at GSIBs, changes in asset composition have not been uniform across these banks. Chart 3 breaks down the asset composition further, showing the holdings of HQLA-eligible assets for each of the eight U.S. GSIBs. For each bank, the stacked bar on the left shows holdings of a given asset as a share of total HQLA-eligible assets at the peak of excess reserve holdings in 2014:Q3._ The bar on the right shows the same as of 2019:Q1, the latest quarter for which regulatory filings are available.
Chart 3: Holdings of HQLA Eligible Assets at Individual GSIBs
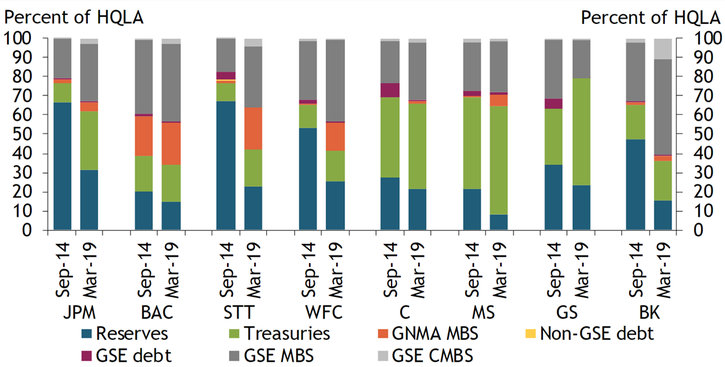
Note: GSIBs include J.P. Morgan Chase and Company (JPM), Bank of America Corporation (BAC), State Street Corporation (STT), Wells Fargo and Company (WFC), Citigroup Inc. (C), Morgan Stanley (MS), The Goldman Sachs Group Inc. (GS), and The Bank of New York Mellon Corporation (BK).
Sources: Board of Governors of the Federal Reserve System and FFIEC.
Consistent with Chart 2, all GSIBs reduced their share of reserves from 2014 to 2019 while increasing their share of Treasuries. However, as Chart 3 shows, the composition of HQLA-eligible assets across banks differed widely both when reserve balances were at their peak and more recently. For example, in 2014, some banks held nearly 70 percent of their HQLA-eligible assets as reserves, while others held less than 20 percent. Today, those extreme shares have declined significantly, but some banks still hold as much as 30 percent of HQLA-eligible assets as reserves while others hold only limited amounts.
Selecting the optimal mix of HQLA-eligible assets is not a trivial exercise for an individual bank, and bank business models alone do not explain differences in HQLA-eligible asset holdings. More traditional banks that take retail deposits and make loans are no more likely to hold reserves than banks that focus mostly on trading or custodial activities, such as facilitating large and liquid transaction accounts. Instead, each bank faces a complex portfolio choice problem when determining its current and future mix of HQLA-eligible assets (Ihrig and others 2017). Even among HQLA-eligible assets, safer and more liquid assets, such as Treasuries, yield relatively lower returns than more illiquid assets, such as mortgage-backed securities. Moreover, holding any security, as opposed to reserves, exposes a bank to interest rate risk and asset price fluctuations that may impair its regulatory capital._ Given these considerations, the mix of HQLA-eligible assets likely varies with idiosyncratic differences across banks. For example, idiosyncratic differences in individual banks’ sensitivity to changes in relative prices (spread between IOER and the federal funds rate) likely drive differences in reserve demand. While reserves declined for all banks, reserve demand appears to be more sensitive to changes in relative prices at some banks than at others.
Overall, our results suggest the drivers of demand for reserves across banks are not uniform. We find that global banks operating in the United States that initially held the majority of reserves—specifically, GSIBs and FBOs—have accordingly seen the greatest reductions in their reserve holdings as monetary policy accommodation has been withdrawn. We also find considerable differences in how GSIBs have adjusted their HQLA-eligible holdings as reserves have declined. Variations in asset holdings across banks likely depend on some combination of the initial distribution of reserves and each bank’s business model and macroeconomic outlook.
Endnotes
-
1 Data confidentiality restrictions do not allow us to assign reserve balances held in correspondent accounts to any particular bank. However, attributing these balances entirely to non-GSIB and FBO banks (“all other”) does not materially change the result shown in Chart 1.
-
2 The prevailing post-crisis regulatory regime allowed banks to deposit borrowings at the Federal Reserve and earn the spread between the IOER rate and the effective federal funds rate. See Banegas and Tase (2016) for more details.
-
3 For a discussion of the correlation between reserve balances and the IOER-Fed Funds rate spreads see Smith (2019).
-
4 Under the liquidity coverage ratio, reserves, Treasuries, Ginnie Mae (GNMA) guaranteed mortgage-backed securities and agency debt are considered level 1 assets, while mortgage-backed securities issued by government-sponsored entities (GSEs) and GSE debt are considered level 2A assets. Some assets—for example, the mortgage-backed securities and debt securities issued by GSEs—have limits and haircuts on their usage as HQLAs. See Ihrig and others (2017) for details on the list of assets allowed under HQLA and limits and haircuts therein.
-
5 Actual HQLA holdings at banks are calculated after imposing the aforementioned limits and haircuts on HQLA-eligible assets. In the last two years, banks have been substituting reserves (which have no haircut) with other assets, such as GSE debt or mortgage-backed securities (which have a 15 percent haircut). As a result, reported shares of HQLA holdings are declining at GSIBs even though the share of HQLA-eligible assets has remained stable.
-
6 Note that for confidentiality reasons, reserves at individual banks are estimated using balances due from the Federal Reserve Banks from the Call Reports.
-
7 To reduce regulatory capital losses, GSIBs have increasingly moved securities holdings to held-to-maturity status, which shields capital from fluctuations in securities prices. The ratio of HQLA-eligible securities reported as held to maturity to total HQLA-eligible securities at GSIBs has increased from insignificant levels at the start of the crisis to well above 20 percent in recent quarters.
References
Banegas, Ayelen, and Manjola Tase. 2016. “External LinkReserve Balances, the Federal Funds Market and Arbitrage in the New Regulatory Framework.” Board of Governors of the Federal Reserve System, Finance and Economics Discussion Series 2016-079, September 1.
Ihrig, Jane, Edward Kim, Ashish Kumbhat, Cindy M. Vojtech, and Gretchen C. Weinbach. 2017. “External LinkHow Have Banks Been Managing the Composition of High-Quality Liquid Assets?” Board of Governors of the Federal Reserve System, Finance and Economics Discussion Series 2017-092, August 6.
Keating, Thomas, and Marco Macchiavelli. 2018. “External LinkInterest on Reserves and Arbitrage in Post-Crisis Money Markets.” Board of Governors of the Federal Reserve System, FEDS Notes, March 1.
Keister, Todd, and James J. McAndrews. 2009. “External LinkWhy Are Banks Holding So Many Excess Reserves?” Federal Reserve Bank of New York, Current Issues in Economics and Finance, vol. 15, no. 8, pp. 1–10.
Smith, A. Lee. 2019. “How Many Reserves Does the Federal Reserve Need to Supply?” Federal Reserve Bank of Kansas City, Economic Bulletin, March 6.
W. Blake Marsh and Rajdeep Sengupta are economists at the Federal Reserve Bank of Kansas City. Jacob Dice, a research associate at the bank, helped prepare the article. The authors thank without implication Mary-Frances Styczynski and Brad Wampler, at the Board of Governors of the Federal Reserve System and the Federal Reserve Bank of Kansas City, respectively, for their help with the reserves data. The views expressed are those of the authors and do not necessarily reflect the positions of the Federal Reserve Bank of Kansas City or the Federal Reserve System.
Authors

W. Blake Marsh
Senior Economist