The economy is always subject to unexpected shocks. As a result, policymakers examine predictions of macroeconomic variables not only to determine the most likely outcome in the future but also to gauge how unexpected events might alter these outcomes. Assessing the risk of extreme outcomes (or “tail events”) of the future unemployment rate is now particularly relevant for participants of the Federal Open Market Committee (FOMC). Although the unemployment rate in the United States is at a historically low level, some FOMC participants consider the risk that the economy will fare worse than expected when assessing the appropriate stance for monetary policy (see, for example, Clarida 2019).
We try to quantify the risk of unexpectedly high unemployment conditional on current economic and financial conditions—as well as how this risk varies over time. Quantifying risks requires us to characterize the probability of various potential outcomes. Rather than assuming the probability distribution of these outcomes will follow a normal distribution, we use a quantile regression framework, which can be valid even when the underlying distribution does not follow a normal distribution. The quantile function is equivalent to a probability distribution, as there is a one-to-one mapping between them._ For example, the 50th quantile plotted in Chart 1 is equivalent to the median value of the unemployment rate in the distribution, suggesting the probability of actual unemployment being lower than 5.5 percent is 50 percent.
Chart 1: Cumulative Distribution of the Unemployment Rate, 1992:Q1–2018:Q4
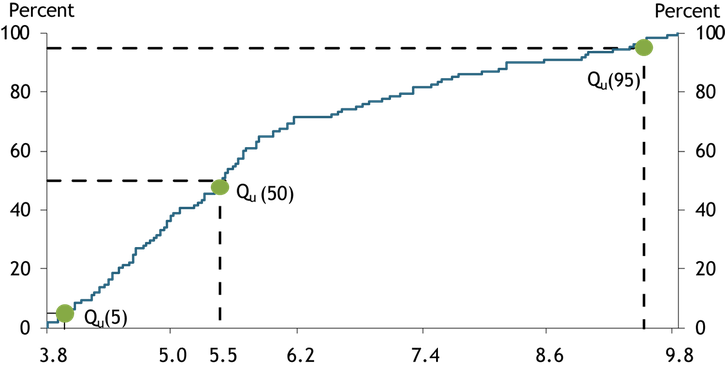
Source: Authors’ calculations.
The horizontal distance between the fifth and 50th quantiles in Chart 1 is much shorter than the horizontal distance between the 50th and 95th quantiles, meaning the risk of unexpectedly high unemployment is greater than the risk of unexpectedly low unemployment. A linear quantile regression framework developed by Koenker (2005) provides a convenient tool to model a probability distribution with such asymmetric risks. We run the following linear quantile regression on the τ-th quantile of the change in the unemployment rate in the near term (one year) and the medium term (two or three years) conditional on five variables characterizing current macroeconomic and financial conditions (Xt):
𝑄{𝑢{𝑡+ℎ}−𝑢{𝑡} } (𝜏|𝑋𝑡) = 𝜃0 + 𝜃1𝑋t.
The five variables consist of two labor market indicators (two factors from the Labor Market Conditions Indicators published by the Federal Reserve Bank of Kansas City, KC Fed LMCI hereafter), two credit market variables (the growth in nonfinancial private-sector credit divided by GDP over four years and the spread between BBB-rated corporate bond yields and 10-year Treasury bond yields), and the change in the quarterly personal consumption expenditures price index over the year (PCE inflation)._
Following recent research by Adrian and others (2019) suggesting financial market variables are particularly useful in identifying medium-term risks to real GDP growth, we focus on the three-year-ahead risk assessment from the quantile regressions. Chart 2 shows the three quantile (fifth, 50th, and 95th) values of the three-year-ahead unemployment rate from 1992:Q1 to 2018:Q4 along with the actual unemployment rate over that period from the Bureau of Labor Statistics._ For most of that time, the risk of unemployment running higher than the median projection, as measured by the difference between the 95th and 50th quantiles, is bigger than the risk of unemployment running lower than the median projection, as measured by the difference between the 50th and the fifth quantiles, though the gap between two risks narrows during recent years as the actual unemployment rate substantially declines.
Chart 2: Three-Year-Ahead Unemployment Rate (LMCI, Credit Market and Consumption Indicators)
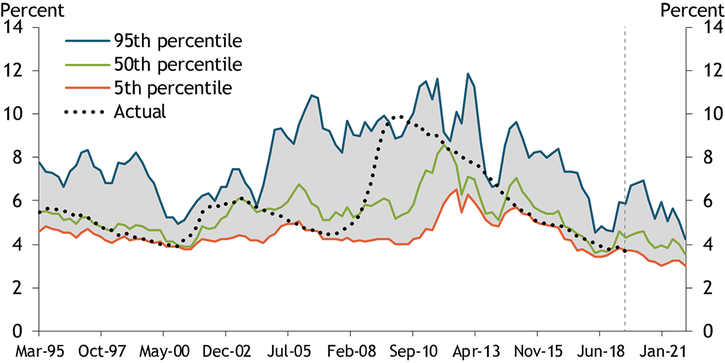
Note: The vertical dashed line represents the last data point available for the unemployment rate (2019:Q2).
Sources: Bureau of Labor Statistics (Haver Analytics) and authors’ calculations.
When we leave inflation and credit market variables out of the quantile regressions and use only the KC Fed LMCI, the risk assessment changes. Chart 3 shows that the risk of unemployment higher than the median projection remains higher than the risk of unemployment lower than the median projection even when the unemployment rate declines. In fact, the risk of unexpectedly high unemployment increases at a lower level of the unemployment rate. However, the disparity between the two estimates is somewhat exaggerated by abrupt changes in the estimated quantile regression coefficients between the 87th and 91st quantiles (not shown). In fact, the probability that the unemployment rate will rise above 4.2 percent by 2021—the median estimate in the FOMC’s June 2019 Summary of Economic Projections—is 15 percent in our baseline model and 17 percent in the model using only the KC Fed LMCI factors. This probability represents a rapid decline in the risk of unexpectedly high unemployment in a relatively short amount of time. As recently as 2017:Q3, the model predicted a greater than 50 percent probability that the unemployment rate would rise above 4.2 percent by 2020. In sum, the risks of higher-than-expected unemployment tend to decline at a low level of the unemployment rate under both specifications, but the magnitude of the decline is lower—and the extreme outcome much worse—when we ignore information from inflation and credit market variables.
Chart 3: Three-Year-Ahead Unemployment Rate (LMCI Only)
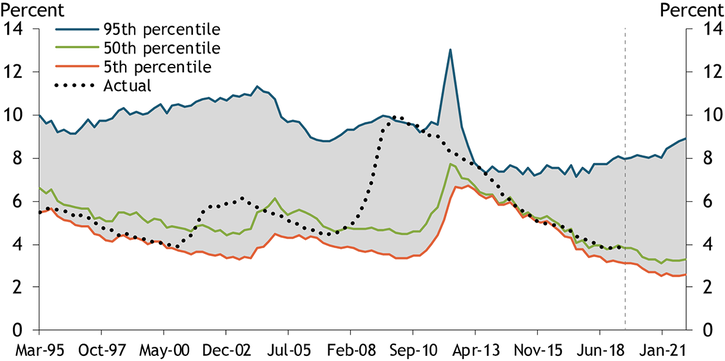
Note: The vertical dashed line represents the last data point available for the unemployment rate (2019:Q2).
Sources: Bureau of Labor Statistics (Haver Analytics) and authors’ calculations.
To compare the forecast accuracy of the two models, we rank the two models based on the magnitude of the quantile prediction error (not shown) of each specification. The quantile prediction errors from different specifications show that including inflation and credit market variables improves prediction accuracy from the 85th to the 99th quantiles._
Overall, our results show that the risk of unexpectedly high unemployment three years in the future has fluctuated significantly over time but decreased more recently. Generally, this risk decreases when the unemployment rate is low but increases when the unemployment rate is high. In addition, we find that using inflation and credit market variables in the regression as well as labor market indicators provides more stable estimates of the upper quantiles of the future unemployment rate. According to this specification, the medium-term risk of unexpectedly high unemployment is rather limited.
Endnotes
-
1 While equivalent, the quantile function is more tractable to model than the probability distribution, especially when we want to characterize the probability distribution conditional on time-varying variables without assuming future economic shocks follow a restrictive normal distribution.
-
2 Our specification is similar to Kiley (2018), except that we replace the current-quarter unemployment rate with two factors from the KC Fed LMCI, which incorporate information from a variety of labor market indicators such as survey and wage data as well as the unemployment rate. In addition to the LMCI, variables come from the Bank for International Settlements, the Bureau of Economic Analysis, and the Board of Governors of the Federal Reserve System.
-
3 Because the nonfinancial private credit data that we use is available only through 2018, our last prediction is 2018:Q4.
-
4 We evaluate prediction errors using a check loss function error, which is the objective function to be minimized at quantile regressions as explained by Koenker (2005). Mean check loss function errors are lower when we include inflation and credit market variables for the upper 15 quantiles (85th–99th) except for the 93rd–95th quantiles. While the spike in the unemployment rate in 2009 may appear to be slightly better predicted by the 95th quantile regression using only the LMCI factors, this better fit is partly due to the overall upward bias of this specification. For the full sample period, this specification does not meaningfully improve quantile prediction accuracy.
References
Adrian, Tobias, Nina Boyarchenko, and Domenico Giannone. 2019. “External LinkVulnerable Growth.” American Economic Review, vol. 109, no. 4, pp. 1263–89.
Clarida, Richard H. 2019. “External LinkSustaining Maximum Employment and Price Stability.” Speech at the Economic Club of New York, New York, NY, May 30.
Kiley, Michael T. 2018. “External LinkUnemployment Risk.” Finance and Economics Discussion Series 2018-067. Washington: Board of Governors at the Federal Reserve System, September 13.
Koenker, Roger. 2005. “External LinkQuantile Regression.” Econometric Society Monograph, Cambridge University Press.
Thomas R. Cook is a data scientist at the Federal Reserve Bank of Kansas City. Taeyoung Doh is a senior economist at the bank. Jaeheung Bae, a research associate at the bank, helped prepare the article. The views expressed are those of the authors and do not necessarily reflect the positions of the Federal Reserve Bank of Kansas City or the Federal Reserve System.
Authors

Thomas R. Cook
Data Scientist