Charting the Economy

Timely economic data curated by research staff at the Federal Reserve Bank of Kansas City. Click the link button in the chart title to copy and share.


Filters
Agriculture AI Banking and Finance Covid-19 Research Data and Trends Economic Geography Energy Housing Inflation International Jackson Hole Economic Policy Symposium Labor and Demographics Macroeconomics Manufacturing Monetary Policy Natural Resources and Environment Payments Regional Clear Filters
CtE26-BiVasiljevic

Geopolitical News May Have Played a More Important Role in the Recent Rise of the 10-Year Treasury Yield than Other Factors
Charting the Economy | Banking and Finance | Macroeconomics | Monetary Policy
CtE26-Cohen

In the Post-Pandemic Era, Many Small Firms Report Labor Scarcity Even in the Absence of Strong Expansionary Plans
Charting the Economy | Data and Trends | Labor and Demographics
CtE26-Routh

Tokenized Treasuries Are Growing Quickly, but Safe Tokenized Cash to Settle Them Lags Behind
Charting the Economy | Banking and Finance | Macroeconomics | Payments
CtE26-KropfHill

Strength in “Comfort Food” Manufacturing Is Changing the Food Manufacturing Landscape in Kansas and Missouri
Charting the Economy | Labor and Demographics | Manufacturing | Regional
CtE26-Brown

Higher Fuel Prices Point Toward Higher One-Year-Ahead Inflation Expectations
Charting the Economy | Energy | Inflation
CtE26-McCoy2

Improving Labor Force Participation Among Gen Z Is Partially Offsetting Baby Boomer Retirements
Charting the Economy | Labor and Demographics
CtE26-McCoy

In Recent Years, an Increased Share of Tenth District Firms Report Absorbing Higher Input Costs
Charting the Economy | Data and Trends | Inflation | Manufacturing | Regional
CtE26-MatschkedeVyver

The Rising Popularity of Stablecoins Could Reinforce the Global Role of the U.S. Dollar
Charting the Economy | Banking and Finance | International
CtE26-HirnerMustre-del-Rio

Credit Card Delinquencies Are Becoming More Widespread Across the U.S. Population

Charting the Economy | Banking and Finance | Macroeconomics | Monetary Policy | Payments
Load More

Geopolitical News May Have Played a More Important Role in the Recent Rise of the 10-Year Treasury Yield than Other Factors

By Huixin Bi and Stephen D. Vasiljevic

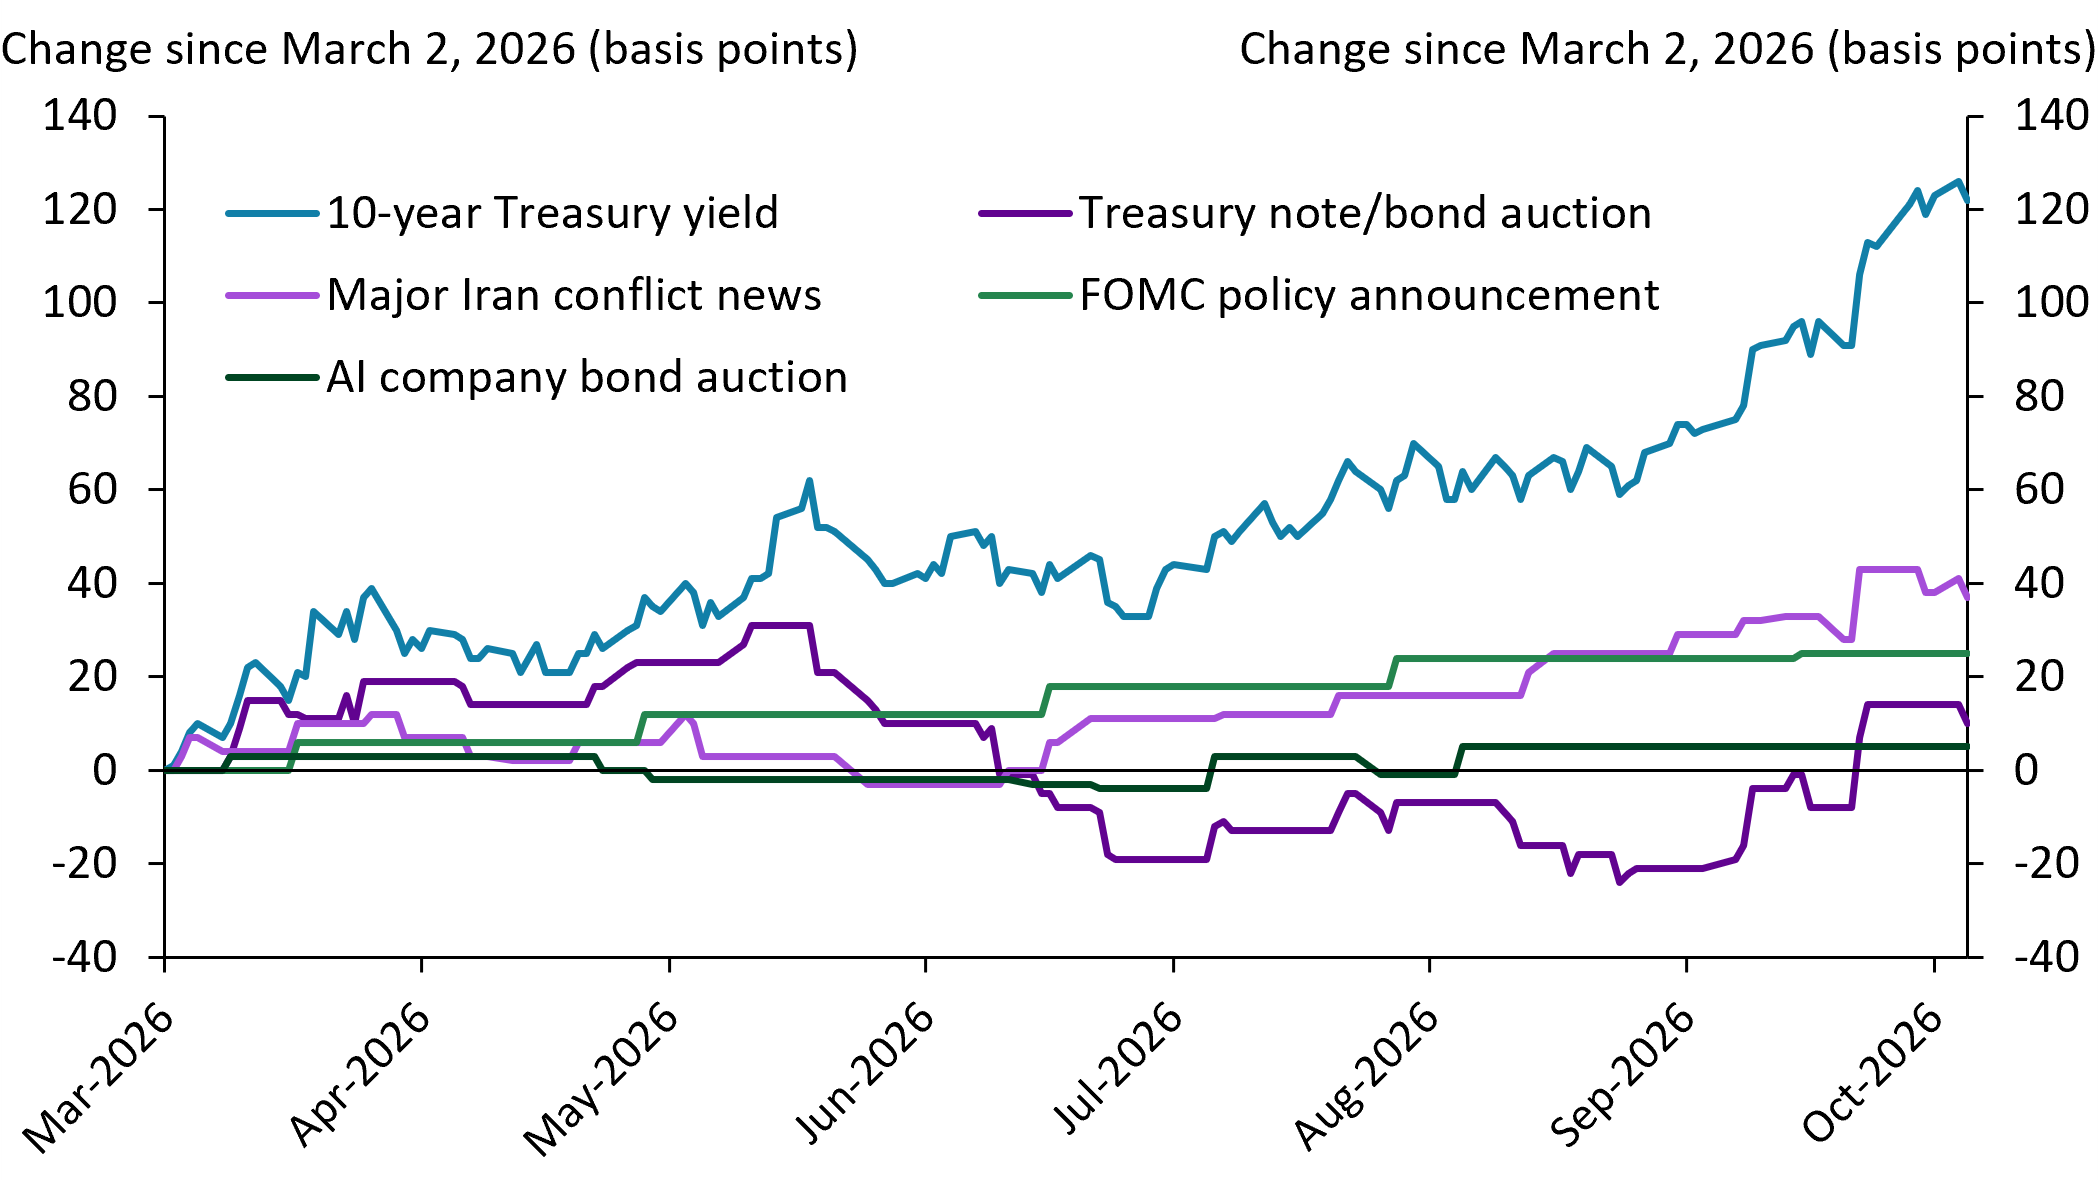
Since March 2, 2026, the 10-year Treasury yield has increased by more than 120 basis points. News about Iran conflict accounts for roughly 40 basis points or about one-third of that increase. On days with FOMC policy announcements, the yield rose a combined 25 basis points. Cumulative move on days with large AI company bond auctions and on days with Treasury note and bond auctions have been more muted.

Notes: Blue line shows changes in 10-year Treasury yield since March 2, 2026. Other lines are constructed by accounting only for the yield changes that were realized in the one-day window around the corresponding events (FOMC policy announcement for the light green line, major Iran conflict news for the light purple line, Treasury note and bond auctions for the dark purple line, and AI company bond auctions for the dark green line).
Sources: Board of Governors of the Federal Reserve System (Haver Analytics), Federal Reserve Bank of New York, Bloomberg, and authors’ calculations.

Since March 2, 2026, the 10-year Treasury yield (blue line) has increased significantly, by more than 120 basis points. In examining yield changes occurring within a one-day window around certain events, news about the Iran conflict (light purple line) has accounted for roughly 40 basis points or about one-third of the total increase in the 10-year yield. On days with FOMC policy announcements (light green line), the yield rose a combined 25 basis points. Cumulative moves in the 10-year yield have been more muted on days with large AI company bond auctions (dark green line) and on days with Treasury note and bond auctions (dark purple line), suggesting that these factors have played a smaller role.

Charting the Economy Banking and Finance Macroeconomics Monetary Policy

In the Post-Pandemic Era, Many Small Firms Report Labor Scarcity Even in the Absence of Strong Expansionary Plans

By Elior Cohen

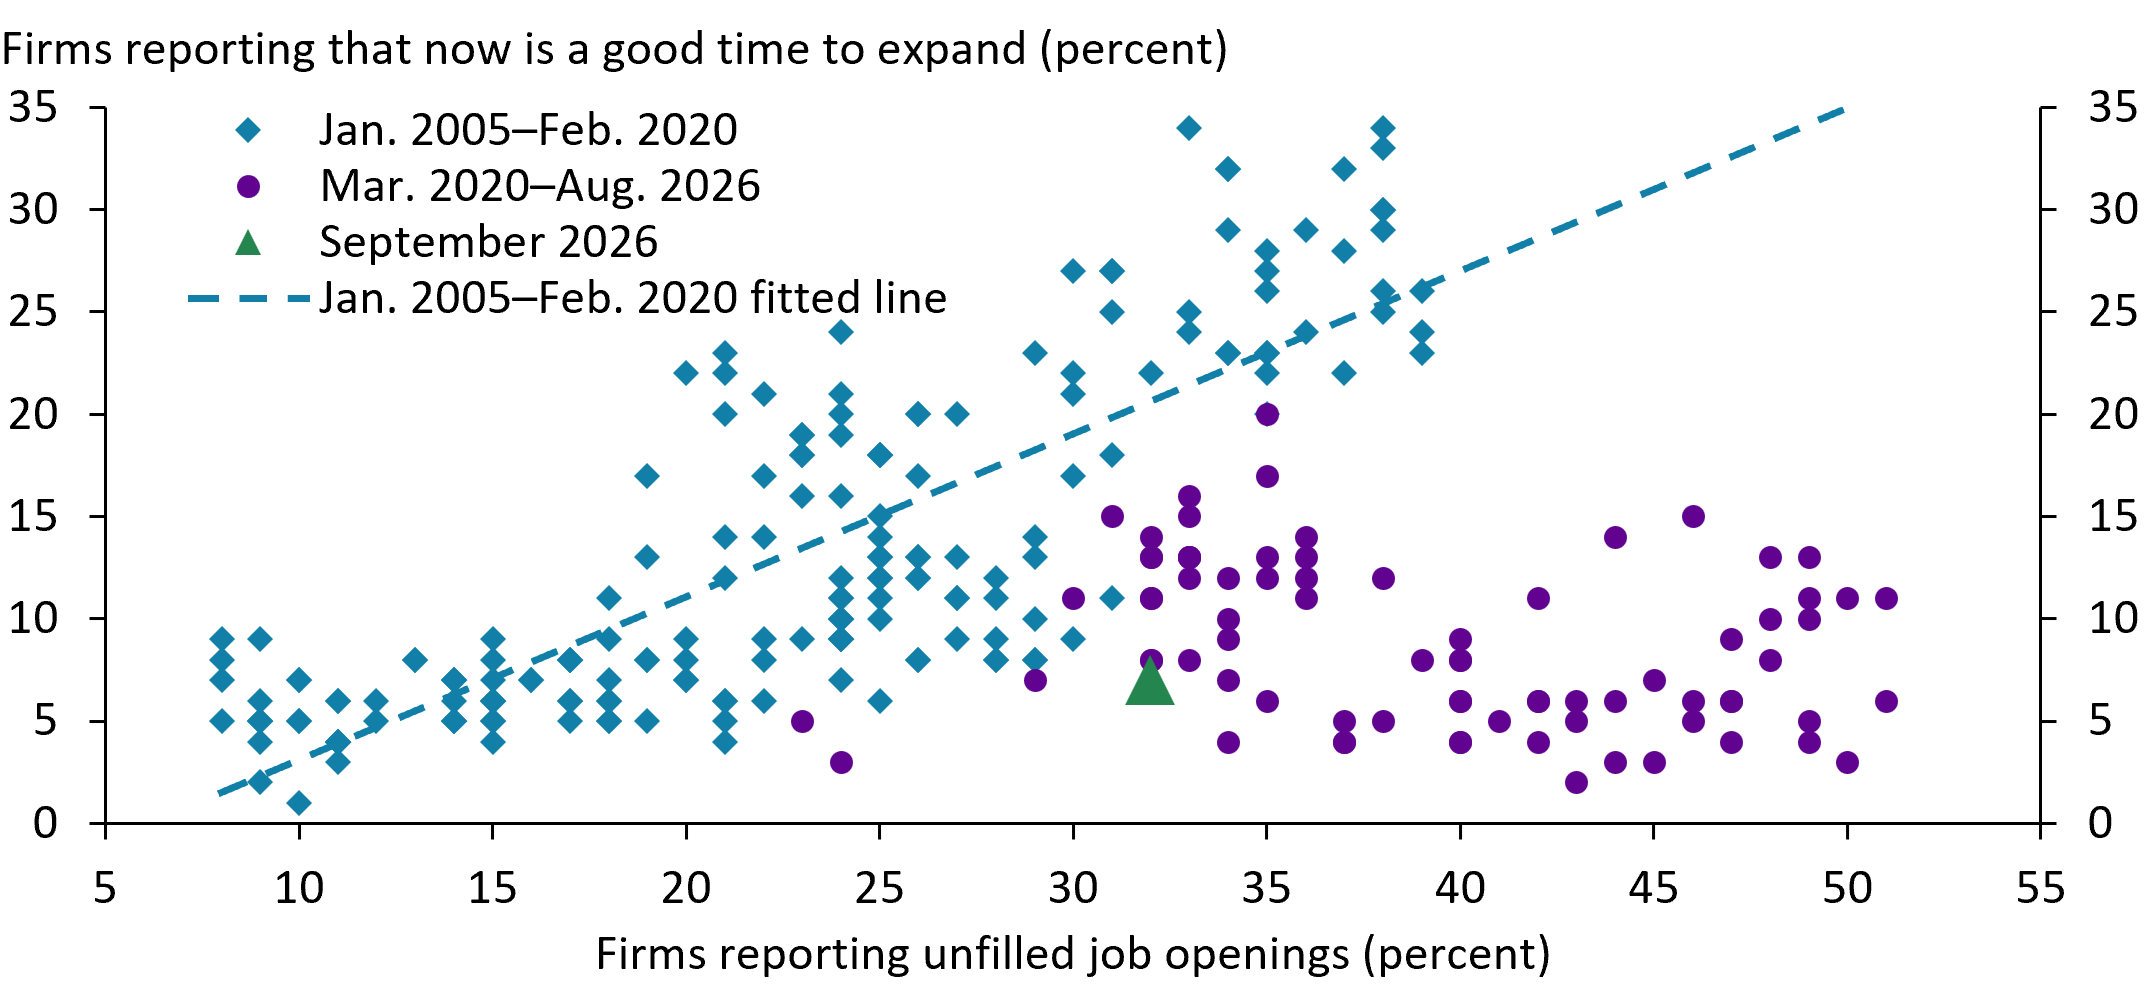
Chart is a scatter plot of monthly NFIB data from 2005 to September 2026 showing the relationship between unfilled job openings and whether small businesses say now is a good time to expand. Pre-COVID observations show a positive relationship, while post-COVID observations generally lie below the pre-COVID fitted trend. In September 2026, 32 percent of firms reported unfilled openings but only 7 percent said it was a good time to expand.

Notes: Each point represents one month. Pre-COVID observations cover January 2005–February 2020; post-COVID observations cover March 2020–September 2026. The dashed line shows the fitted relationship between the percentage of firms reporting unfilled job openings and the percentage reporting that now is a good time to expand, using pre-COVID observations only.

Sources: National Federation of Independent Business (Haver Analytics) and author’s calculations.

Before 2020, the share of small businesses reporting unfilled job openings was higher when a higher share of firms indicated that it was a good time to expand (blue diamonds and fitted line in the chart). Since the pandemic (purple dots), that relationship has broken down. In September 2026 (green triangle), 32 percent of small businesses reported unfilled job openings, but only 7 percent said it was a good time to expand—well below the roughly 21 percent implied by the pre-pandemic relationship. This divergence suggests that elevated job openings may no longer signal the same degree of strength in small-business activity as they did before the pandemic.

Charting the Economy Data and Trends Labor and Demographics

Tokenized Treasuries Are Growing Quickly, but Safe Tokenized Cash to Settle Them Lags Behind

By Aditi Routh

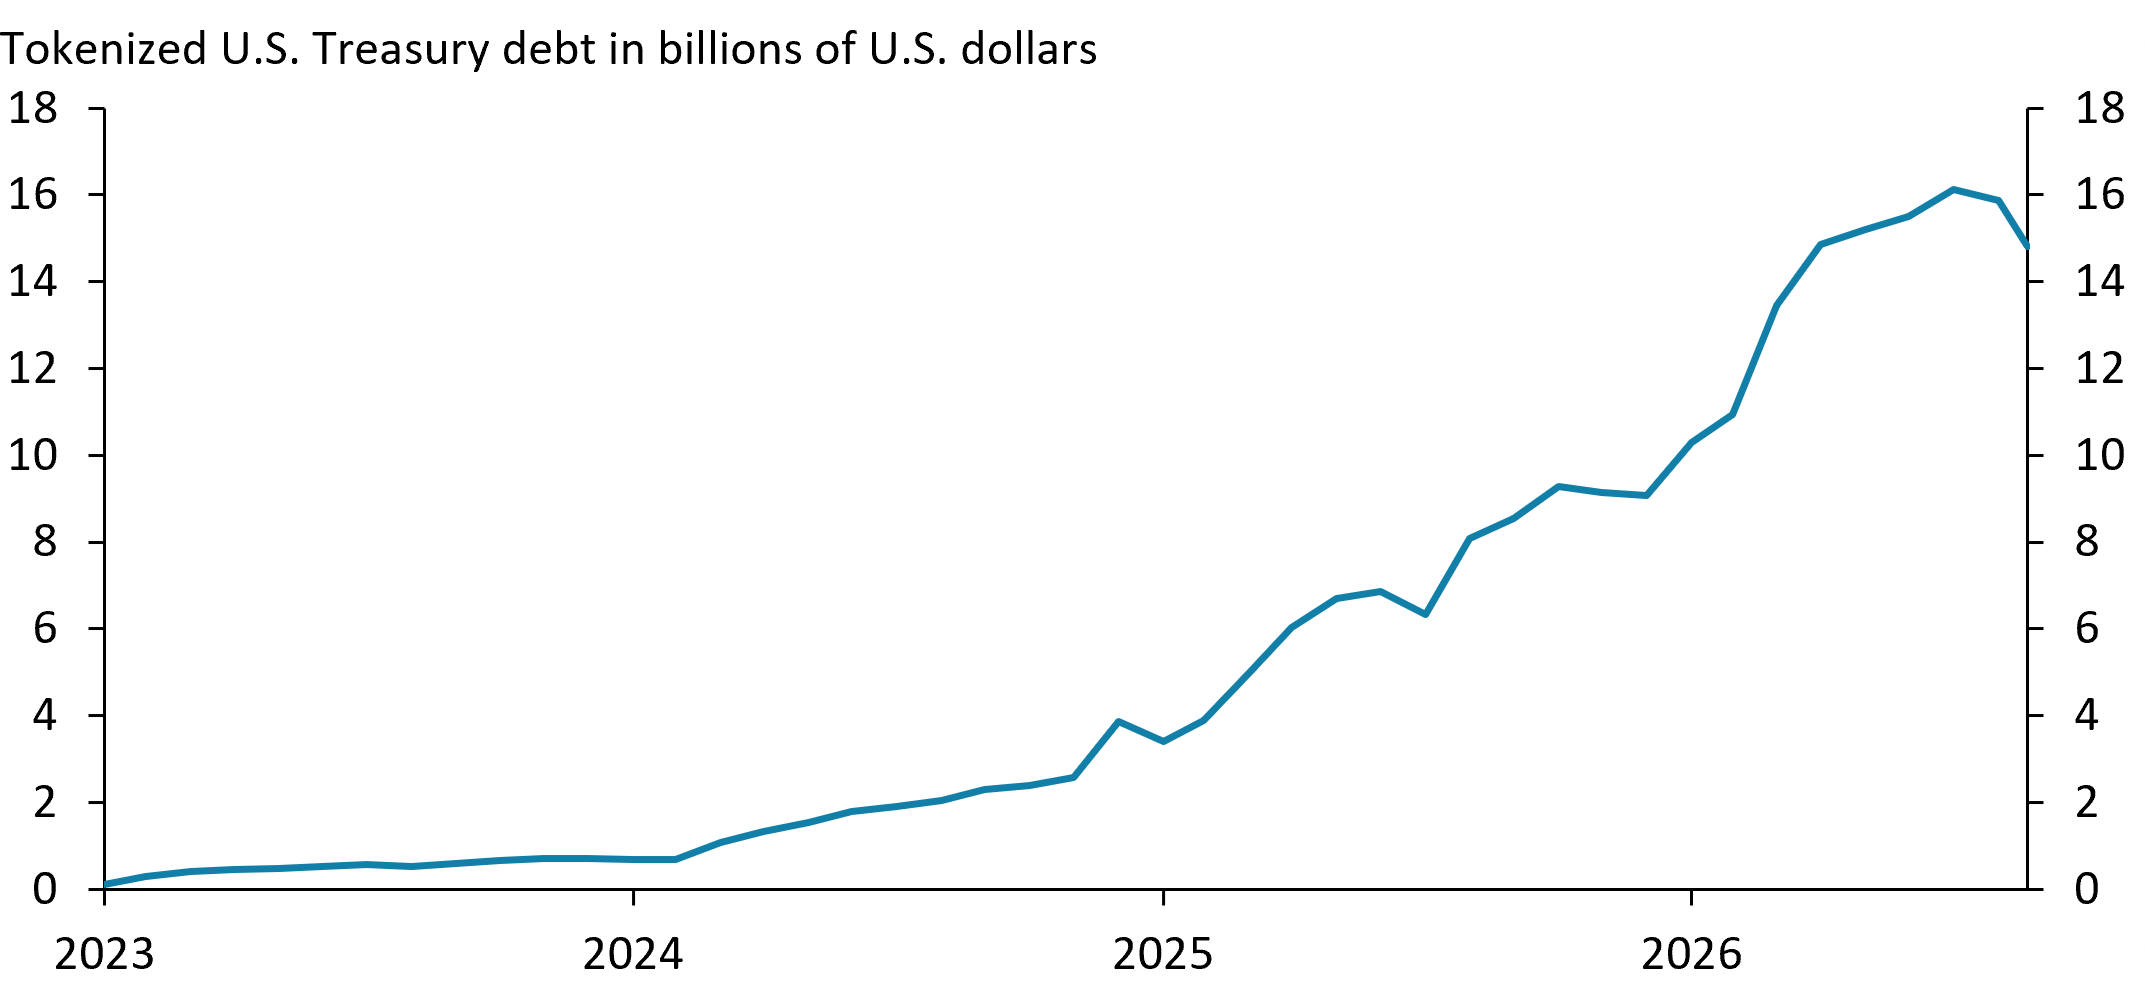
The chart shows that tokenized U.S. Treasury funds grew from $0.1 billion in early 2023 to a peak of about $16 billion in July 2026 before easing to $15 billion in September 2026.

Notes: Chart shows month-end total value of tokenized U.S. Treasury securities from January 2023 to September 20, 2026, including tokenized money market funds that invest in Treasury securities. Values are on RWA.xyz’s distributed basis, which counts tokens that circulate on public blockchains.

Sources: RWA.xyz (accessed September 20, 2026) and author’s calculations.

Download the data file for this chart.

Tokenized U.S. Treasury funds, recorded on public blockchains, grew from $0.1 billion in early 2023 to a peak of about $16 billion in July 2026 before easing to $15 billion in September. Darrell Duffie's 2026 Jackson Hole paper suggests that further growth may be limited by the absence of safe settlement money. Trading or borrowing against tokenized Treasuries requires cash on the same ledger (or blockchain), such as tokenized central bank reserves. Although some central banks have experimented with tokenized reserves, they are not yet widely available. The available alternatives—stablecoins and tokenized commercial bank deposits—are not safe enough to settle transactions at the core of the financial system, Duffie argues, because they are claims on private issuers rather than the central bank.

Related Content

Jackson Hole Economic Policy Symposium

The Federal Reserve Bank of Kansas City hosts dozens of central bankers, policymakers, academics and economists from around...

Charting the Economy Banking and Finance Macroeconomics Payments

Strength in “Comfort Food” Manufacturing Is Changing the Food Manufacturing Landscape in Kansas and Missouri

By Becky Kropf and Jeremy Hill

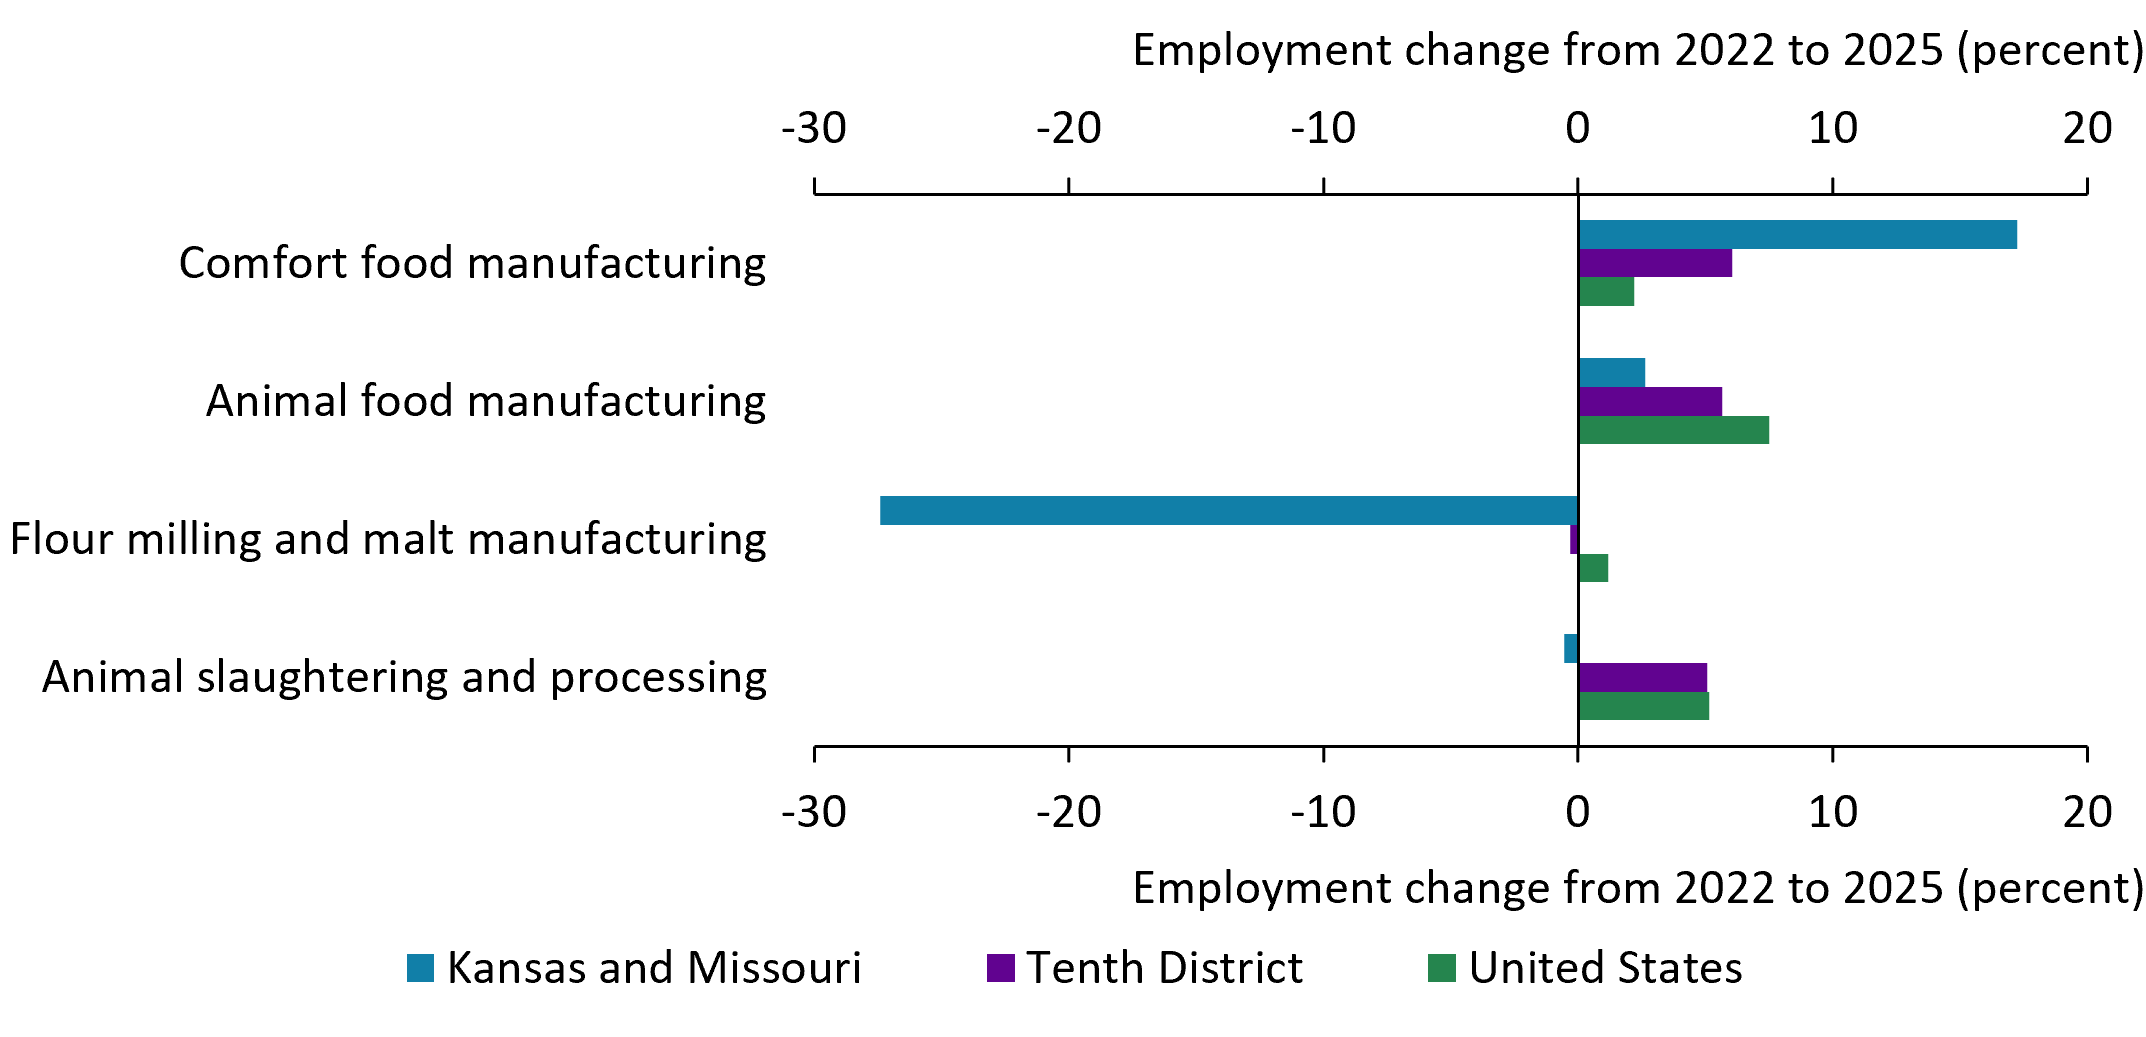
The chart shows that employment in comfort food industries in Kansas and Missouri rose 17.2 percent from 2022 to 2025, outpacing the nation and other regional states.

Notes: Tenth District bars show employment growth for all states in the Federal Reserve’s Tenth District (Colorado, Nebraska, Oklahoma, Wyoming, and parts of New Mexico) excluding Kansas and Missouri. Comfort food sectors include breakfast cereal, chocolate and confectionery, frozen food, ice cream and frozen desserts, and starch and vegetable fats. The other three industries provided are the food manufacturing industries that Kansas and Missouri are most concentrated in.

Sources: Kansas Department of Labor, Missouri Economic Research and Information Center, Lightcast, and authors’ calculations.

Kansas and Missouri are experiencing a significant shift in their food manufacturing landscape. While total food manufacturing employment in Kansas and Missouri increased only 4.4 percent over the past three years, the chart shows that employment in comfort food industries in these states rose 17.2 percent (blue bar) over the same period, outpacing the nation (green bar) and other regional states (purple bar). In 2025, comfort food manufacturing accounted for 12.6 percent of food manufacturing and 10,704 jobs in Kansas and Missouri. This concentration and strong growth in comfort food manufacturing may reshape the two states’ competitive advantage in food manufacturing.

Charting the Economy Labor and Demographics Manufacturing Regional

Higher Fuel Prices Point Toward Higher One-Year-Ahead Inflation Expectations

By Jason P. Brown

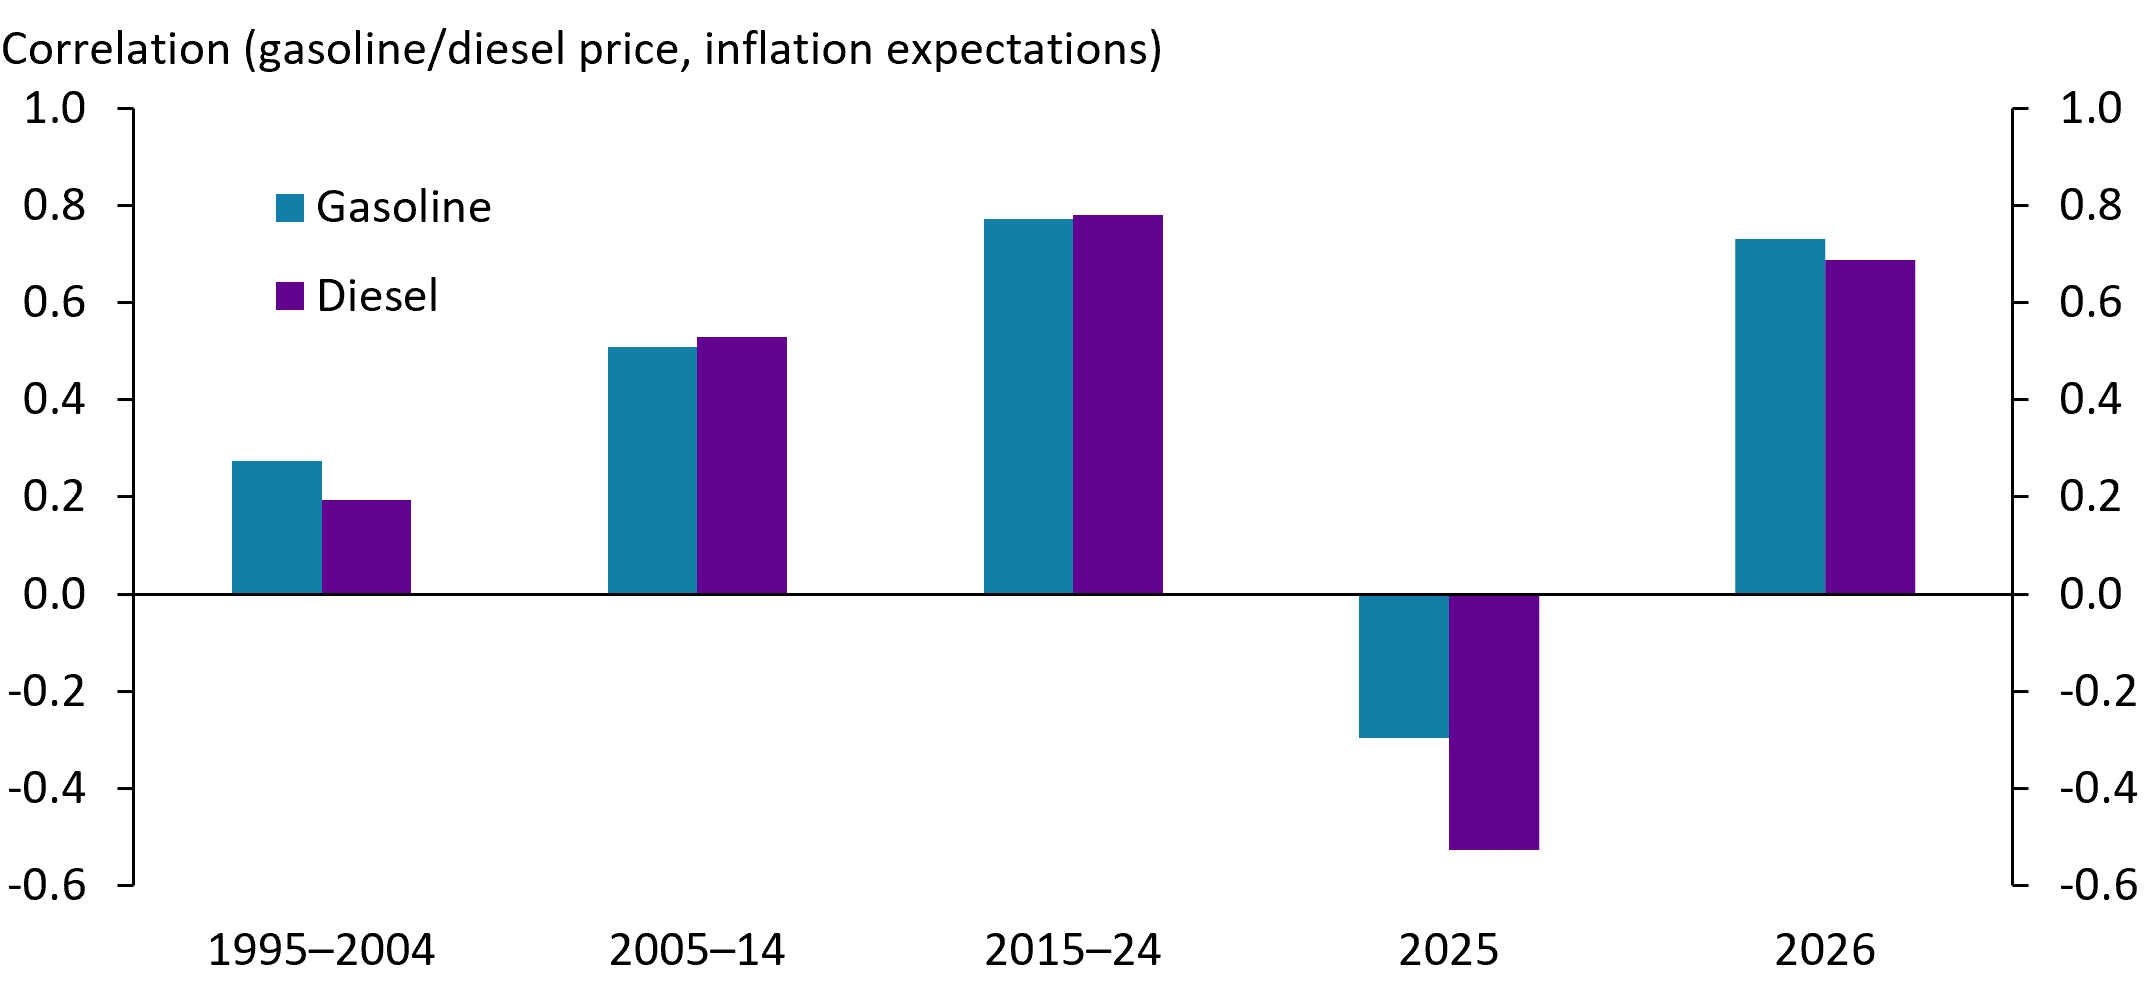
The chart shows that the correlation between U.S. gasoline and diesel prices and one-year-ahead inflation expectations was positive from 1995 through 2024, rising from roughly 0.2 to 0.3 in 1995 to 2004 to 0.8 in 2015 to 2024. In 2025, the correlation turned negative, falling to around -0.3 for gasoline and -0.5 for diesel. In 2026, the correlation returned to positive territory, rising to roughly 0.7 for both gasoline and diesel.

Notes: Chart shows the correlation between monthly average retail gasoline and diesel prices with one-year-ahead inflation expectations by period. Data for 2026 covers January through August.

Sources: U.S. Energy Information Administration and University of Michigan (both accessed via Haver Analytics).

Download the data file for this chart.

Historically, fuel prices and one-year-ahead inflation expectations have moved together, with this positive correlation reaching roughly 0.8 between 2015 and 2024. In 2025, tariff concerns temporarily inverted that relationship, as inflation expectations rose even as fuel prices fell. Through the first eight months of 2026, the correlation has snapped back to around 0.7. This resurgence coincides with a sharp rise in fuel costs: Retail gasoline and diesel prices are up more than 55 percent since the start of 2026, driven by supply disruptions in global oil and refined petroleum markets. With fuel prices still under upward pressure, one-year-ahead inflation expectations are likely to stay elevated over the coming year.

Charting the Economy Energy Inflation

Improving Labor Force Participation Among Gen Z Is Partially Offsetting Baby Boomer Retirements

By John McCoy

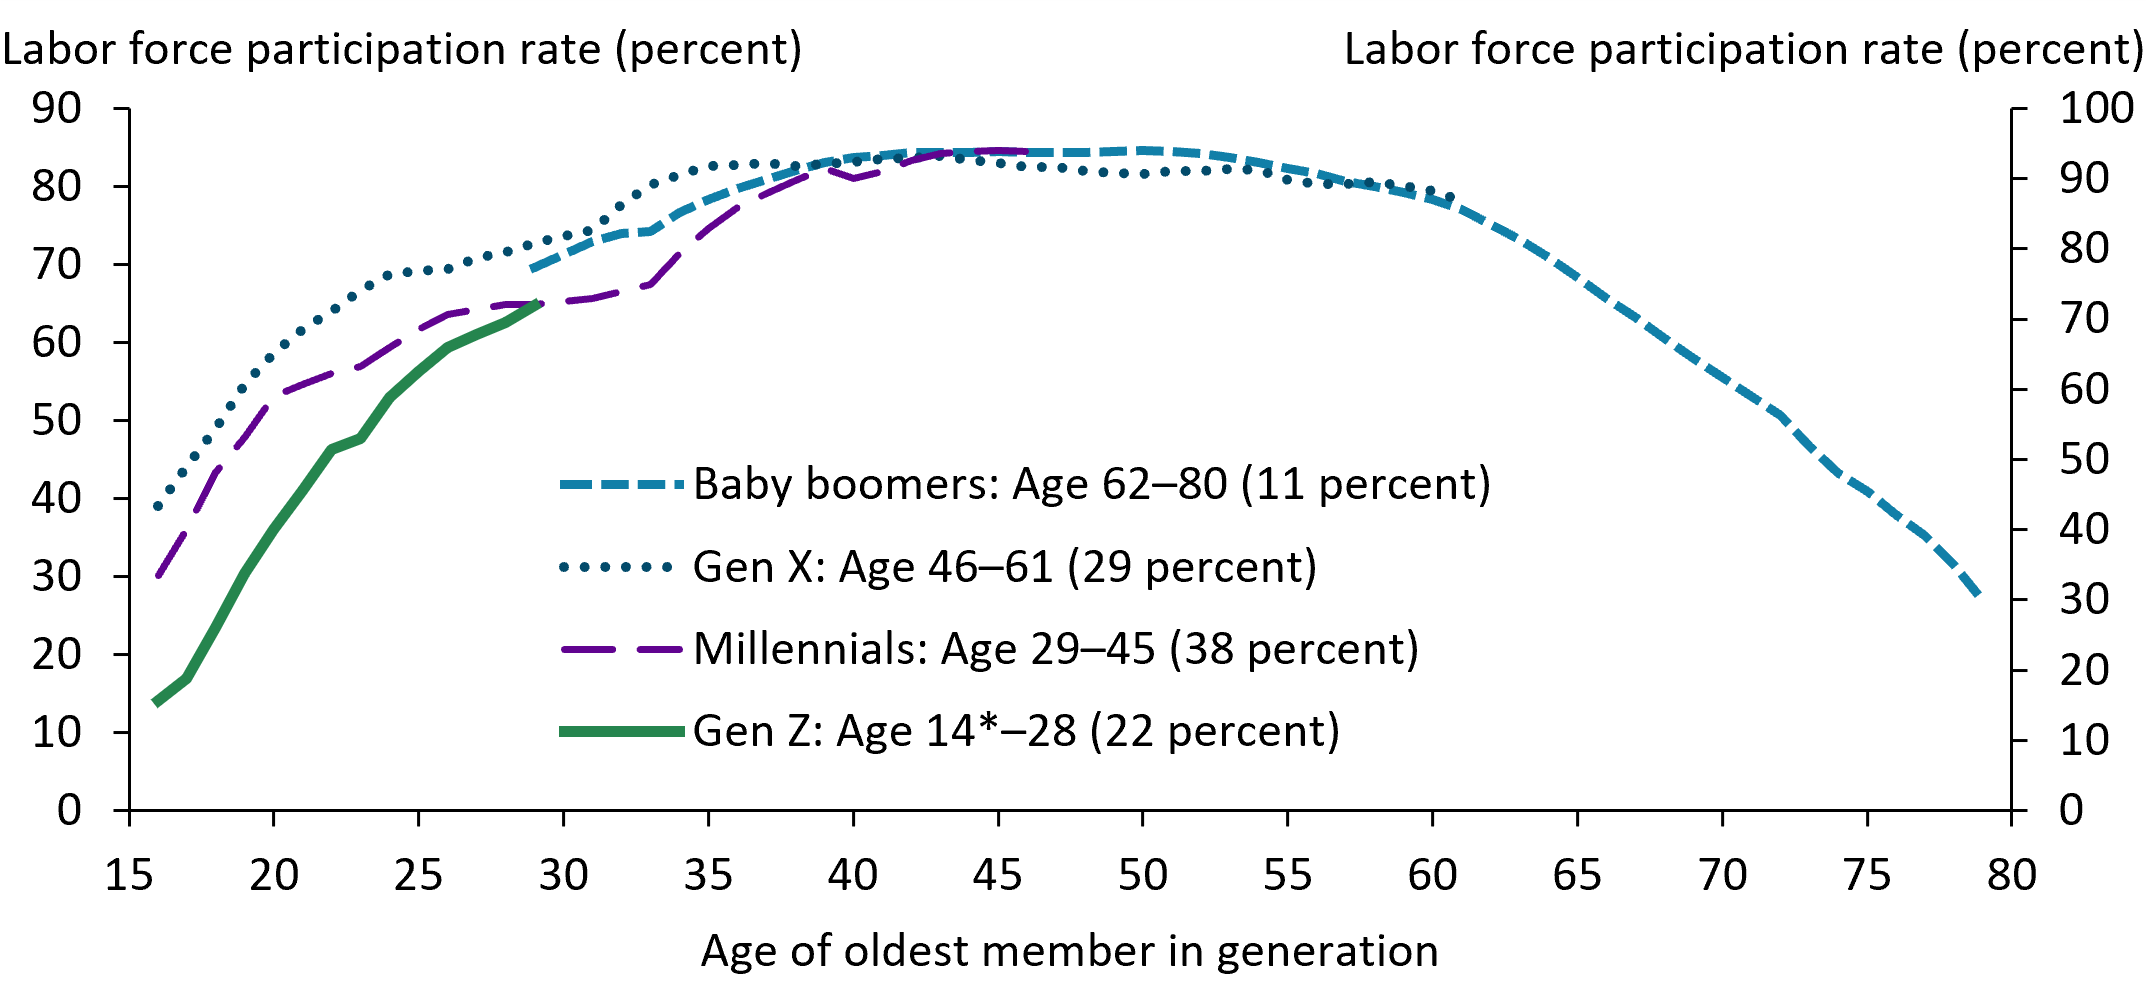
Labor force participation is displayed for generational cohorts, including the baby boomers, Generation X, millennials, and Gen Z. Baby boomer participation has fallen as the population has aged and retired, while Gen Z participation has generally lagged the rate of participation of older cohorts.

Notes: Numbers in parentheses refer to each generation’s share of 2026 labor force. The youngest members of Gen Z are not of working age and are excluded from the analysis. Data used to construct the chart are first available in 1976 and thus do not capture the first several years when the baby boom cohort was of working age. The labor force participation rate for each generation is the share of the cohort age 16 and older working or actively looking for work.

Sources: U.S. Bureau of Labor Statistics and author’s calculations.

Download the data file for this chart.

Labor force participation rates rise and then fall as individuals age. The light blue dashed line shows that participation among baby boomers increased until that generation reached their mid-50s and has recently fallen to 30 percent as most members have moved into retirement. This downward pressure on participation from the baby boomers is partly offset by increasing participation among Generation Z (solid green line). Gen Z initially had lower participation rates than older cohorts in their teens and twenties, but recently their participation has approached 60 percent. Gen Z’s participation is now similar to millennials’ at the same age, though millennials reached this age during a much weaker labor market in 2008–09.

Charting the Economy Labor and Demographics

In Recent Years, an Increased Share of Tenth District Firms Report Absorbing Higher Input Costs

By John McCoy

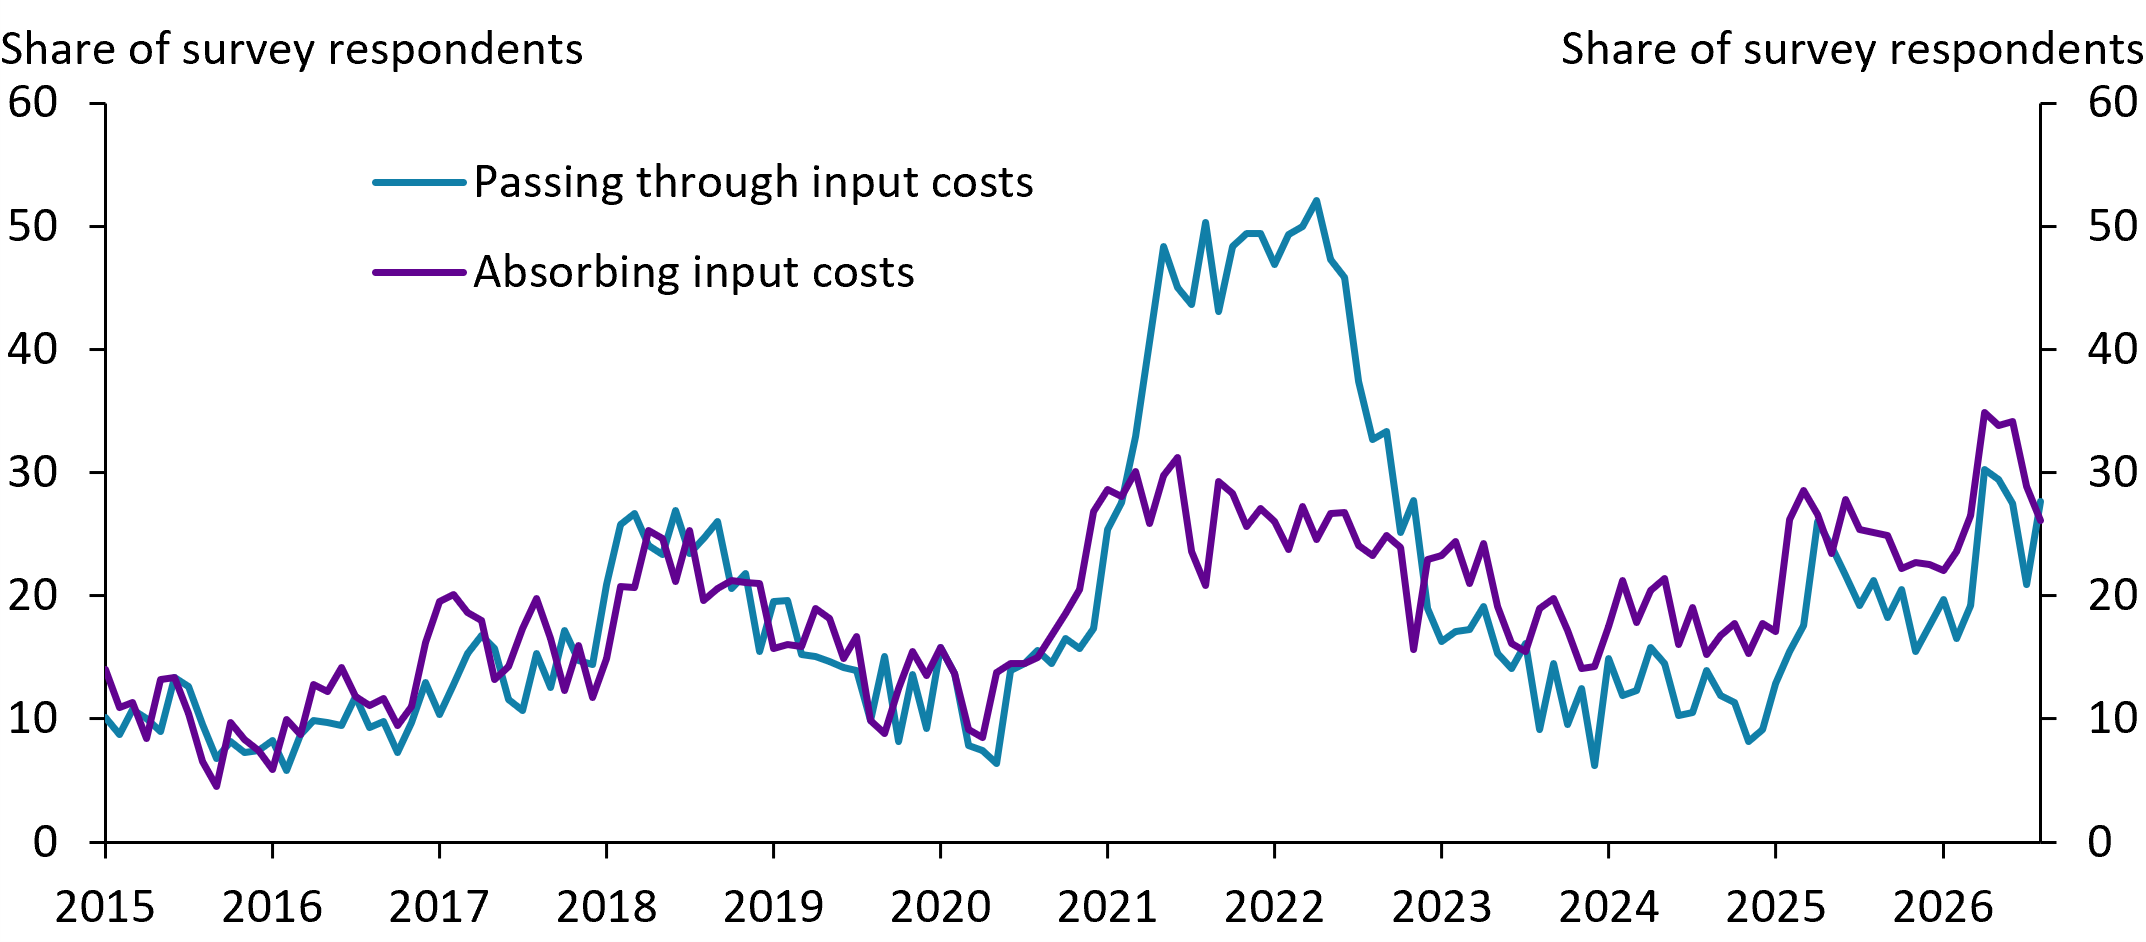
Between 2015 and 2019, the share of firms passing higher input costs along to customers was approximately equal to the share of firms absorbing higher input costs. In 2021, the total share of firms reporting higher input costs surged, as did the share passing those costs along. More recently, the share of firms absorbing higher costs has risen and remained higher than the share passing costs along.

Notes: Chart reflects responses to the Kansas City Fed’s Manufacturing and Services surveys, which collect information on activity in the Tenth Federal Reserve District. Firms “passing through input costs” are those where both input and output prices were higher than the previous month. Firms “absorbing input costs” are those where only input prices were higher than the previous month. The balance of firms does not report higher input prices.

Sources: Federal Reserve Bank of Kansas City and author’s calculations.

Download the data file for this chart.

Between 2015 and 2019, about 30 percent of firms reported higher input prices compared with the previous month, with about an equal share passing at least some of those costs along to customers (blue line) as absorbing the higher costs (purple line). In 2021 and 2022, indicative of the higher consumer price inflation at the time, a majority of firms passed at least some of higher input costs through to customers. Since 2023, the share of firms reporting higher input prices has increased, and a larger share of these firms are now absorbing these higher costs. The inability or hesitancy of firms to pass along higher input prices to customers more recently could compress profit margins, potentially requiring cost savings elsewhere.

Charting the Economy Data and Trends Inflation Manufacturing Regional

The Rising Popularity of Stablecoins Could Reinforce the Global Role of the U.S. Dollar

By Johannes Matschke and David deVyver

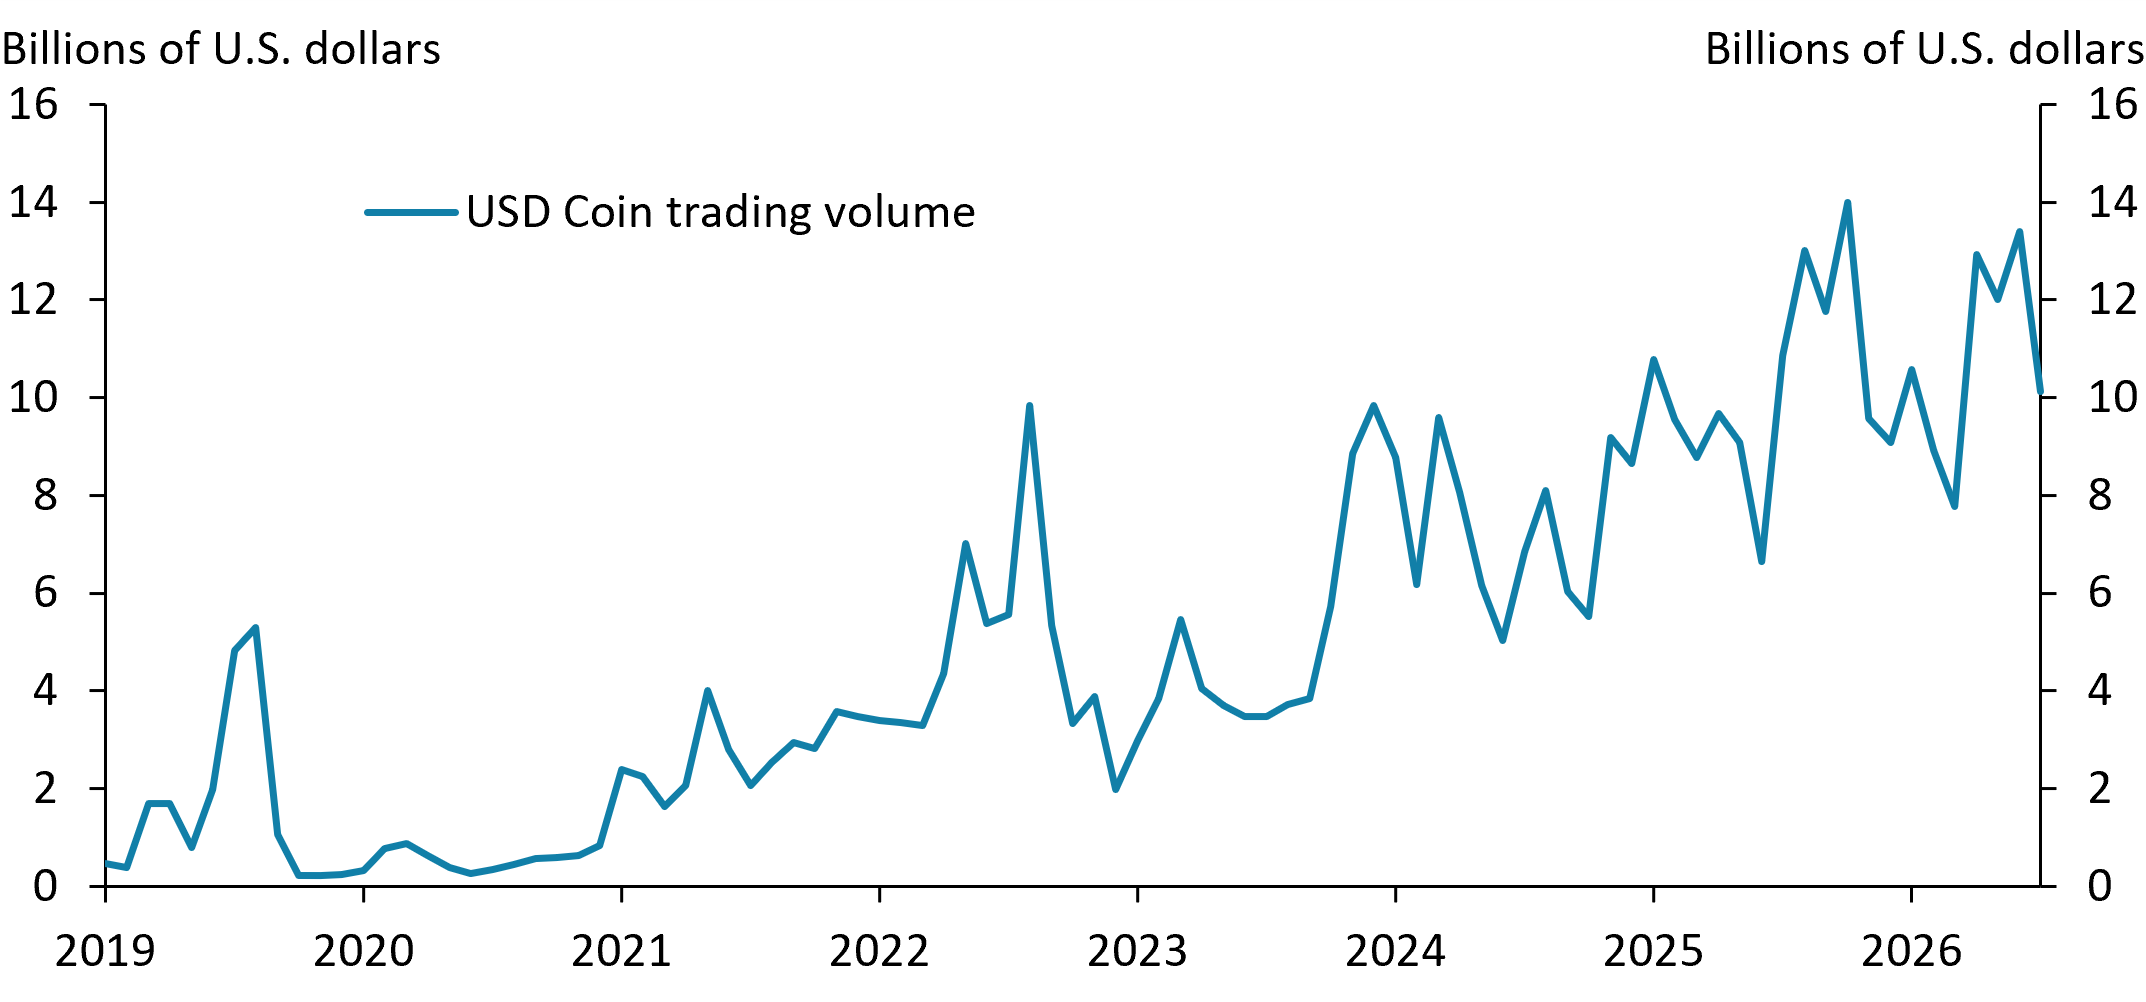
The trading volume of stablecoin USD Coin rose substantially from 2023 to 2026, a sign of stablecoins’ increasing popularity.

Note: Chart depicts the average daily trading volume of stablecoin USD Coin at monthly frequency in billions of U.S. dollars.

Source: CoinGecko (Haver Analytics).

Stablecoins have grown increasingly popular in recent years, as indicated by the growing trading volume of stablecoin USD Coin. One reason for the growth in stablecoin trading is that stablecoins can reduce payment frictions, particularly for cross-border transactions. In a paper presented at the Kansas City Fed’s 2026 Jackson Hole Economic Policy Symposium, Eswar Prasad, Gordon Liao, and Tony Zhang argue that because most stablecoins are backed by U.S. dollar-denominated assets, the increasing use of stablecoins for borrowing and lending may reinforce the dollar’s global dominance. However, they also highlight that stablecoins introduce risks if not fully backed by safe and liquid assets, which provide a credible backstop during financial market distress.

Related Content

Jackson Hole Economic Policy Symposium

The Federal Reserve Bank of Kansas City hosts dozens of central bankers, policymakers, academics and economists from around...

Charting the Economy Banking and Finance International

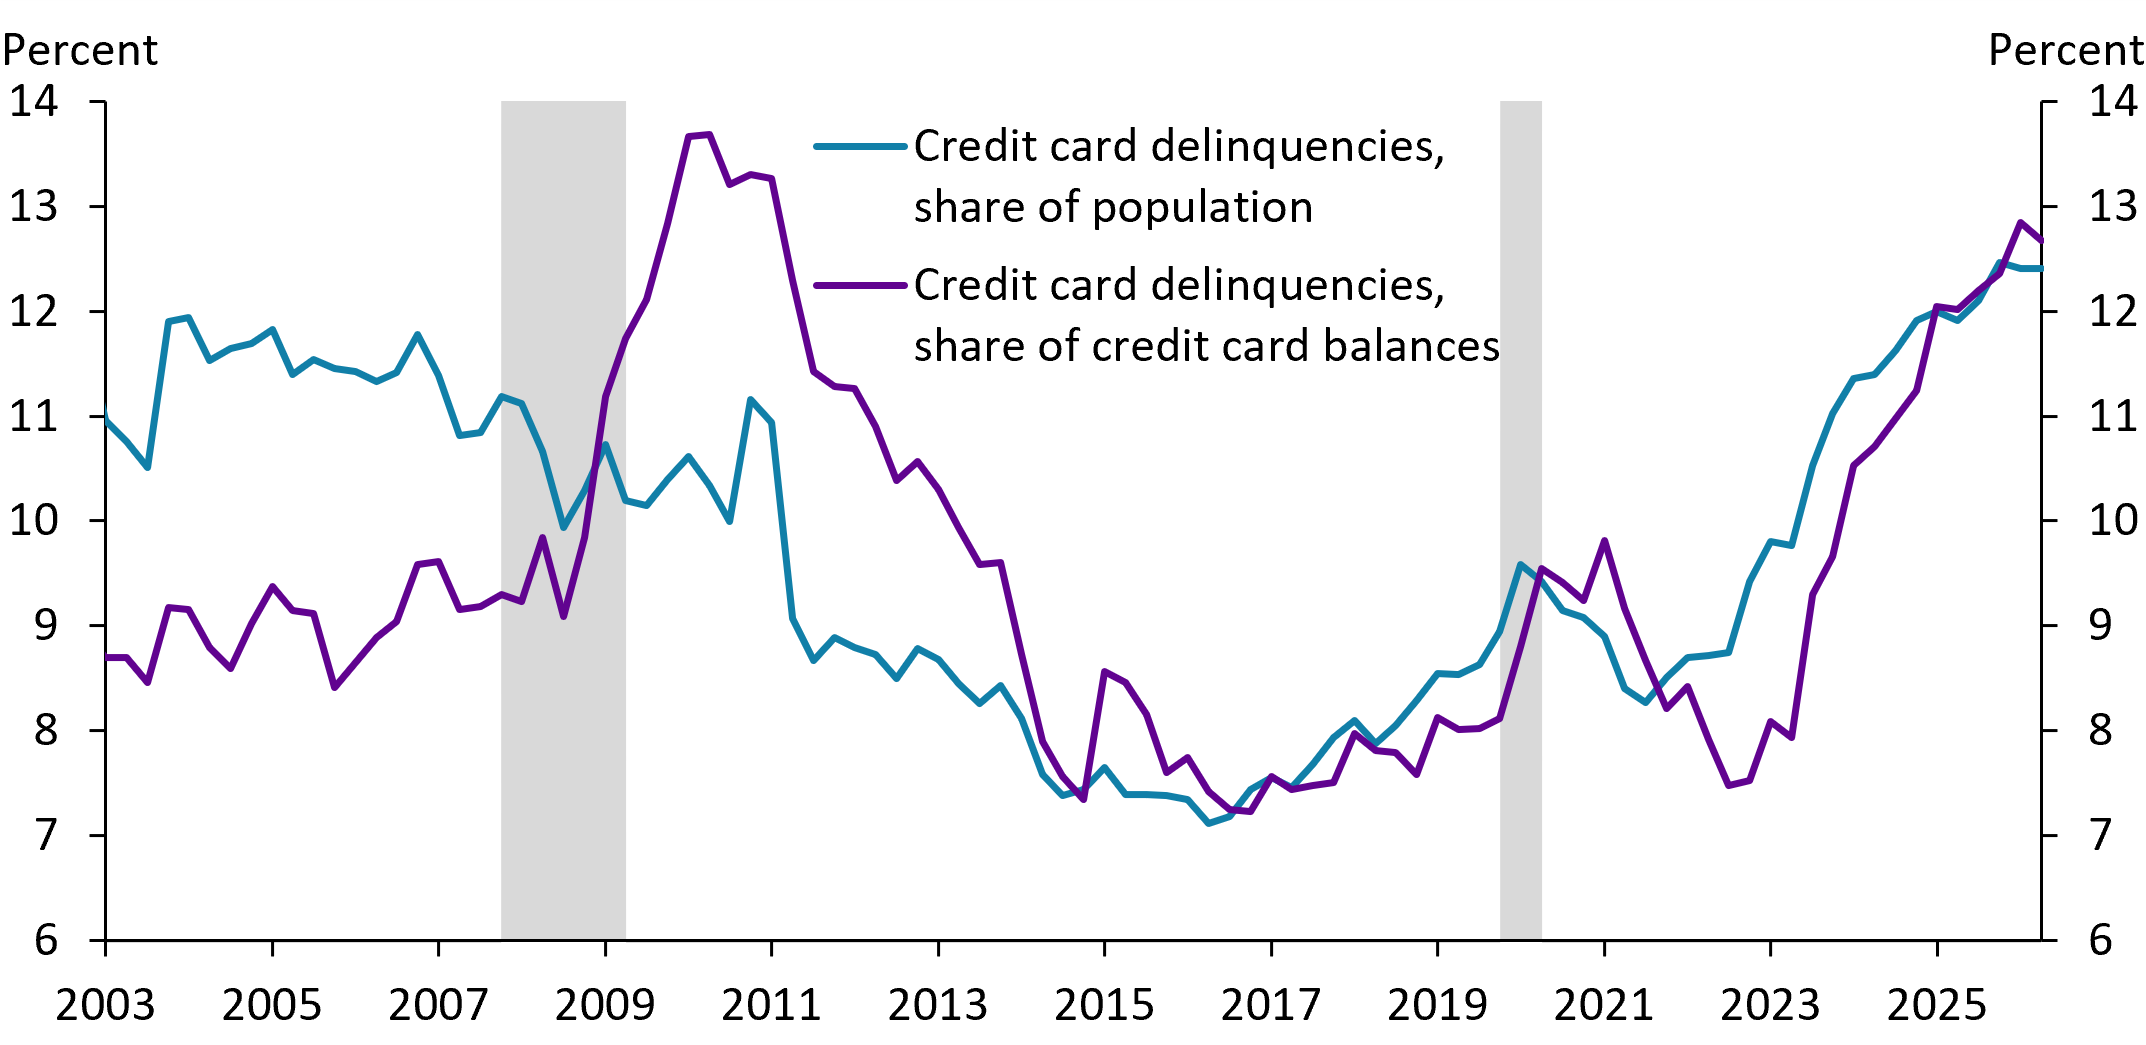
Credit Card Delinquencies Are Becoming More Widespread Across the U.S. Population

By Molly E. Hirner and José Mustre-del-Río

Since 2023, both the share of the population with at least one severely delinquent (90+ days past due) credit card and the share of credit card balances that are severely delinquent have moved up. In contrast, during the Great Recession in 2007–09, the population measure was fairly constant, if not falling, while the balance measure rose sharply.

Notes: Delinquent debt is debt 90 days or more past due. The total population is defined as those with at least one credit card account. Data as of 2026:Q2. Gray bars denote National Bureau of Economic Research (NBER)-defined recessions.

Sources: Federal Reserve Bank of New York Consumer Credit Panel/Equifax Data, NBER (Haver Analytics), and authors’ calculations.

Since 2023, both the share of the U.S. population with at least one severely delinquent (90+ days past due) credit card (blue line) and the share of credit card balances that are severely delinquent (purple line) have moved up. In contrast, during the Great Recession in 2007–09, the population measure was fairly constant, if not falling, while the balance measure rose sharply. Although the balance measure is currently below its peak in 2010, severe delinquencies are now more widespread across the U.S. population than at any point in the past two decades.

Charting the Economy Banking and Finance Macroeconomics Monetary Policy Payments