Federal supplements to unemployment insurance bolstered income in Nebraska in 2020, and by the end of 2021 personal incomes were poised to be near what might have been expected in the absence of the pandemic. The COVID-19 pandemic severely disrupted labor markets in Nebraska last year, though less than in the nation as a whole. Despite the severe job losses, incomes in the state expanded relative to what might have occurred in the absence of the pandemic, due, in large part, to the federal supplements. Even with the discontinuation of federal supplements, household income in Nebraska may still be near its expected pre-pandemic path by year-end.
Labor Market Developments in 2020
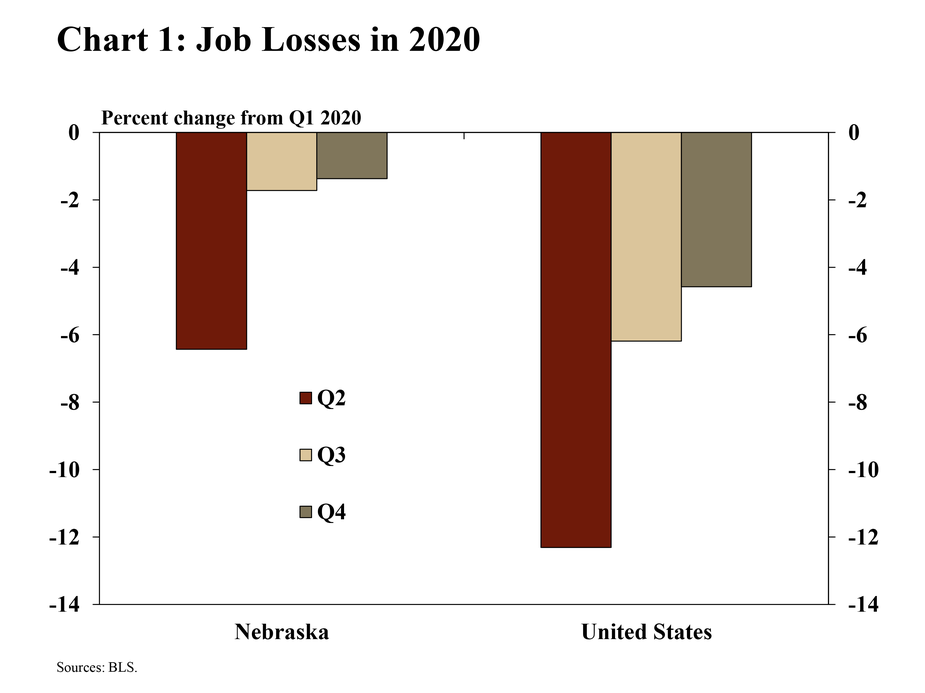
The COVID-19 pandemic roiled labor markets across the country in 2020, but job losses were less severe and the subsequent recovery more rapid in Nebraska than in the nation overall. In spring 2020, employment across the country dropped sharply as public health directives restricted business activity and consumers also limited activity that required personal contact (Chart 1). Though job losses in Nebraska were half that of the nation, the state still lost more than 6% of jobs between the first and second quarters. As public health authorities relaxed restrictions in the second half of 2020, labor markets began to recover. By year-end, many jobs had returned, though both Nebraska and the United States remained below pre-pandemic employment levels.
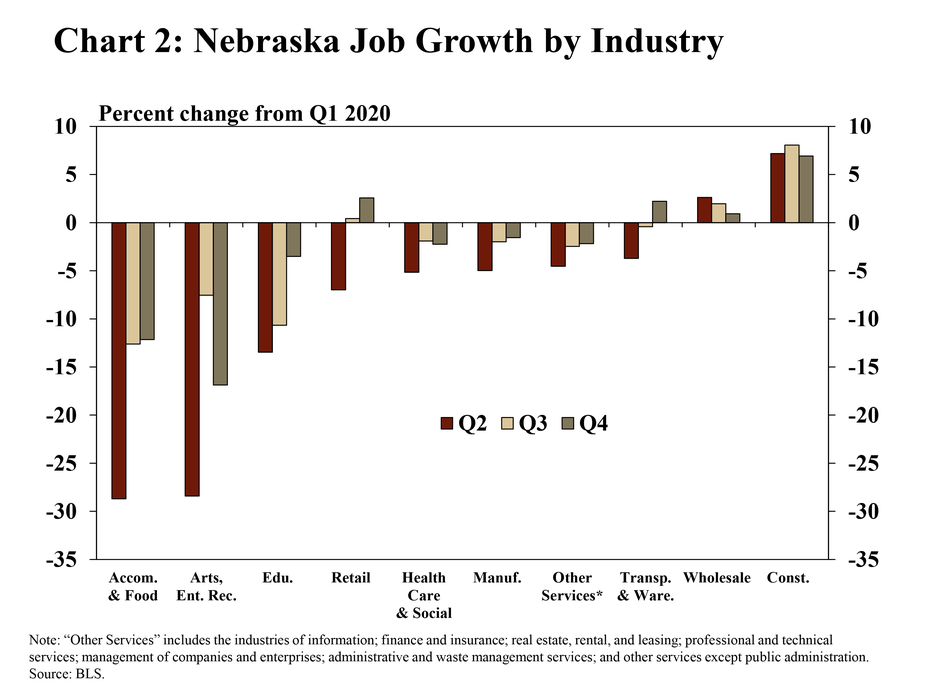
Similar to other states, the heaviest job losses in Nebraska were in industries requiring close contact. The leisure and hospitality industry – including accommodation, food services, arts, entertainment, and recreation – shed nearly 30% of jobs between the first and second quarter (Chart 2). Other industries requiring in-person interaction or other close contact between individuals – such as educational services, retail, health care and social assistance, and manufacturing – also cut employment by more than 5%. By the end of 2020, firms in the leisure and hospitality industry remained most adversely affected by the pandemic.
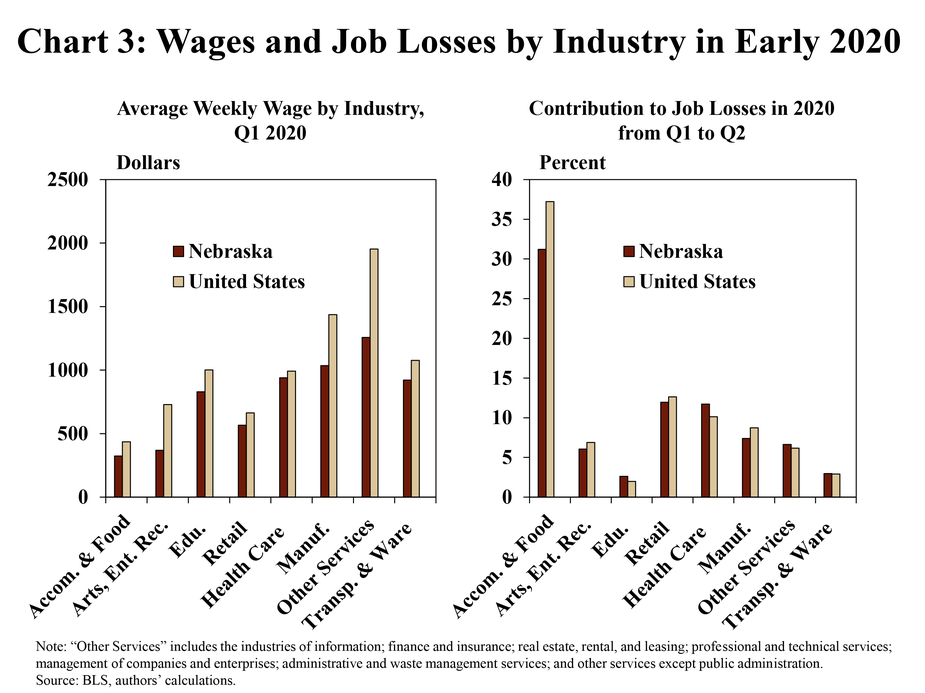
Job losses in 2020 were most pronounced in industries with the lowest wages. As in the nation, accommodation and food service jobs in Nebraska were among the lowest-paid jobs prior to the pandemic, and represented the largest share of job losses in the second quarter of 2020 (Chart 3). Job losses also were notable in retail, an industry where wages are also relatively low.
Effects of Unemployment Insurance on Nebraska Incomes in 2020
While significant job losses weighed on households in 2020, federal supplements to unemployment insurance provided substantial income support. Various federal acts and executive actions throughout the pandemic provided additional weekly payments to the unemployed. The supplements amounted to $600 per week through much of the second quarter of the year and $300 per week through much of the third quarter of 2020, before being eliminated temporarily for a majority of the fourth quarter.
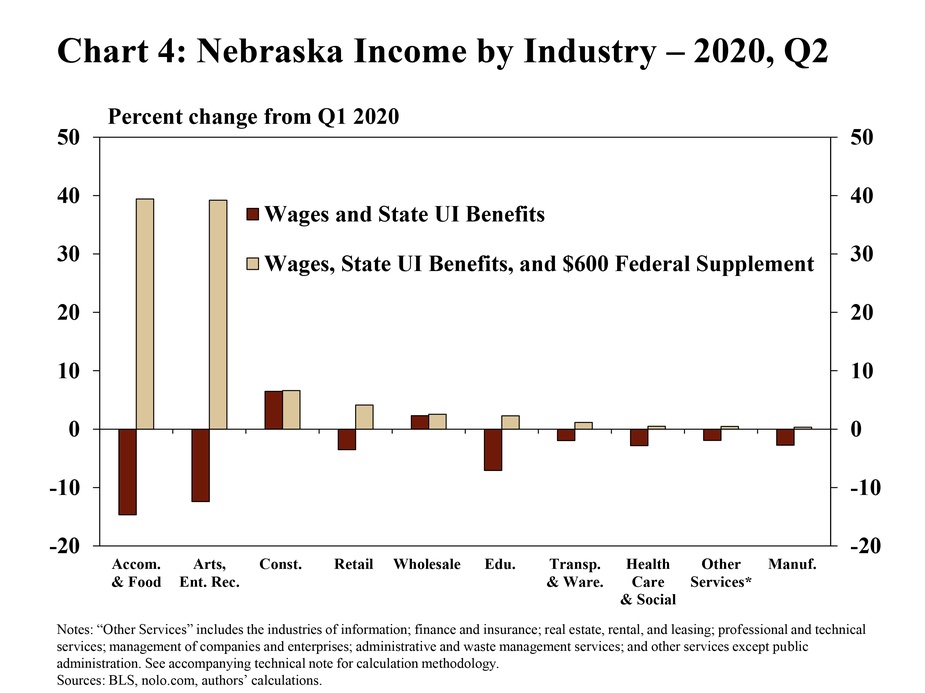
Job losses were especially severe in the second quarter of 2020, but the enhanced unemployment benefits transformed losses in income to gains across all major industries in Nebraska. Without federal support, personal income would have declined more than 10% in the leisure and hospitality industry between the first and second quarters (Chart 4). In other industries, incomes likely also would have contracted. However, in all industries, personal income increased in the early months of the pandemic due to the $600 per week supplements. In the leisure and hospitality industry, the supplement itself exceeded average weekly wages throughout the state and incomes increased nearly 40% between the first and second quarters.
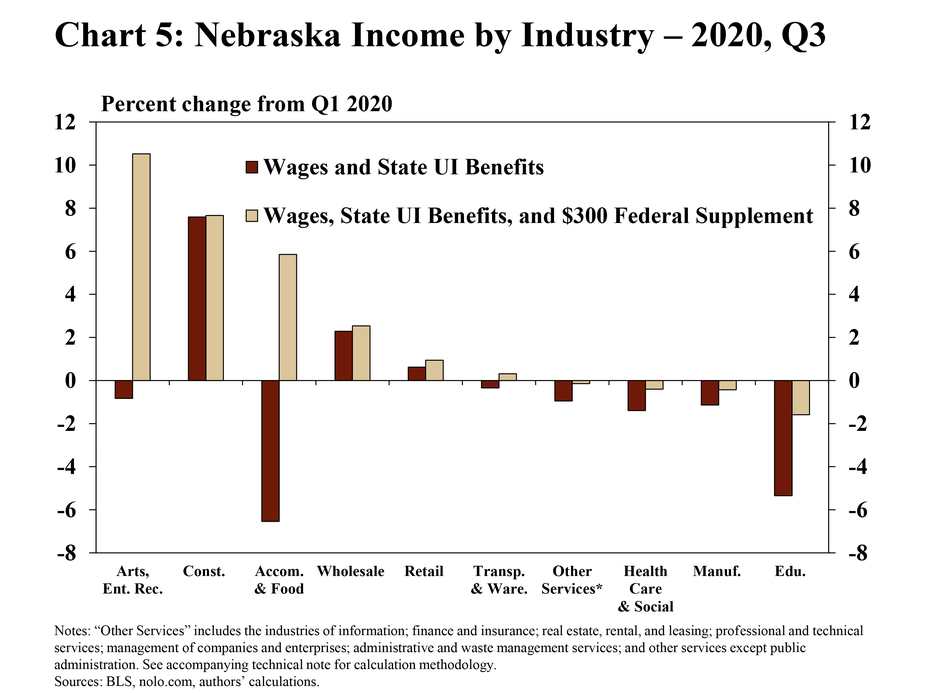
Ongoing federal supplements to unemployment insurance continued to boost incomes for workers in most industries in the third quarter and were supported further by job recovery. Though the federal supplement was halved to $300, the payments still provided considerable support to industries with large numbers of unemployed workers (Chart 5). In other industries, such as construction, wholesale trade, and retail trade, job growth in the third quarter boosted incomes even without the supplements. The supplements to unemployment benefits then provided a small additional boost for any remaining unemployed workers in those industries.
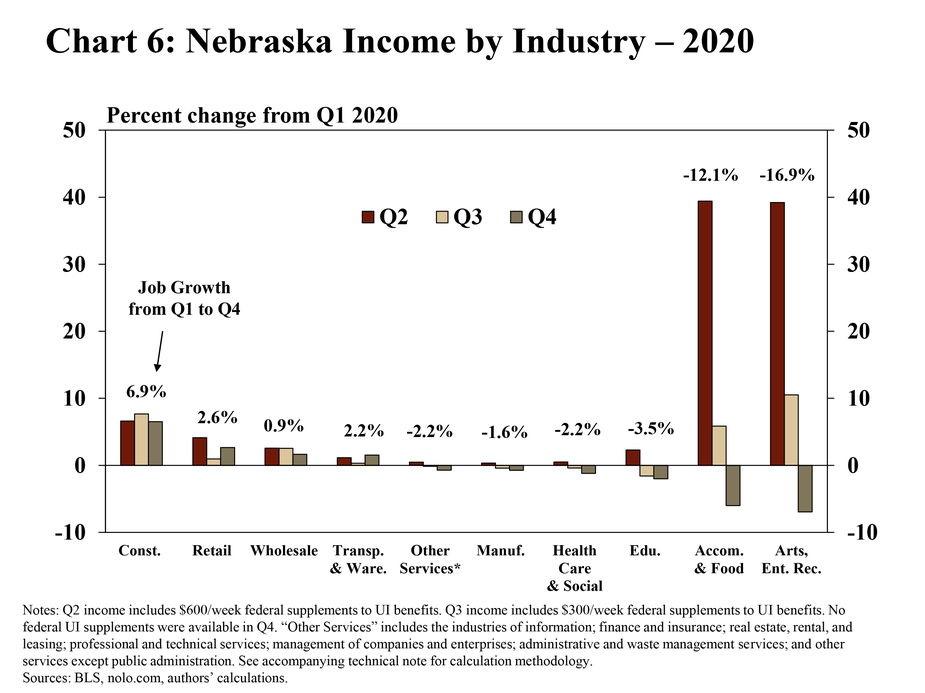
Though job growth slowed in the fourth quarter, the temporary discontinuation of federal supplements also weighed significantly on income growth at the end of 2020. Incomes continued to expand relative to the first quarter in industries where job growth improved (Chart 6). In industries where jobs had yet to fully recover, the lack of federal supplements resulted in a contraction in incomes for workers connected to those industries.
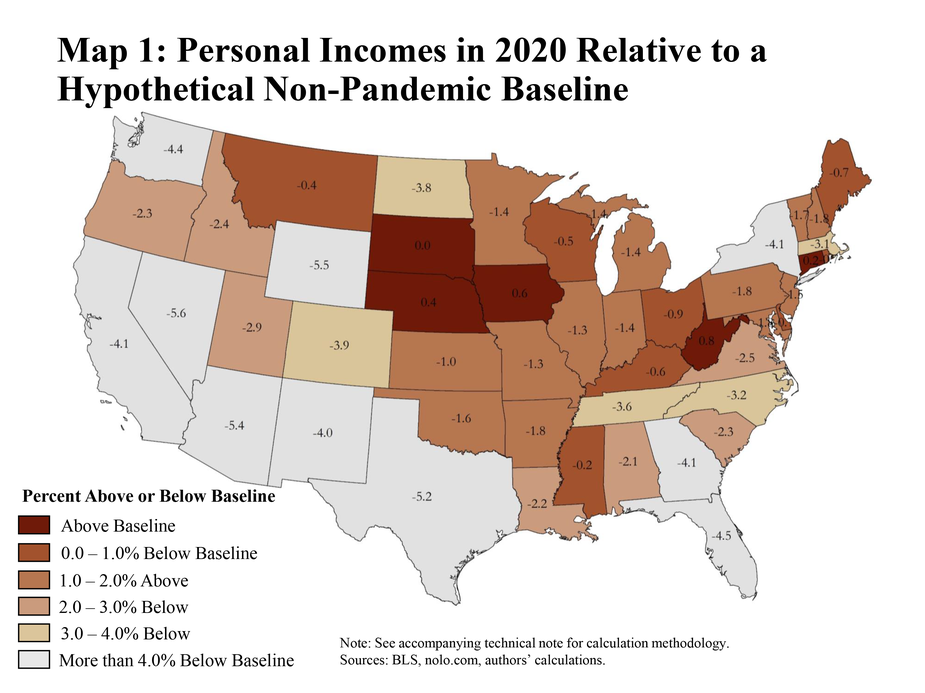
Despite a tumultuous year, personal income growth in Nebraska was among the highest in the nation by the end of 2020 relative to what may have transpired in the absence of the pandemic. In fact, Nebraska was one of only five states where income was higher than what might have been expected if pre-pandemic trends continued through the year (Map 1). Relative to this non-pandemic scenario, incomes were weakest in states with a large share of job losses in higher-paying industries such as mining, or in states where jobs returned more slowly such as California or New York.
Outlook for Nebraska Incomes in 2021
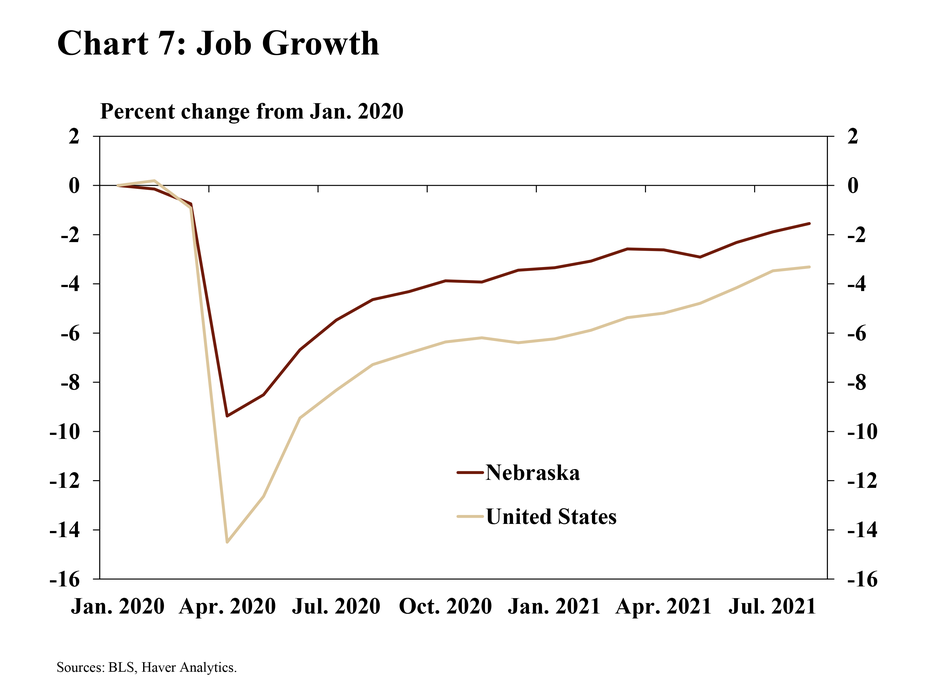
In 2021, job growth slowed early in the year before picking up in the summer months. From January to June, Nebraska added an average of 1,900 jobs per month, down sharply from an average monthly increase of 5,600 during the last half of 2020. Job growth increased in the summer and, by August, employment in the state was only 1.5% less than January 2020 (Chart 7). In contrast, national employment still was more than 3% less than January 2020.
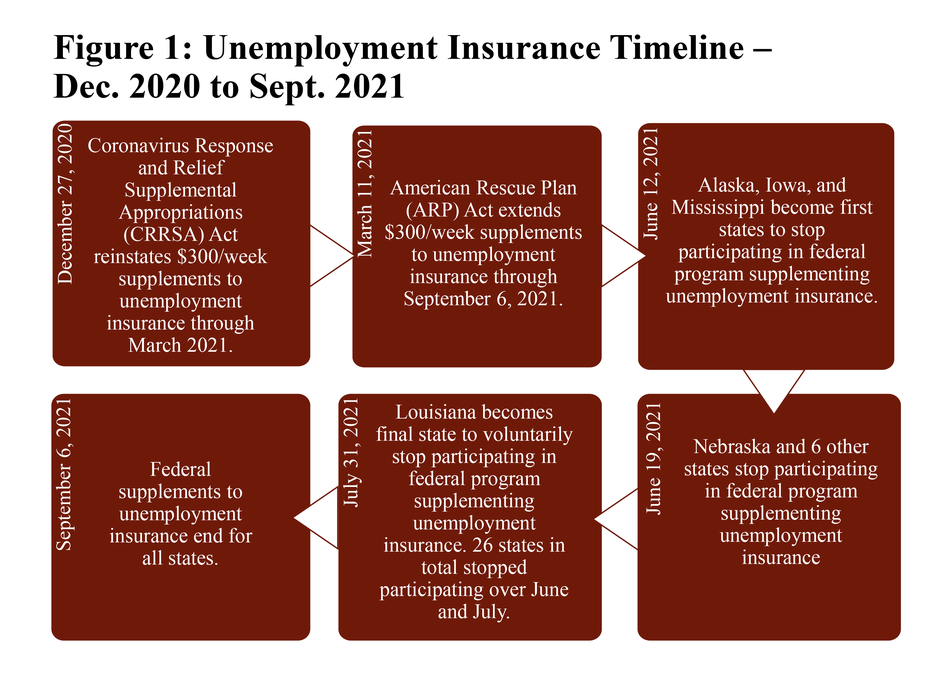
Alongside increased job growth, federal supplements to unemployment insurance were discontinued in Nebraska in June 2020. For the first two quarters of 2021, Nebraska participated in programs established by the Coronavirus Response and Relief Supplemental Appropriations (CRRSA) Act and American Rescue Plan (ARP) Act, which reinstated $300 per week supplements to unemployment benefits (Figure 1). By the end of July, Nebraska was one of 26 states that voluntarily ended participation in those programs. Nationally, Congress did not extend these special unemployment insurance programs, and on September 6, 2021, supplemental payments ended for unemployed workers across the country.
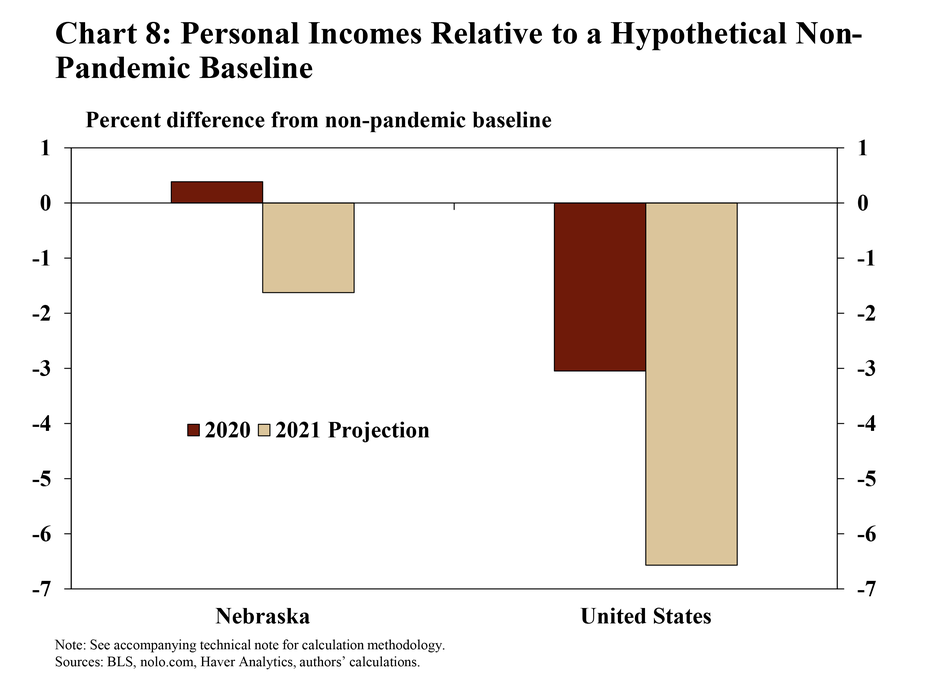
Although federal supplements have been discontinued, income in Nebraska still may be near what might have been expected in the absence of the pandemic by year-end. If trends that existed prior to the pandemic had prevailed throughout 2020 and 2021, incomes in Nebraska could roughly equal that hypothetical scenario by the end of 2021 (Chart 8). In contrast, incomes at the national level still would be about 6.6% less than a hypothetical scenario in which pre-pandemic trends continued. Still, unemployment insurance also provided support to households nationally, as incomes dropped by only 3% in 2020 and the decline may have been even larger in 2021 without the supplements.
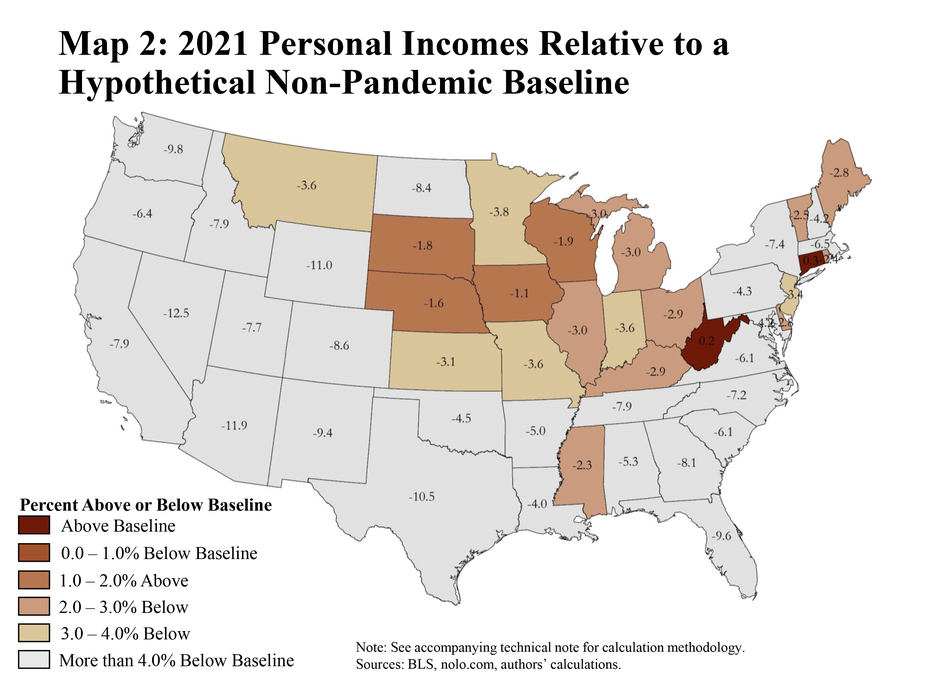
By the end of 2021 the income recovery in Nebraska, relative to a non-pandemic baseline, was positioned to be stronger than all but three other states. Supported by steadier economic activity and relatively strong job growth, income gains were projected to be strongest in the Midwest by year-end when compared with the non-pandemic baseline (Map 2). Income growth appeared to be weaker in states dependent on the energy sector (North Dakota, Wyoming and Texas) or in regions where job growth had been particularly strong in advance of the pandemic before slowing substantially during the crisis.
Conclusion
Incomes across the country have been stronger than what might have been expected at the onset of the pandemic due, in large part, to unemployment insurance supplements. In some cases, the supplements exceeded wages from employment, resulting in income gains for many lower-wage areas of the country despite sharp increases in unemployment. As the pandemic progressed, job recovery became a larger driver of income growth than enhanced unemployment benefits. While it may be difficult to determine how conditions would have evolved in the absence of supplements to unemployment insurance, personal incomes in Nebraska appear to be on relatively solid footing alongside further improvement in economic activity and job opportunities.
Technical Notes
Charts 4, 5, and 6 show income by industry and measure the effect of supplements to unemployment insurance. To compute income by industry and measure the effect of supplements to unemployment insurance, this study uses average weekly wage and employment data for two-digit North American Industry Classification System (NAICS) industries in each county from the Bureau of Labor Statistics’ Quarterly Census of Employment and Wages (QCEW). For each job lost relative to the first quarter of 2020, the value of lost wages is calculated using the average weekly wage from Q1:2020 from the appropriate county-industry pair. By statute, each state has a different formula for determining unemployment benefits; the 50 different calculations are applied to county-industry pairs where jobs were lost. The federal supplements are added to each state benefits formula. To determine total quarterly income in each category, income from unemployment benefits is added to wages for those remaining employed.
Chart 8 and maps 1 and 2 show total cumulative income by state relative to a hypothetical non-pandemic baseline. Total income by state for 2020 is the sum of wages in the first quarter; wages and unemployment benefits with $600 federal supplements in the second quarter; wages and unemployment benefits with $300 federal supplements in the third quarter; and wages and unemployment benefits without federal supplements in the fourth quarter. Wages in all quarters are held constant at Q1:2020 levels.
The non-pandemic baseline also holds wages constant at Q1:2020 levels, but uses the average rate of employment growth from 2019 to project what employment would have been in the absence of the pandemic. The inclusion of the 2019 average rate of employment growth is an update to the non-pandemic baseline scenario in the related Economic Bulletin article "Federal Enhancements to Unemployment Insurance Supported Tenth District Incomes in 2020." The average employment growth rate is found for each state-industry pair using the Bureau of Labor Statistics’ Current Employment Statistics (CES) report and is then applied to each county-industry pair. For each county-industry pair, wage levels are applied to the projected level of employment for each quarter. Projections are made for Q2, Q3, and Q4:2020 and added to wages from Q1:2020 to arrive at the non-pandemic income baseline.
Cumulative total income by state for 2021 begins with the values from 2020. Total income for Q1:2021 is the sum of wages and unemployment benefits with a $300 federal supplement. For remaining quarters, the average 2021 quarter-over-quarter employment growth rate for each state-industry pair from the CES is used to project the level of employment for Q2, Q3, and Q4 2021. Total income for all states in Q2 is the sum of wages and unemployment benefits with a $300 federal supplement. In Q3, the federal supplement was suspended in some states. Finally, no federal supplement is included in the projection for Q4:2021.
For the 2021 non-pandemic baseline, 2019 trends are again used to project employment for each quarter in the same manner as outlined above for 2020. Total projected non-pandemic wages from 2020 are summed with the total projected non-pandemic wages for 2021.
The views expressed are those of the authors and do not necessarily reflect the positions of the Federal Reserve Bank of Kansas City or the Federal Reserve System.
Authors

Nate Kauffman
Senior Vice President, Economist, and Omaha Branch Executive; Executive Director of the Center for Agriculture and the Economy