Inflation Has Weighted on Personal Savings Nationally
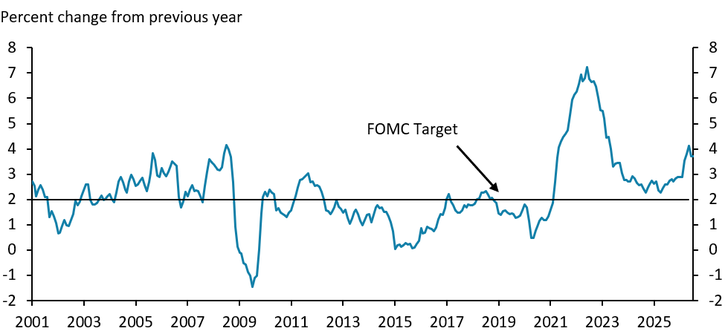
Persistent inflation has increased the cost of living for U.S. households substantially in recent years. In fact, inflation has been above the target set by the Federal Open Market Committee (FOMC) for the past five years (Chart 1). Cumulatively, prices have risen 22 percent since April 2021, the first month following the pandemic when inflation exceeded the target. As of July 2026, inflation remained elevated, having increased nearly 4 percent over the previous year amid higher energy prices resulting from conflict in the Middle East.
Chart 1. U.S. Inflation – Personal Consumption Expenditures (PCE) Index
Sources: BEA, Haver Analytics.
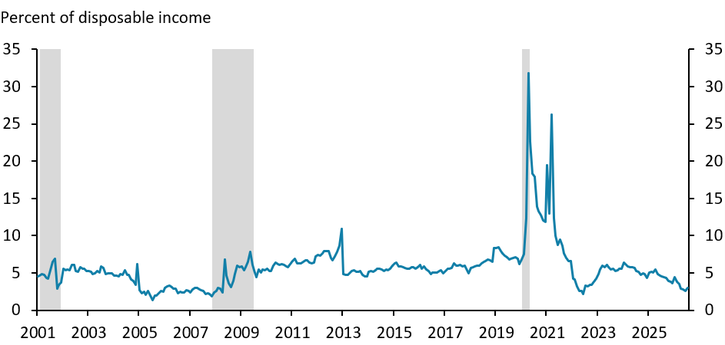
Ongoing cost pressures and the spike in energy prices in 2026 have weighed on household finances and savings in recent months. Household savings peaked in early 2020 when the government transferred funds to help mitigate economic fallout from pandemic-related lockdowns. Thereafter, the savings rate of U.S. households retreated from those elevated levels and have declined further in 2026. By July 2026, the national savings rate had fallen to just 3 percent of disposable income, less than half the pre-pandemic average of 6.1 percent and the lowest level since 2008 (Chart 2).
Chart 2. National Savings Rate
Note: Gray bars indicate NBER-defined recessions.
Source: BEA.
Savings have fallen in recent years as outlays have generally grown more quickly than income. Between 2024 and 2025, personal income grew at an average annual rate of more than 5 percent before slowing to less than 4 percent in the first quarter of 2026 (Chart 3, Panel A). In contrast, personal outlays have increased steadily at a rate of more than 5 percent since 2024 and into early 2026. The overwhelming majority of personal outlays (96 percent) result from personal consumption, which has also increased by more than 5 percent per year on average since 2024 (Chart 3, Panel B).
Chart 3. Components of the National Savings Rate
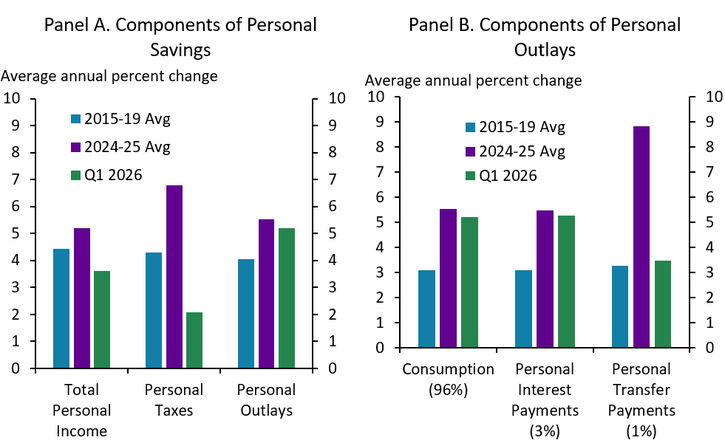
Note: Personal savings is the amount of personal income remaining after subtracting personal taxes and personal outlays from personal income. In panel B, the numbers in parentheses refer to the share of total personal outlays attributable to each component.
Source: BEA.
Strong Income, Moderate Consumption Growth Contributed to Higher Savings Potential in Nebraska
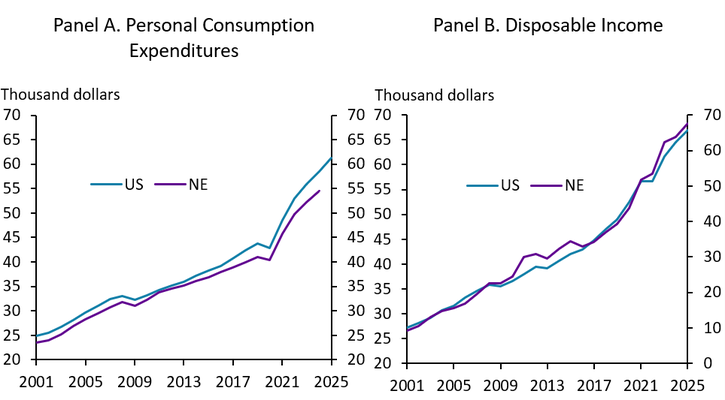
In Nebraska, incomes have exceeded consumption, on average, and this buffer has been consistently larger than the nation. In 2024, the most recent year for which data are available at the state level, the average Nebraskan spent $54,000 per year, while earning more than $64,000 in disposable income (Chart 4). In contrast, national consumption has been consistently higher while disposable income has generally been lower than in Nebraska.
Chart 4. Per Capita Consumption and Income
Source: BEA.
In fact, the savings rate in Nebraska has been nearly double the national average in recent years . As of 2024, the savings rate in Nebraska was nearly 17 percent before accounting for personal interest and transfer payments (Chart 5). On average, this savings rate has been about five percentage points higher than the equivalent rate at the national level. The persistent difference between Nebraska and the national rate can be explained by slightly stronger income growth and more moderate levels of consumption in the state. While the savings rate has likely fallen in 2026, similar to the nation, it has also likely remained substantially higher than the U.S. average.
Chart 5. Savings Rates
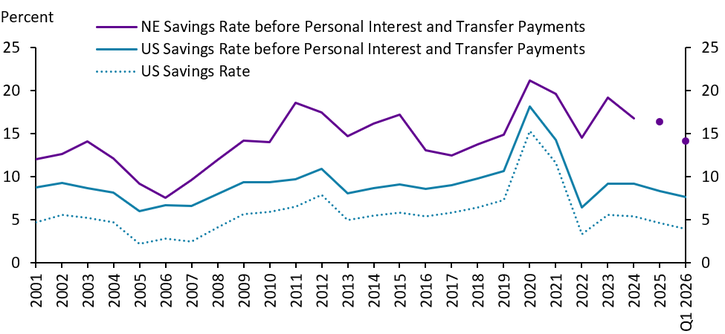
Note: State level data on personal interest and transfer payments are not available, preventing the calculation of a savings rate equivalent to the national rate displayed in the dotted line, which is an annualized version of Chart 2. Purple dots are projections for Nebraska found by applying the national rate of growth to disposable income to estimate Q1 2026 and to personal consumption expenditures to estimate 2025 and Q1 2026.
Sources: BEA, staff calculations.
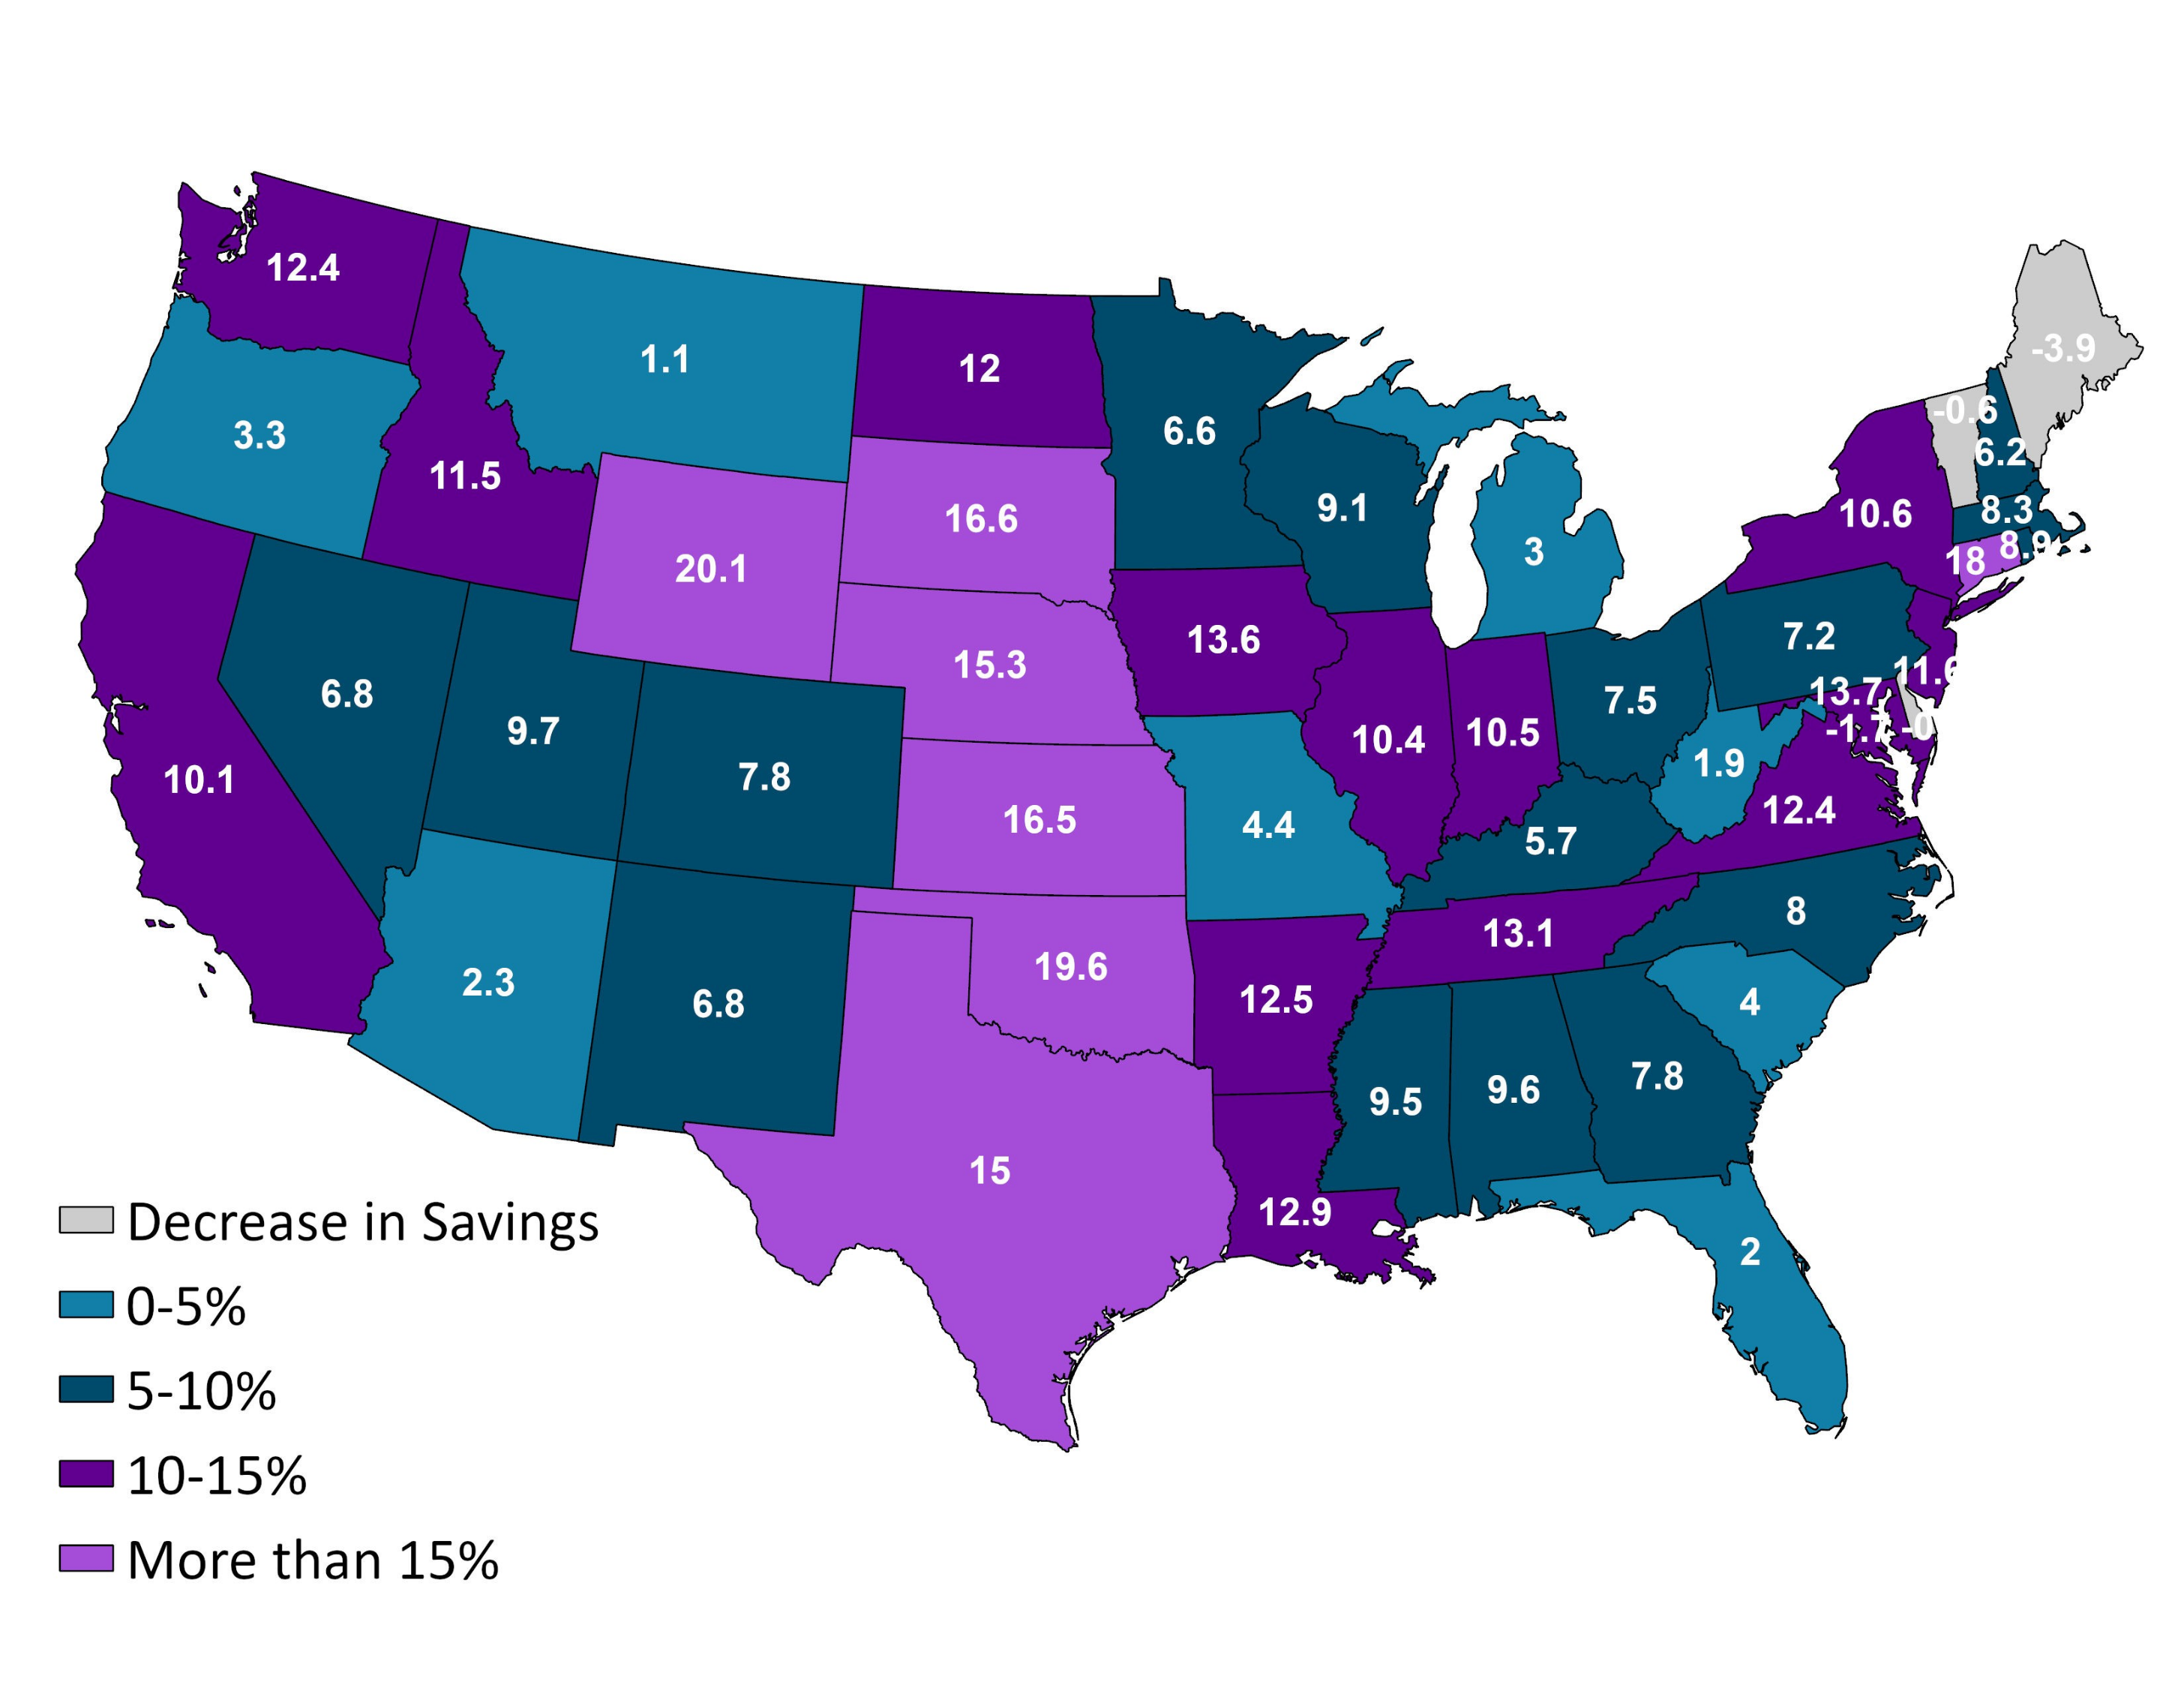
The savings rate in Nebraska has consistently ranked among the highest in the nation. In the years leading up to the pandemic, Nebraska's pre-interest and transfers savings rate of 15.3 percent was sixth highest in the nation on average (Map 1). While not shown, savings in Nebraska remained robust during the pandemic. Even with an expected decline in 2026, a savings rate projected to be 14.1 percent would keep Nebraska among the highest across all states.
Map 1. Savings Rate before Personal Interest and Transfer Payments, 2010-19 Average
Source: BEA, staff calculations.
Consistently higher savings rates have had the potential to compound over time, giving Nebraska households substantially larger financial buffers than the national average. If the average Nebraska resident had saved the entire difference between income and consumption each year since 2001, the cumulative total would exceed $173,000, far more than the national average of $106,000 (Chart 6)_. The same pattern has held over shorter timeframes—cumulative savings since 2019 or 2022 show the average Nebraskan has had the potential to accumulate a notably larger financial cushion.
Chart 6. Potential Cumulative Savings
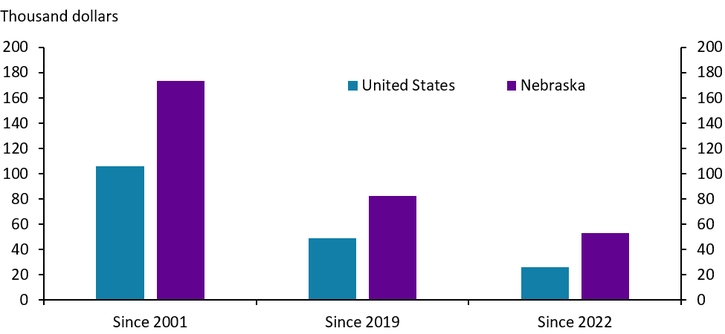
Note: cumulative total savings are before personal interest and transfer payments. Cumulative totals include 2025 and 2026 estimates using the projection method detailed in the note beneath Chart 5.
Sources: BEA, staff calculations.
Home Prices Have Increased, but Strong Savings in Nebraska Provide a Buffer
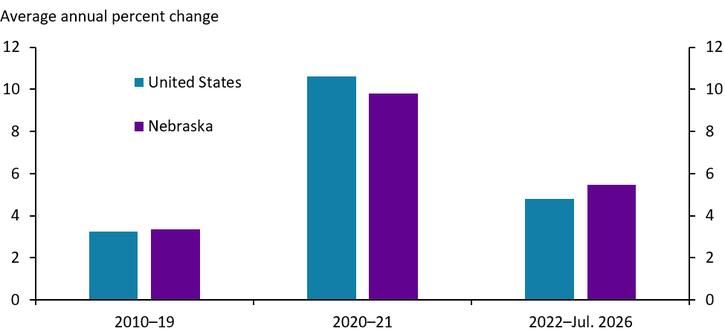
Nebraska’s stronger savings position is closely connected to developments in the housing market. As elsewhere in the country, home prices in Nebraska have continued to increase at a quicker pace than the decade before the pandemic (Chart 7). In fact, prices in Nebraska have increased at a slightly higher pace than the nation since 2022. However, during the pandemic years, home prices increased at a slightly slower pace, contributing to a higher savings rate relative to the nation during those years.
Chart. 7. Median Home Prices
Sources: Zillow, Haver Analytics.
Despite higher costs of homeownership, affordability for first-time homebuyers in Nebraska has deteriorated less than in the rest of the country. In Nebraska, the average monthly mortgage payment on a new home purchase increased to more than 25 percent of income in 2026, up from an average of 14 percent between 2010 and 2019 (Chart 8). Nationally, the increase has been more substantial, with the ratio rising from a pre-pandemic average of 19 percent to nearly 35 percent in 2026. Importantly, these mortgage-to-income ratios reflect new purchases. For a household who purchased a home before 2021, the affordability of a monthly mortgage payment has likely improved alongside higher incomes.
Chart 8. Monthly mortgage payment relative to household income
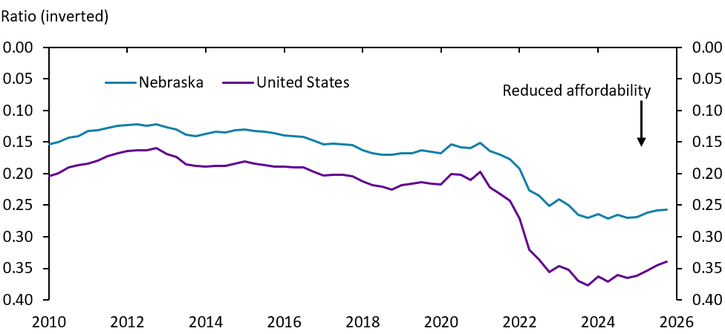
Note: Monthly mortgage payments represent the payment of a new home purchased in a given month, assuming a 20% down payment using the average 30-year fixed mortgage rate. Monthly payments also include monthly owner costs, assumed to be 3% of the purchase price. Household incomes are assumed to be 1.6x quarterly real per capita personal income. Similar calculations are used in Farha, McCoy, and Rodziewicz (2025).
Sources: BEA, Zillow, author’s calculations.
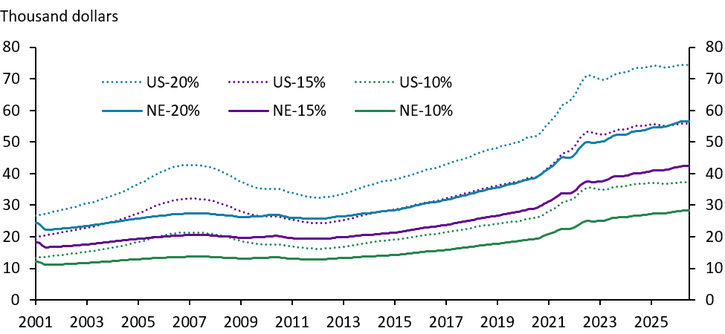
Standard down payments have risen alongside higher home prices in Nebraska, often a hurdle for first-time homebuyers. By the middle of 2026, a standard 20 percent down payment on a median-priced home in Nebraska was more than $56,000, more than double the payment on the same home in early 2010 (Chart 9). As a result, some buyers may opt for smaller down payments – a 10 percent down payment in July 2026 for a median-price home in Nebraska was slightly more than $28,000. Though higher house prices may require homebuyers to either save longer or make a smaller down payment, the amount of money required for a home purchase in Nebraska has remained less than similar requirements elsewhere.
Chart 9. Down Payments for Median-Priced House
Sources: Zillow, Haver Analytics, author’s calculations.
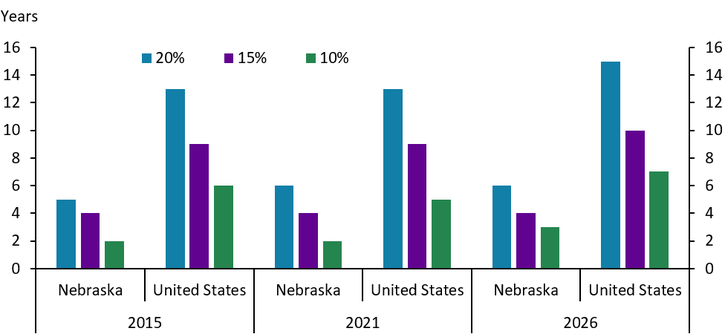
Nebraska's higher savings rates have made down payments more attainable than in the rest of the country, especially for first-time buyers. Using the cumulative savings estimates introduced earlier, the average first-time buyer in Nebraska in 2015 would have needed to save for 5 years to afford a 20 percent down payment on a home (Chart 10). By 2026, despite higher home prices, the time required had increased to just 6 years. In contrast, the average first-time buyer nationally would have needed to save for 15 years to reach the same 20 percent down payment in 2026.
Chart 10. Time Required to Save for Down Payment on a Median-Priced Home
Note: year refers to date of home purchase. Savings are summed annually using the savings before interest payments and transfers as detailed in the previous section. As in the previous section, savings do not include personal interest and transfer payments and assume savings held in cash rather than in an interest-bearing account or in another investment vehicle.
Sources: Zillow, Haver Analytics, author’s calculations.
Although households have faced ongoing financial pressure due to inflation, the severity of such pressure has varied across the country. The average household in Nebraska, for example, has remained in a relatively strong position compared with residents of many other states. Savings in Nebraska have remained robust alongside strong income growth and more moderate levels of consumption. The potential cumulative effect of higher savings over multiple consecutive years has provided some households with a savings buffer that may often be overlooked. In practical terms, this advantage has made large purchases like homeownership more attainable for first-time buyers in Nebraska than in much of the country.
Endnotes
-
1 A portion of cumulative savings would be devoted to personal interest payments (credit card, auto, student loan payments, etc.) and personal transfers (fines, foreign remittances). On the other hand, the chart also assumes that savings are held in cash and not in an interest-earning account or other investment vehicle.
The views expressed are those of the authors and do not necessarily reflect the positions of the Federal Reserve Bank of Kansas City or the Federal Reserve System.
Author