Nebraska's economy generally mirrors the nation, with steady growth and stable labor markets. Within the state, however, growth has been uneven, with more populous areas growing faster. Job growth has weakened, but unemployment has remained low and stable. In the near term, weakness in some goods-producing industries may be a headwind for rural areas. Over the longer term, demographic pressures may continue to strain rural parts of the state, particularly where housing and health care availability is lowest.
Section 1: Aggregate Economic Indicators in Nebraska Point to Steady Growth
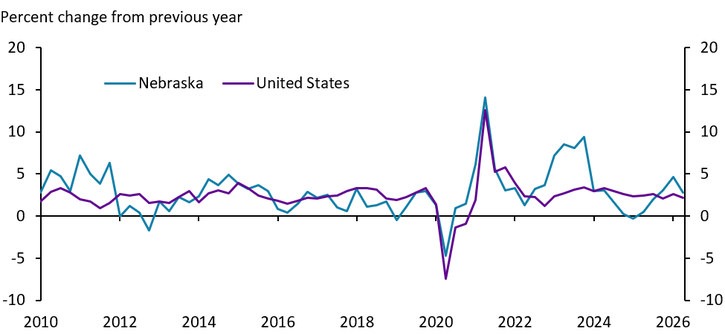
Economic activity in Nebraska rebounded in 2025 and exceeded the national rate of growth in the first half of 2026. Through June 2026, gross domestic product in Nebraska expanded at an average pace of 3.7 percent compared with 2025 (Chart 1). While more volatile, GDP growth in Nebraska has averaged more than 3.3 percent per year since 2019 compared with 2.5 percent nationally.
Chart 1. Gross Domestic Product
Sources: BEA, Haver Analytics.
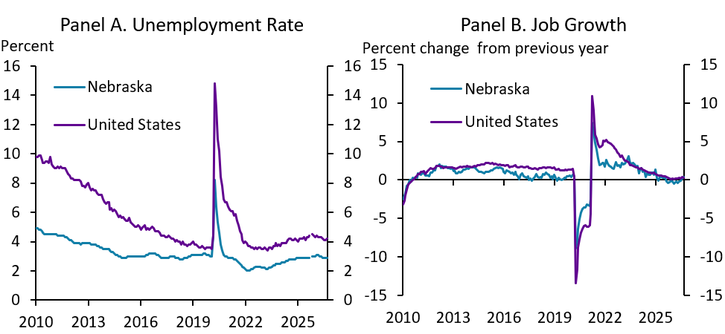
Labor markets have remained stable despite a weaker rate of hiring. As of September, the unemployment rate in Nebraska was 2.9 percent, above its post-pandemic low but approximately equal to the rate from 2019 (Chart 2, Panel A). Though unemployment has remained low, job growth has slowed. In 2026, employment in Nebraska has been 0.15 percent lower than in 2025 (Chart 2, Panel B). Demographic pressures, including lower immigration and increased retirements, have reduced the number of new jobs needed to maintain a low and stable unemployment rate both nationally and in Nebraska.
Chart 2. Labor Market Situation
Sources: BLS, Haver Analytics.
Section 2: Economic Growth Is Uneven Across Regions
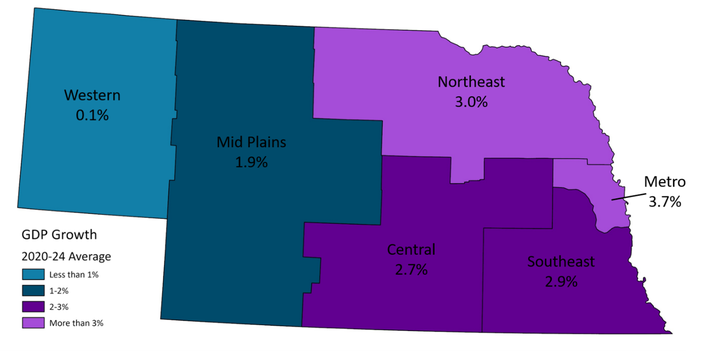
Since the pandemic, economic growth in Nebraska has been strongest in the more populous parts of the state. Growth in the Omaha metropolitan area was particularly strong (3.7%), though GDP in the eastern half of the state more broadly has also been robust since the pandemic (Map 1). Furthermore, though not depicted on the map, this recent growth in the eastern portion of the state has also exceeded the average rate of growth from 2010 to 2019. Together, the regions in purple account for 93 percent of statewide GDP – with Omaha alone accounting for 50 percent – and stronger growth in Omaha has helped push the statewide figure above the national rate of growth.
Map 1. Gross Domestic Product, Nebraska Regions
Sources: BEA, author’s calculations.
Despite more recent weakness, average job growth since the pandemic has been stronger than in pre-pandemic years. Further, job growth has been more broad-based than GDP growth. Only in western Nebraska did job growth substantially differ from the statewide figure (Chart 3). In the panhandle, employment grew just 0.05 percent per year on average, nearly a half percentage point below the statewide figure. Throughout the rest of the state, average job growth since 2020 has been essentially equal.
Chart 3. Job Growth, Nebraska Regions
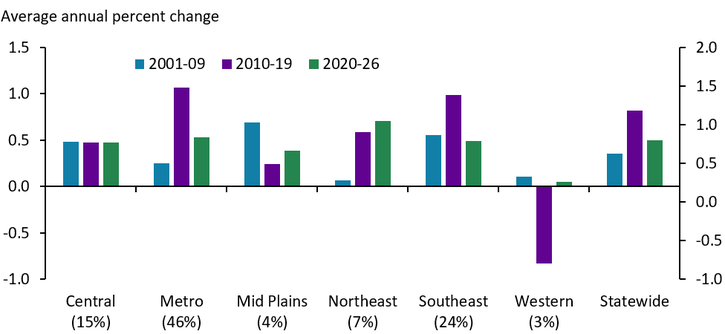
Note: Numbers in parentheses refer to share of statewide employment found in each region.
Sources: BLS, author’s calculations.
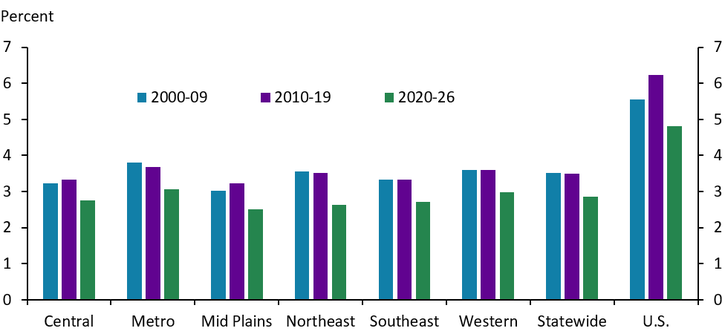
Mirroring broad-based job growth since the pandemic, unemployment conditions have been similar across regions in Nebraska. Since the pandemic, the average unemployment rate has been historically low relative to previous decades in every region (Chart 4). The unemployment rate in the mid plains region (2.5%), the lowest among the six regions of the state, has been about half the national average (4.8%) since the pandemic.
Chart 4. Average Unemployment Rate, Nebraska Regions
Sources: BLS, Haver Analytics, author’s calculations.
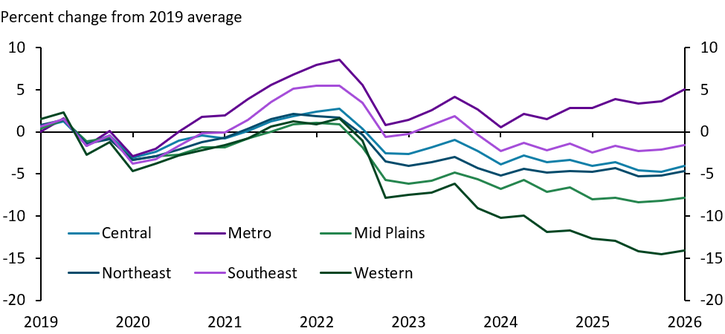
Despite broad job growth and low and stable unemployment, only in metropolitan Omaha has the number of establishments grown beyond its 2019 mark. Relative to 2019, the number of establishments – or physical locations where someone goes to work – has increased in Omaha by 5 percent (Chart 5). Throughout the rest of the state, the number of establishments has remained below the pre-pandemic level. The number of establishments in western Nebraska has declined most dramatically, having decreased nearly 15 percent relative to 2019. Outside of Omaha, steady job growth alongside a falling number of establishments could be indicative of business consolidation.
Chart 5. Establishments Open
Sources: BLS, author’s calculations.
Section 3: Some Goods-Producing Industries Are a Short-Term Headwind for Rural Areas
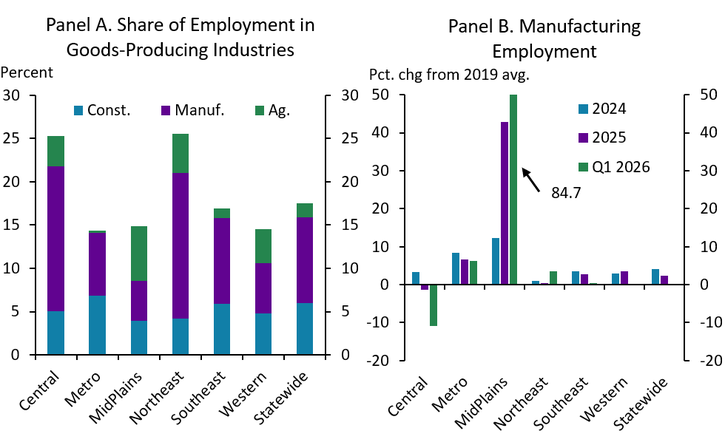
Goods-producing industries hold an outsized role in the economy of many Nebraska regions. In central and northeast Nebraska, more than a quarter of all jobs are in goods-producing industries (Chart 6, Panel A). Manufacturing has been a key sector in cities such as Grand Island, Columbus, and Norfolk, but the overall manufacturing environment across these regions has been mixed. While manufacturing employment in northeast Nebraska is about 3.5 percent greater than in 2019, the total number of manufacturing jobs in the central region has fallen by about 10 percent (Chart 6, Panel B). Headwinds in food processing – particularly in meatpacking –resulted in a major plant closure in central Nebraska, which accounts for most of the 10 percent decline in manufacturing employment.
Chart 6. Goods-Producing Employment in Nebraska
Note: natural resources employment includes agriculture and mining. Manufacturing employment in the mid plains region excludes Custer County due to data suppression beginning in 2020. Prior to the pandemic, Custer County accounted for approximately 36% of manufacturing employment in the Mid Plains region.
Sources: BLS, author’s calculations.
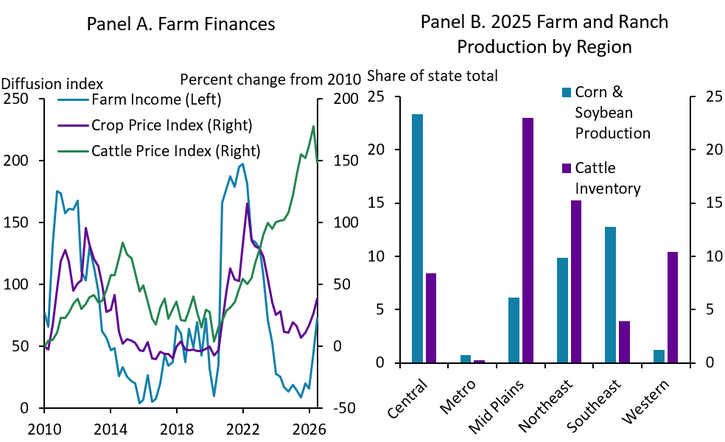
Agriculture, another major goods-producing industry, is especially prominent in regions further west, including the mid plains and western Nebraska. Farm income overall in Nebraska has been subdued since mid-2023 (Chart 7, Panel A). However, conditions have differed between crop producers and ranchers. Cattle prices, having increased more than 150 percent since 2010, have put ranchers in a relatively stronger financial position. Ranchers are disproportionately located in the mid plains and western Nebraska regions, which may have contributed to a brighter outlook for agriculture in those regions (Chart 7, Panel B). In contrast, crop prices are roughly equal to 2010 levels, dampening the outlook for crop producers and farm income in eastern Nebraska, where crop production is more prevalent.
Chart 7. Nebraska Agricultural Conditions
Note: Crop price index is the average of the index for corn, soybean and wheat prices. Production shares do not sum to 100 as a share of production data are not disclosed at the county level.
Sources: KC Fed Survey of Ag Credit Conditions, USDA, Haver Analytics and author’s calculations.
Section 4: Slowing Population Growth in Rural Areas Is an Obstacle for Future Growth
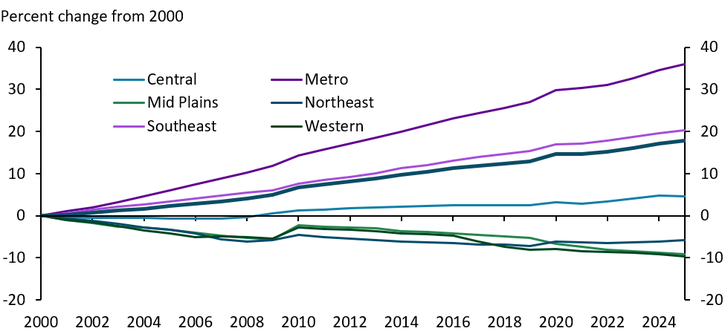
Since 2000, slow – or negative – population growth has challenged the more rural parts of Nebraska. In particular, population in central Nebraska was only 5 percent higher in 2025 than at the turn of the century and population has fallen in northeast Nebraska, western Nebraska, and in the mid plains (Chart 8). Economic activity may be limited in regions where populations are declining or growing slowly as businesses may find it harder both to hire workers and to maintain a local customer base.
Chart 8. Population Growth in Nebraska
Sources: Census Bureau, author’s calculations.
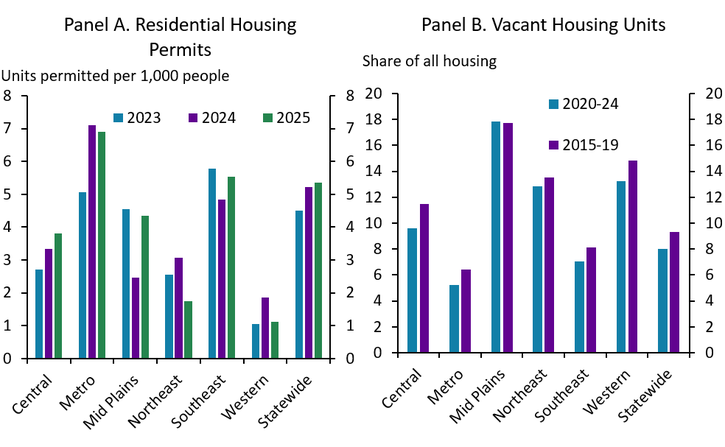
While many factors may influence population growth, one key obstacle may be the availability of housing. In the most populous, far eastern regions of Nebraska, builders have added between 5 and 7 new housing units per 1,000 people each year since 2023 (Chart 9, Panel A). In contrast, residential permitting in central Nebraska has been less than half the rate of Omaha, and builders in western Nebraska added an average of only 1 housing unit per 1,000 people in 2025.
In the absence of an increase in construction activity, some more rural communities may be able to refurbish existing housing stock to attract new residents. For example, nearly 18 percent of the existing housing stock in the mid plains region was vacant on average over the last decade (Chart 9, Panel B). A combination of new construction and the refurbishment of existing properties could help spur population growth in some communities.
Chart 9. Housing Availability in Nebraska
Note: Housing unit vacancy uses 5-year ACS Estimates.
Sources: Census Bureau, author’s calculations.
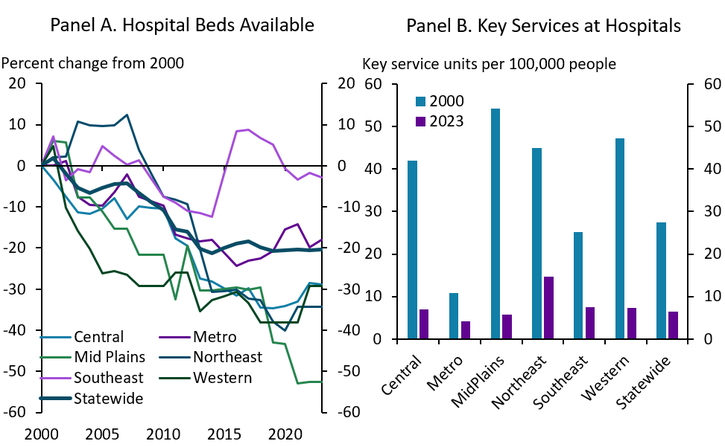
Similar to housing, the availability of health care may be a factor contributing to more sluggish population growth in some parts of Nebraska. Since 2000, health care has consolidated at an increasing pace, perhaps limiting availability. Throughout the state, the number of hospital beds available in the early 2020s was less than in 2000 (Chart 10, Panel A). The decrease in available beds has been most acute in regions outside of southeastern and metropolitan Nebraska. Alongside the decrease in beds, the number of unique service departments – such as emergency departments or labor and delivery units – has also decreased. In western Nebraska, there were nearly 50 unique service departments per 100,000 people in 2000 (Chart 10, Panel B). By 2023, there were fewer than 10 such health service departments per 100,000 people in the region.
Chart 10. Health Care Availability in Nebraska
Note: “Key Services” include general medicine and surgery care for adults, pediatric general medicine and surgery, obstetrics, general intensive care, physical rehabilitation, psychiatry, acute long-term care, alcohol and drug rehabilitation, emergency department, trauma center, oncology, outpatient surgery, primary care, urgent care, and women’s health.
Sources: HRSA Area Health Resources File, author’s calculations.
Nebraska's economy has remained stable, though its strength has been concentrated in the east. Statewide, labor conditions have been solid, with low unemployment and steady job growth in recent years. Over the longer term, slow or declining populations, limited housing construction, and reduced access to health care could constrain growth in rural areas. In the nearer term, however, the outlook for these more rural regions could still be more positive. Because many of these economies depend heavily on goods-producing industries, local conditions may improve if headwinds in crop production and meatpacking subside.
The views expressed are those of the authors and do not necessarily reflect the positions of the Federal Reserve Bank of Kansas City or the Federal Reserve System.
Author