Deterioration in agricultural credit conditions showed further signs of easing in the third quarter of 2026. According to Federal Reserve surveys of agricultural credit conditions, the average pace of decline in farm income and loan repayment rates slowed for the fourth consecutive quarter in some areas and farmland values remained strong. Financial conditions moderated alongside a rise in crop prices leading into the third quarter and helped mitigate some of the cost pressures from a spike in fuel costs. Weakness in crop profit opportunities remains a risk to further deterioration in farm finances; but government payments, strength in the cattle industry, and firm farmland values continue to support aggregate financial resilience in the sector.
Third Quarter Federal Reserve District Ag Credit Surveys
Deterioration in credit conditions slowed alongside less weakness in farm incomes. The average pace of decline in farm income across participating Districts was notably slower than a year ago (Chart 1). As finances moderated, the pace of decline in loan repayments also slowed and expansion of renewal and extension activity was less pronounced.
Chart 1: Farm Income and Credit Conditions
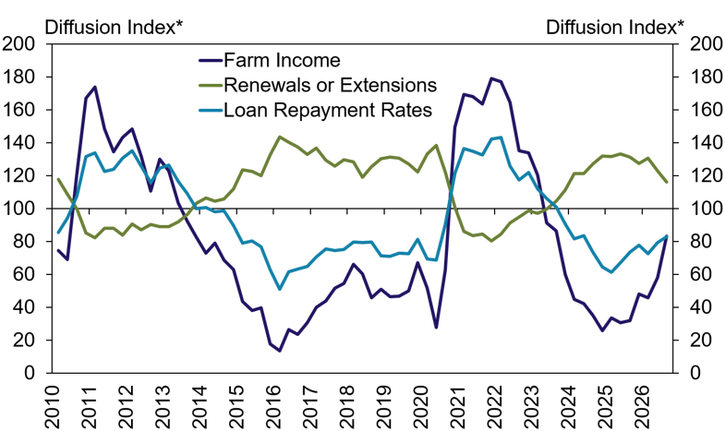
*Lenders responded by indicating whether conditions during the current quarter were higher than, lower than, or the same as in the year-earlier period. The index numbers are computed by subtracting the percentage of survey respondents who responded "lower" from the percentage who responded "higher" and adding 100.
Notes: The farm income index is the average of individual indices for the Kansas City, Minneapolis and St. Louis Districts. The loan repayment rate and renewal or extensions index is the average of individual indices for the Dallas, Chicago, Kansas City, Minneapolis and St. Louis Districts.
Source: Federal Reserve Surveys of Agricultural Credit Conditions
Growth in farm loan demand also showed signs of slowing. Demand for non-real estate farm loans continued to grow, but the average pace of increase was the slowest since 2023 (Chart 2). Availability of funds has remained relatively steady, with an average of only about 10% of lenders reporting that funding was lower than the same time a year ago.
Chart 2: Non-Real Estate Farm Loan Demand and Availability of Funds
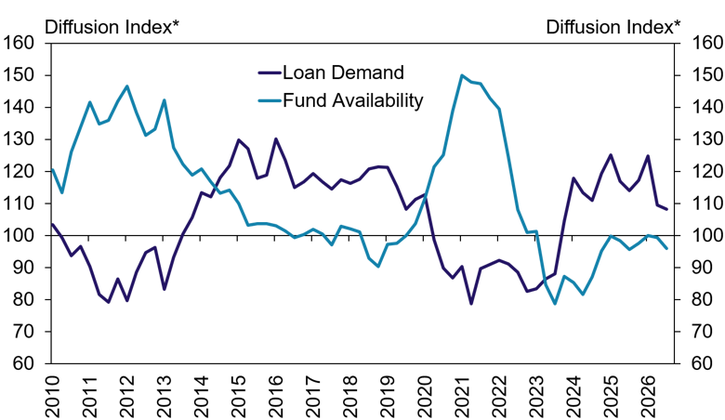
*Lenders responded by indicating whether conditions during the current quarter were higher than, lower than, or the same as in the year-earlier period. The index numbers are computed by subtracting the percentage of survey respondents who responded "lower" from the percentage who responded "higher" and adding 100.
Note: Each index is the average of individual indices for the Chicago, Dallas, Kansas City, Minneapolis and St. Louis Districts.
Source: Federal Reserve Surveys of Agricultural Credit Conditions
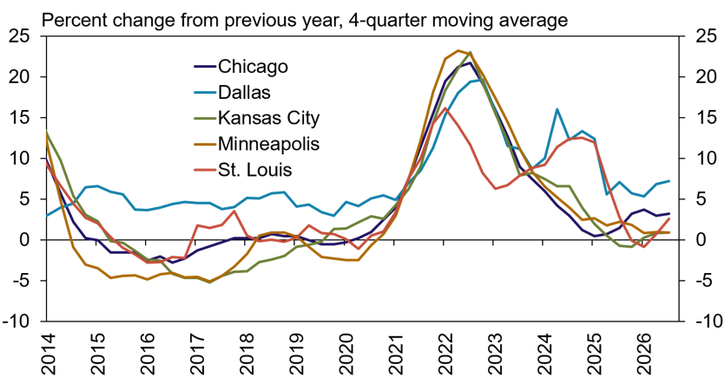
Alongside some moderation in farm financial conditions, farmland values remained strong. After softening slightly in some regions during 2025, the value of nonirrigated cropland has increased by an average of at least 1% over the past four quarters across all Districts (Chart 3). Growth remained above 5% in the Dallas region, near 3% in the Chicago and St. Louis regions and about 1% in the Minneapolis and Kansas City regions.
Chart 3: Nonirrigated Cropland Values
Source: Federal Reserve Surveys of Agricultural Credit Conditions
Farmland values remained strong despite a slight increase in farm loan interest rates. Following an increase in the federal funds rate at the beginning of the survey period, rates on farm operating loans increased by an average of about 20 basis points from the previous quarter across all Districts (Chart 4). Rates on farm real estate loans increased by an average of about 30 basis points over that same period.
Chart 4: Average Farm Loan Interest Rates
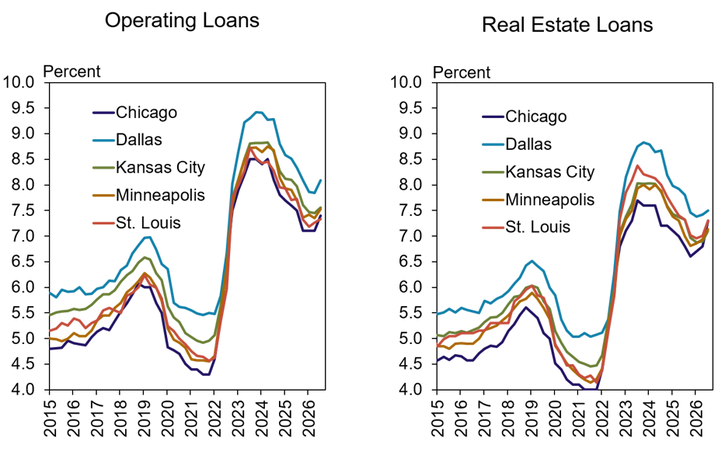
Note: Shown as average fixed and variable rates for each loan type.
Source: Federal Reserve Surveys of Agricultural Credit Conditions
Federal Reserve Ag Credit Surveys Tables
Federal Reserve Ag Credit Surveys Historical Data
External LinkAbout the Federal Reserve Ag Credit Surveys
The views expressed are those of the authors and do not necessarily reflect the positions of the Federal Reserve Bank of Kansas City or the Federal Reserve System.
Author