Farm real estate debt at commercial banks grew modestly in the first quarter, while production loans remained steady. Alongside soaring farmland values, real estate loan balances increased at the fastest pace in nearly four years and drove an increase in overall agricultural lending. Following a sharp pullback over the past two years, non-real estate lending was stable from a year ago. Farm loan performance also continued to improve, but performance at agricultural banks remained limited by compressed net interest margins and a glut of liquidity.
The farm economy remained strong alongside decade-high commodity prices that continued to support farm finances. Many producers have benefitted immensely from strong cash balances, but credit needs may rise as higher input costs weigh on profit margins. Estimates of new loan activity among a sample of commercial banks showed that farm lending accelerated during recent months alongside an increase in the size of operating loans and many bankers have also reported expectations of higher loan demand in the months ahead.
First Quarter Commercial Bank Call Report Data
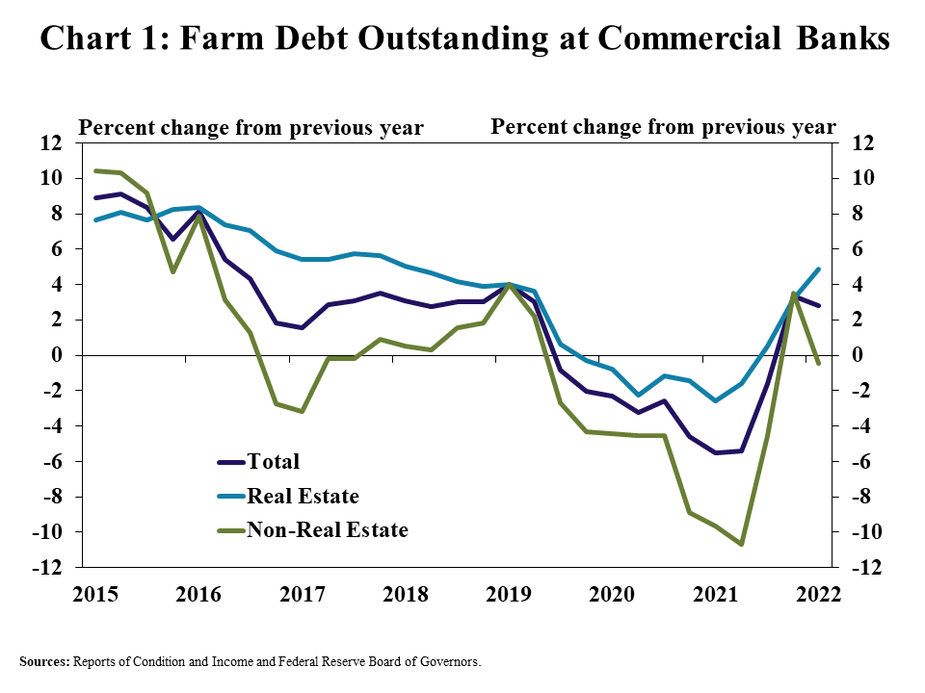
An increase in farm real estate debt boosted agricultural loan balances in the first quarter. Agricultural real estate loans increased about 5% from a year ago, which was the fastest pace of growth since 2018 (Chart 1). Production loans showed further signs of stabilizing and were nearly unchanged from this same time in 2021 after declining most of last year.
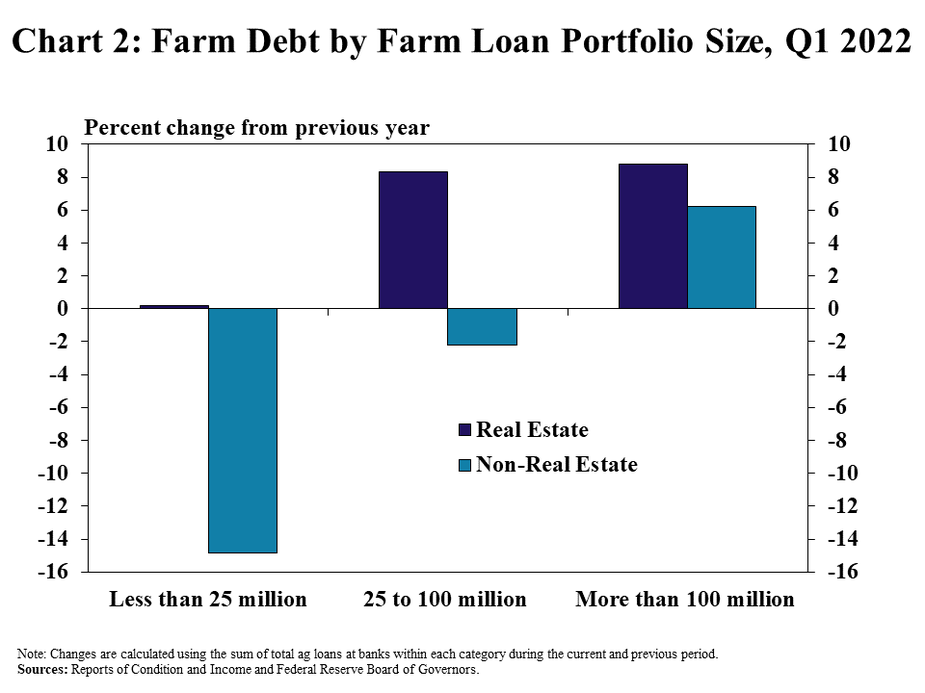
The growth in farm loans was driven by higher outstanding balances at large and mid-sized agricultural lenders. Farm real estate loans increased about 10% from a year ago at banks with large and mid-sized farm loan portfolios, but were mostly stable at the smallest farm lenders (Chart 2). In contrast, non-real estate debt was substantially lower at banks with small agricultural portfolios and increased at the largest lenders.
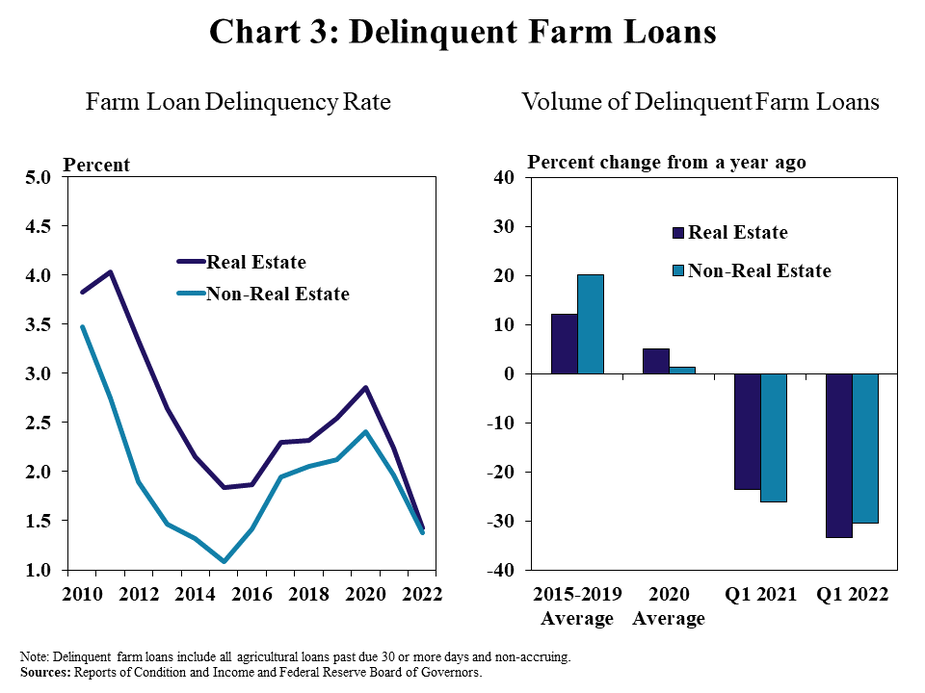
Alongside strong farm finances, loan performance improved further. The delinquency rate on farm real estate loans dropped to the lowest level on record for the first quarter and the rate of delinquency on production loans reach the lowest level since 2015 (Chart 3). The drop to historic lows was driven by continued sharp reductions in the volume of delinquent loans.
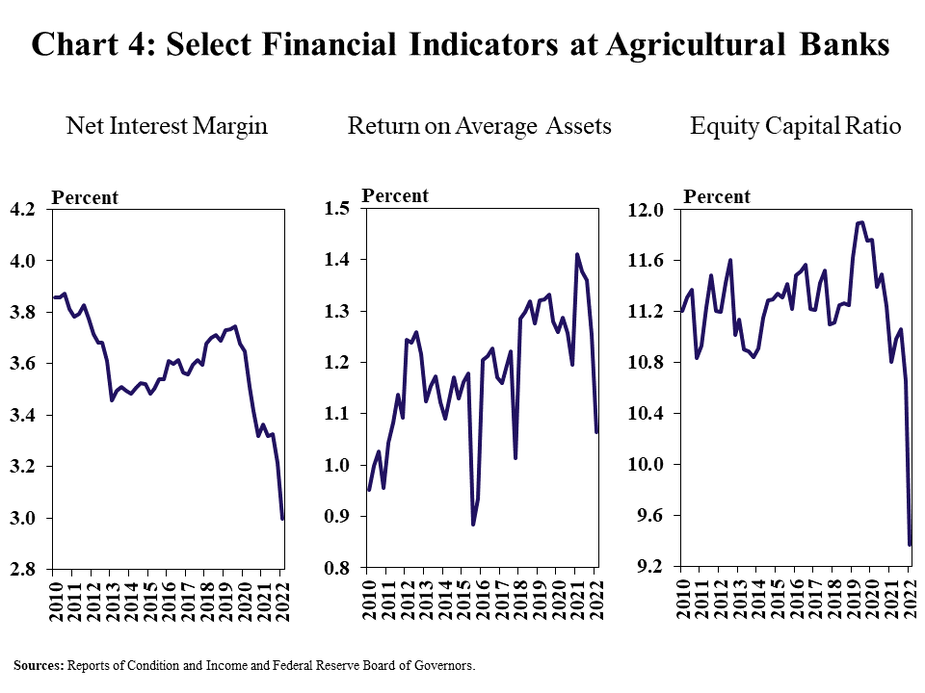
Despite strong credit conditions, financial performance at agricultural banks continued to be constrained by subdued loan demand and the low interest rate environment. Historically low interest rates together with an abundance of liquidity and soft farm loan demand during the past year pushed net interest margins to all-time lows and put downward pressure on overall returns (Chart 4). The drop in returns also contributed to a notable decline in capital ratios.
Data and Information
Commercial Bank Call Report Historical Data
Commercial Bank Call Report Data Tables
About the Commercial Bank Call Report Data
The views expressed in this article are those of the authors and do not necessarily reflect the views of the Federal Reserve Bank of Kansas City or the Federal Reserve System.
Authors

Nate Kauffman
Senior Vice President, Economist, and Omaha Branch Executive; Executive Director of the Center for Agriculture and the Economy
